Download presentation
Presentation is loading. Please wait.

1
Chapter 7 Components of Optical Instruments

2
Instruments for the ultraViolet (UV),ViSible , and infrared (IR) regions have enough features in common that they are often called optical instruments even though the human eye is not sensitive to ultraviolet or infrared wavelengths.
,ViSible , and infrared (IR) regions have enough features in common that they are often called optical instruments even though the human eye is not sensitive to ultraviolet or infrared wavelengths.")
3
7A GENERAL DESIGNS OF OPTICAL INSTRUMENTS

4
1. Absorption 2. Fluorescence 3. Phosphorescence 4. Scattering
Optical spectroscopic methods are based upon six phenomena: 1. Absorption 2. Fluorescence 3. Phosphorescence 4. Scattering 5. Emission 6. Chemiluminescence

5
Components of typical spectroscopic instruments:
A stable source of radiant energy (sources of radiation). A transparent container for holding the sample (sample cell). A device that isolates a restricted region of the spectrum for measurement (wavelength selector, monochromator or grating). A radiation detector, which converts radiant energy to a usable electrical signal. A signal processor and readout, which displays the transduced signal.
. A transparent container for holding the sample (sample cell). A device that isolates a restricted region of the spectrum for measurement (wavelength selector, monochromator or grating). A radiation detector, which converts radiant energy to a usable electrical signal. A signal processor and readout, which displays the transduced signal.")
6
FIGURE7-1 Components of various types of instruments for optical spectroscopy. In (a), the arrangement for absorption measurements is shown. Note that source radiation of the selected wavelength is sent through the sample, and the transmitted radiation is measured by the detector-signal processing-readout unit. With some instruments, the position of the sample and wavelength selector is reversed. In (b), the configuration for fluorescence measurements is shown. Here, two wavelength selectors are needed to select the excitation and emission wavelengths. The selected source radiation is incident on the sample and the radiation emitted is measured, usually at right angles to avoid scattering. In (c), the configuration for emission spectroscopy is shown. Here, a source of thermal energy, such as a flame or plasma, produces an analy1evapor that emits radiation isolated by the wavelength selector and converted to an electrical signal by the detector.
, the arrangement for absorption measurements is shown. Note that source radiation of the selected wavelength is sent through the sample, and the transmitted radiation is measured by the detector-signal processing-readout unit. With some instruments, the position of the sample and wavelength selector is reversed. In (b), the configuration for fluorescence measurements is shown. Here, two wavelength selectors are needed to select the excitation and emission wavelengths. The selected source radiation is incident on the sample and the radiation emitted is measured, usually at right angles to avoid scattering. In (c), the configuration for emission spectroscopy is shown. Here, a source of thermal energy, such as a flame or plasma, produces an analy1evapor that emits radiation isolated by the wavelength selector and converted to an electrical signal by the detector..")
7
FIGURE7-2 (a)construction materials and (b) wave length selectors for spectroscopic instruments.
construction materials and (b) wave length selectors for spectroscopic instruments.")
8
7B Sources of Radiation

9
Sources of Radiation 1. Continuum sources 2. Line Sources
In order to be suitable for spectroscopic studies, a source must generate a beam of radiation with sufficient power for easy detection and measurement and its output power should be stable for reasonable periods. Sources are of two types. 1. Continuum sources 2. Line Sources

10
7B-1 Continuum Sources

11
Continuum Sources: Continuum sources emit radiation that changes in intensity only slowly as a function of wavelength. It is widely used in absorption and fluorescence spectroscopy. For the ultraviolet region, the most common source is the deuterium lamp. High pressure gas filled arc lamps that contain argon, xenon, or mercury serve when a particular intense source is required. For the visible region of the spectrum, the tungsten filament lamp is used universally. The common infrared sources are inert solids heated to 1500 to 2000 K.

12
7B-2 Line Sources

13
Line Sources: Sources that emit a few discrete lines find wide use in atomic absorption spectroscopy, atomic and molecular fluorescence spectroscopy, and Raman spectroscopy. Mercury and sodium vapor lamps provide a relatively few sharp lines in the ultraviolet and visible regions and are used in several spectroscopic instruments. Hollow cathode lamps and electrodeless discharge lamps are the most important line sources for atomic absorption and fluorescence methods.

14
7 B-3 Laser Sources

15
Laser Sources The term ‘LASER’ is an acronym for Light Amplification by Stimulated Emission of Radiation. Laser are highly useful because of their very high intensities, narrow bandwidths, single wavelength, and coherent radiation. Laser are widely used in high-resolution spectroscopy.

16
FIGURE 7-2 (a) sources and (b) detectors for spectroscopic in struments.
 sources and (b) detectors for spectroscopic in struments.")
17
Components of Lasers

18
Component of Lasers: The important components of laser source are lasing medium, pumping source, and mirrors. The heart of the device is the lasing medium. It may be a solid crystal such as ruby, a semiconductor such as gallium arsenide, a solution of an organic dye or a gas such as argon or krypton.

19
“LASER” Light Amplification by Stimulated Emission of Radiation
Emits very intense, monochromatic light at high power (intensity) All waves in phase (unique), and parallel All waves are polarized in one plane Used to be expensive Not useful for scanning wavelengths
 All waves in phase (unique), and parallel. All waves are polarized in one plane. Used to be expensive. Not useful for scanning wavelengths.")
20
FIGURE 7-2 schematic representation of a typical laser source.
Laser Setup FIGURE 7-2 schematic representation of a typical laser source.

21
Lasing Mechanism

22
2. Spontaneous emission (fluorescence) 3. Stimulated emission
Four processes in Lasing Mechanism: 1. Pumping 2. Spontaneous emission (fluorescence) 3. Stimulated emission 4. Absorption
 3. Stimulated emission. 4. Absorption.")
23
Pumping Molecules of the active medium are excited to higher energy levels Energy for excitation electrical, light, or chemical reaction

24
Pumping

25
Differs in direction and phase
Spontaneous: Incoherent radiation Differs in direction and phase FIGURE 7·5 Four processes important in laser action: (a) pumping (excitation by electrical, radIant, or chemical energy), (b) spontaneous emission, (c) stimulated emission, and (d) absorption.
 pumping (excitation by electrical, radIant, or chemical energy), (b) spontaneous emission, (c) stimulated emission, and (d) absorption.")
26
2. Spontaneous Emission A molecule in an excited state can lose excess energy by emitting a photon (this is fluorescence) E = h = hc/; E = Ey – Ex E (fluorescence) < E (absorption) (fluorescence) > (absorption) [fluorescent light is at longer wavelength than excitation light]
 < E (absorption) (fluorescence) > (absorption) [fluorescent light is at longer wavelength than excitation light]")
27
Spontaneous Emission

28
3. Stimulated Emission Must have stimulated emission to have lasing Excited molecules interact with photons produced by emission Collision causes excited molecules to relax and emit a photon (i. e., emission) Photon energy of this emission = photon energy of collision photon now there are 2 photons with same energy (in same phase and same direction)
 Photon energy of this emission = photon energy of collision photon now there are 2 photons with same energy (in same phase and same direction)")
29
A photon incident on an excited state species causes emission of a second photon of the same frequency, which travels in exactly the same direction, and is precisely in phase with the first photo. M* + hM + 2h

30
Stimulated Emission

31
4. Absorption Competes with stimulated emission A molecule in the ground state absorbs photons and is promoted to the excited state Same energy level as pumping, but now the photons that were produced for lasing are gone

32
Absorption

33
Population Inversion and Light Amplification To have light amplification in a laser, the number of photons produced by stimulated emission must exceed the number lost by absorption. This condition prevails only when the number of particles in the higher energy state exceeds the number in the lower; in other words, there must be a population inversion from the normal distribution of energy states. Population inversions arc created by pumping.'

34
Population Inversion:
Must have population inversion to sustain lasing. Population of molecules is inverted (relative to how the population normally exists). Normally: there are more molecules in the ground state than in the excited state (need > 50 %). Population inversion: More molecules in the excited state than in the ground state.
. Normally: there are more molecules in the ground state than in the excited state (need > 50 %). Population inversion: More molecules in the excited state than in the ground state.")
35
Why is it important? More molecules in the ground state more molecules that can absorb photons Remember: absorption competes with stimulated emission Light is attenuated rather than amplified More molecules in the excited state net gain in photons produced

36
Population Inversion Necessary for Amplification
Population inversions are obtained by pumping FIGURE 7-6 Passage of radiation through (a) a noninverted population and (b) an inverted population created by excitation of electrons into virtual states by an external energy source (pumping).
 a noninverted population and (b) an inverted population created by excitation of electrons into virtual states by an external energy source (pumping).")
37
Three- and Four-Level Laser Systems

38
How to achieve population inversion?
Laser systems: 3-level or 4-Level 4-level is better easier to sustain population inversion 3-level system: lasing transition is between Ey (excited state) and the ground state 4-level system: lasing transition is between two energy levels (neither of which is ground state) All you need is to have more molecules in Ey than Ex for population inversion (4-level system) easier to achieve than more molecules in Ey than ground state (3-level system)
 and the ground state. 4-level system: lasing transition is between two energy levels (neither of which is ground state) All you need is to have more molecules in Ey than Ex for population inversion (4-level system) easier to achieve than more molecules in Ey than ground state (3-level system)")
39
In the three-level system, the transition responsible for laser radiation is between an excited state Ey and the ground state E0; in a four-level system, on the other hand. radiation is generated by a transition from Ey to a state Ex that has a greater energy than the ground state.

40
FIGURE 7-7 Energy level diagrams for two types of laser systems
Overall Easy population inversion FIGURE 7-7 Energy level diagrams for two types of laser systems

41
Advantages of Lasers Low Beam Divergence (“Small dot”)
Nearly Monochromatic (“narrow bandwidth”) Coherent (“constructive interference”)
 Coherent ( constructive interference )")
42
Types of Lasers Solid state lasers Gas lasers Dye lasers
Nd:YAG neodymium yttrium aluminum garnet 1064 nm Gas lasers lines w/ specific s in UV/vis/IR He/Ne Ar+, Kr+ CO2 eximers (XeF+,….) Dye lasers limited tunability in the visible Semiconductor diode lasers limited tunability in the IR, red
 Dye lasers. limited tunability in the visible. Semiconductor diode lasers. limited tunability in the IR, red.")
43
Semiconductor Diode Lasers

44
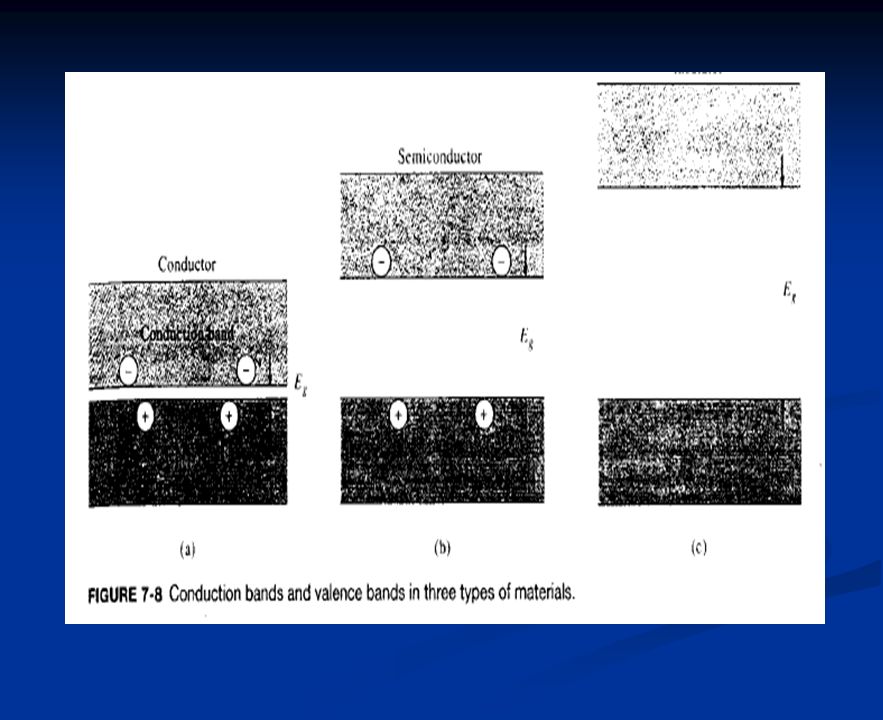
An increasingly important source of nearly monochromatic radiation is the laser diode. 7 Laser diodes are products of modern semiconductor technology. We can understand their mechanism of operation by considering the electrical conduction characteristics of various materials as illustrated in Figure 7-8.

46
FIGURE 7-9 A distributed Bragg-reftector laser diode. (From D. W
FIGURE 7-9 A distributed Bragg-reftector laser diode. (From D. W.Nam and R. G. Waarts, Laser Focus World, 1994, 30 (8),52. Reprinted with permission of PennWellPublishing Company.)
,52. Reprinted with permission of PennWellPublishing Company.)")
47
Nonlinear Optical Effects with Lasers

48
We noted in Section 6B-7 that when an electromagnetic wave is transmitted through a dielectric· medium, the electromagnetic field of the radiation causes momentary distortion, or polarization, of the valence electrons of the molecules that make up the medium. For ordinary radiation the extent of polarization P is directly' proportional to the magnitude of the electric field E of the radiation. Thus, we may write P=aE where" is the proportionality constant. observed, and the relationship between polarization and electric field is given by P = aE + f3E' + yE' (7-1)
 .")
49
FIGURE 7·10 A frequency-doubling system for converting 975-nm laser output to 490 nm. (From D. W.Nam and R. G. Waarts, Laser Focus World, 1994,30 (8), 52. Reprinted with permission of PennWeli Pubtishing Company.)
, 52. Reprinted with permission of PennWeli Pubtishing Company.).")
50
7 B: Wavelength Selectors

51
Wavelength Selectors Need to select wavelengths () of light for optical measurements. The output from a wavelength selector would be a radiation of a single wavelength or frequency. There are two types of wavelength selector: 1. Filters 2. Monochromators Gratings 4 . Michelson Interferometer
 of light for optical measurements. The output from a wavelength selector would be a radiation of a single wavelength or frequency. There are two types of wavelength selector: 1. Filters. 2. Monochromators 3. Gratings. 4 . Michelson Interferometer.")
52
Wavelength Selectors…..
Used to select the wavelength (or wavelength range) of light that either impinges on the sample (fluorescence and phosphorescence) is transmitted through the sample (absorption and emission) This selected wavelength then strikes the detector the ability to select the wavelength helps you to discriminated between phenomena caused by your analyte and that caused by interfering or non-relevant species. Are often combined with a set of SLITS (discussed later) Various types based on filters (CHEAP COLORED GLASS) based on prisms (LIMITED APPLICATIONS) based on gratings…. (GREAT STUFF)
 of light that either. impinges on the sample (fluorescence and phosphorescence) is transmitted through the sample (absorption and emission) This selected wavelength then strikes the detector. the ability to select the wavelength helps you to discriminated between phenomena caused by your analyte and that caused by interfering or non-relevant species. Are often combined with a set of SLITS (discussed later) Various types. based on filters (CHEAP COLORED GLASS) based on prisms (LIMITED APPLICATIONS) based on gratings…. (GREAT STUFF)")
53
FIGURE 7-11 Out put of typical wave length selsctor.

54
7 C-1 Filters

55
Filters Two types of filters:
Simple, rugged (no moving parts in general) Relatively inexpensive Can select some broad range of wavelengths Most often used in field instruments simpler instruments instruments dedicated to monitoring a single wavelength range. Two types of filters: Interference filters depend on destructive interference of the impinging light to allow a limited range of wavelengths to pass through them (more expensive) Absorption filters absorb specific wavelength ranges of light (cheaper, more common)...
 Relatively inexpensive. Can select some broad range of wavelengths. Most often used in. field instruments. simpler instruments. instruments dedicated to monitoring a single wavelength range. Two types of filters: Interference filters depend on destructive interference of the impinging light to allow a limited range of wavelengths to pass through them (more expensive) Absorption filters absorb specific wavelength ranges of light (cheaper, more common)...")
56
Interference filters

57
Interference Filters Dielectric layer between two metallic films Radiation hits filter some reflected, some transmitted (transmitted light reflects off bottom surface) If proper radiation reflected light in phase w/incoming radiation: other undergo destructive interference i.e., s of interest constructive interference (transmitted through filter); unwanted s destructive interference (blocked by filter) Result: narrow range of s transmitted
 If proper radiation reflected light in phase w/incoming radiation: other undergo destructive interference. i.e., s of interest constructive interference (transmitted through filter); unwanted s destructive interference (blocked by filter) Result: narrow range of s transmitted.")
58
FIGURE 7-12 (a) Schematic cross section of an interference filter
FIGURE 7-12 (a) Schematic cross section of an interference filter.Note that the drawing is not to scale and that the three central bands are much narrower than shown. (b) Schematic to show the conditions for constructive interference.
 Schematic cross section of an interference filter.Note that the drawing is not to scale and that the three central bands are much narrower than shown. (b) Schematic to show the conditions for constructive interference.")
59
Fabry-Perot Filters (Interference Filters)
Calcium or Magnesium Fluoride (FLUORITE!) A dielectric material is a substance that is a poor conductor of electricity, but an efficient supporter of electrostatic fields. t From 1 to 1’: For reinforcement to occur at point 2, N is order of interference (a small whole number) Douglas A. Skoog and James J. Leary, Principles of Instrumental Analysis, Saunders College Publishing, Fort Worth, 1992.
 A dielectric material is a substance that is a poor conductor of electricity, but an efficient supporter of electrostatic fields. t. From 1 to 1’: For reinforcement to occur at point 2, N is order of interference (a small whole number) Douglas A. Skoog and James J. Leary, Principles of Instrumental Analysis, Saunders College Publishing, Fort Worth,")
60
Fabry-Perot Filters (Interference Filters)
When approaches zero n’ = 2t Snell’s law: /’ = ’/ then = ’ t is the wavelength passing the filter and is the refractive index of the dielectric medium Are we missing something?

61
Interference Wedges

62
An interference wedge consists of a pair of mirrored, partially transparent plates separated by a wedgeshape layer of a dielectric material.

63
FIGURE 7-13 Transmission characterics of typical interference filters.

64
Absorption filters

65
Absorption Filters Colored glass (broader bandwidth: ~ nm vs. ~10-nm with interference filters) Glass absorbs certain s while transmitting others Types Bandpass: passes nm Cut-off (e.g., high-pass) Passes high wavelengths, blocks low wavelengths Type of filter could be used for emission or fluorescence (since excitation light is lower and should be blocked; emission is higher and should be collected).
 Passes high wavelengths, blocks low wavelengths. Type of filter could be used for emission or fluorescence (since excitation light is lower and should be blocked; emission is higher and should be collected).")
66
Characteristics of absorption filter
Cheaper than interference filter Worse than interference filter But widely used Absorption some spectral range Effective bandwidth = 30 ~ 250 nm %T = less than 10% Cut-off filter types Dye suspended in gelatin Colored glass (stable to heat)
")
67
Cut off filteres

68
Cut off filteres : have transmittances of nearly 100% over a portion of the visible spectrum but then rapidly decrease to zero transmittance over the remainder. A narrow spectral band can be isolated by coupling a cutoff filter with a second filter (see Figure 7-15). Figure 7-14shows that the performance characteristics of absorption filters are significantly inferior to those of interference-type filters.
. Figure 7-14shows that the performance characteristics of absorption filters are significantly inferior to those of interference-type filters..")
69
Two basic filter functions….
cutoff filters absorb light in a specific range of wavelengths. They “cutoff” this range from the detectors (e.g. cutoff for 550 nm) Absorption filters are cutoffs. bandpass filters absorb light outside of a specific range (e.g nm) Interference filters are bandpass or you can make a bandpass from a combination of two cutoff filters!
 Absorption filters are cutoffs. bandpass filters absorb light outside of a specific range (e.g nm) Interference filters are bandpass or you can make a bandpass from a combination of two cutoff filters!")
70
Comparison of various types of absorption filters for visible radiation.

72
7 C-2 Monochromators A) Prism Monochromators B)Grating Monochromators C)Echelle Monochromators.
 Prism Monochromators B)Grating Monochromators C)Echelle Monochromators.")
73
Monochromators: For many spectroscopic methods, it is necessary or desirable to be able to continuously vary the wavelength of radiation over a broad range. This process is called scan ing a spectrum. Monochromators are designed for spectral scanning. Monochromators for ultraviolet, visible, and infrared radiation arc all similar in mechanical const ruction in the sense that they use slits, lenses, mirrors, windows, and gratings or prisms. The materials from which these components are fabricated depend on the wavelength region of intended use

74
Components of Monochromators Figure 7-18 illustrates the optical elements found in all monochromators, which include the following: (I) an entrance slit that provides a rectangular optical image, (2) a collimating lens or mirror that produces a parallel beam of radiation, (3) a prism or a grating that disperses the radiation into its component wavelengths, (4) a focusing element that reforms the image of the entrance slit and focuses it on a planar surface called a focal plane, and (5) an exit slit in the focal plane that isolates the desired spectral band.
 an entrance slit that provides a rectangular optical image, (2) a collimating lens or mirror that produces a parallel beam of radiation, (3) a prism or a grating that disperses the radiation into its component wavelengths, (4) a focusing element that reforms the image of the entrance slit and focuses it on a planar surface called a focal plane, and (5) an exit slit in the focal plane that isolates the desired spectral band.")
75
FIGURE 7-18 Two types of monochromators: (a) Czerney-Tumer grating monochromator and (b) Bunsen prism monochromator. (Inboth instances, Al > A,.)
.")
77
A) Prism Monochromators
 Prism Monochromators")
78
Prism Monochromators Prisms can be used to disperse ultraviolet, visible, and infrared radiation. The material used for their construction differs, however, depending on the wavelength region (see Figure 7-2b). Figure 7-20 shows the two most common types of prism designs_ The first is a 60° prism, which is usually fabricated from a single block of material. When crystalline (but not fused) quartz is the construction material, however, the prism is usually formed by cementing two 30° prisms together, as shown in Figure 7-20a; one is fabricated from right -handed quartz and the second from left-handed quartz in this way, the optically active quartz causes no net polarization of the emitted radiation; this type of prism is called a Cornu prism. Figure 7-18b shows a Bunsen monochromator, which uses a 60° prism, likewise often made of quartz.
. Figure 7-20 shows the two most common types of prism designs_ The first is a 60° prism, which is usually fabricated from a single block of material. When crystalline (but not fused) quartz is the construction material, however, the prism is usually formed by cementing two 30° prisms together, as shown in Figure 7-20a; one is fabricated from right -handed quartz and the second from left-handed quartz in this way, the optically active quartz causes no net polarization of the emitted radiation; this type of prism is called a Cornu prism. Figure 7-18b shows a Bunsen monochromator, which uses a 60° prism, likewise often made of quartz.")
79
FIGURE 7-20 Dispersion by a prism: (a) quartz Cornu type and (b) Littrow type.
 quartz Cornu type and (b) Littrow type.")
80
Prisms First type of widely used, “scanning” wavelength selection devices (TURN PRISM) Often made of salts such as sodium chloride, fluorites etc (Remember figure 7-2b). VERY delicate. Often subject to damage in humidity and wide heat ranges. Not widely used today in spectroscopy equipment. Great demonstration tools for kids Nice on the cover of a Pink Floyd album
. VERY delicate. Often subject to damage in humidity and wide heat ranges. Not widely used today in spectroscopy equipment. Great demonstration tools for kids. Nice on the cover of a Pink Floyd album.")
81
Prisms Douglas A. Skoog, F. James Holler and Timothy A. Nieman, Principles of Instrumental Analysis, Saunders College Publishing, Philadelphia, 1998.

82
Prism

83
B) Grating Monochromators
 Grating Monochromators")
84
Grating Monochromators (scan a spectrum)
Scan spectrum = vary continuously Materials for construction = range of interest Components of a grating monochromator 1. Entrance slit (rectangular image) 2. Collimating optic (parallel beam) 3. Grating (disperses light into separate s) 4. Focusing optic (reforms rectangular image) 5. Exit slit at focal plane of focusing optic (isolates desired spectral band)
 2. Collimating optic (parallel beam) 3. Grating (disperses light into separate s) 4. Focusing optic (reforms rectangular image) 5. Exit slit at focal plane of focusing optic (isolates desired spectral band)")
85
Reflection Gratings Widely used in instruments today.
Light reflected off a surface, and not cancelled out by destructive interference, is used for selection of wavelengths Constructed of various materials…. Polished glass, silica or polymer substrate Grooves milled or laser etched into the surface Coated with a reflective material (silvered) such as a shiny metal VERY FRAGILE!! Sealed inside the instrument. DO NOT TOUCH!
 such as a shiny metal. VERY FRAGILE!! Sealed inside the instrument. DO NOT TOUCH!")
86
Reflection (Diffraction) Gratings...
Widely used in instruments today. Light reflected off a surface, and not cancelled out by destructive interference, is used for selection of wavelengths Constructed of various materials…. Polished glass, silica or polymer substrate Grooves milled or laser etched into the surface Coated with a reflective material (silvered) such as a shiny metal VERY FRAGILE!! Sealed inside the instrument. DO NOT TOUCH! Laser Cut have 100’s ’s of lines (blazes) per mm High resolution (<0.01 nm) if needed Most expensive optical part of an instrument
 such as a shiny metal. VERY FRAGILE!! Sealed inside the instrument. DO NOT TOUCH! Laser Cut have 100’s ’s of lines (blazes) per mm. High resolution (<0.01 nm) if needed. Most expensive optical part of an instrument.")
87
Reflection Gratings Light hits grating and light is dispersed Tilt grating to vary which is passed at exit slit during the scan

88
1.The EchelletteGrating 2 . Concave Gratings 3.Holographic Gratings
Grating Monochromators 1.The EchelletteGrating 2 . Concave Gratings 3.Holographic Gratings

89
Construction of Gratings…..
The substrate is formed and polished. It is then blazed by one of a number of techniques… Cut using mechanical tools Poor reproducibility in shape and spacing of the blazes Etched using chemicals Better but still not very good Laser etched blazes (aka holographic gratings). Best method for production Closely spaced blazes (high # of lines/mm) means a greater capacity to separate light into component wavelengths Good reproducibility from blaze to blaze means that the grating produces fewer “defects” such as double images Most common method today The substrate is then coated with a very thin (few molecules or atoms thick) film of reflective material The grating is then mounted in a holder and will never be touched by anything if correctly cared for
. Best method for production. Closely spaced blazes (high # of lines/mm) means a greater capacity to separate light into component wavelengths. Good reproducibility from blaze to blaze means that the grating produces fewer defects such as double images. Most common method today. The substrate is then coated with a very thin (few molecules or atoms thick) film of reflective material. The grating is then mounted in a holder and will never be touched by anything if correctly cared for.")
90
1. echellette -type grating
1. echellette -type grating Figure 7-21 is a schematic representation of an echellette -type grating, which is grooved, or blazed, such that it has relatively broad faces from which reflection occurs and narrow unused faces. This geometry provides highly efficient diffraction of radiation, and the reason for blazing is to concentrate the radiation in a preferred direction . Each of the broad faces can be considered to be a line source of radiation perpendicular to the plane of the page; thus interference among the reflected beams 1,2, and 3 can occur. For the interference to be constructive, it is necessary that the path lengths differ by an integral multiplen of the wavelength A of the incident beam.

91
echellette -type grating

92
Echelle grating Advantages
The advantage of an echelle high efficiency and low polarization effects over large spectral intervals Together with high dispersion, this leads to compact, high-resolution instruments. An important limitation of echelle the orders overlap unless separated optically, for instance by a cross-dispersing element. A prism or echelette grating is often used for this purpose. For broad spectral range, to use many sucessive orders

93
Grating with 1450 blazes/mm Polychromatic light at i = 48 deg
Example 7-1 Grating with 1450 blazes/mm Polychromatic light at i = 48 deg L of the monochromatic reflected light at R = +20,+10 and 0 deg? d(sin i + sin r) = nl 1) Calculate “d” d= 1 mm/1450 blazes convert to nm x106 nm per groove! d(sin i + sin r) = nl 2) Calculate “l” for n=1 at +20 deg l= nm ( sin 48 + sin 20)/1 = nm! Grating will give a monochromatic beam of light of nm at 20 deg, 632 nm at 10 deg and 513 nm at 0 deg. For n=1!
 = nl 1) Calculate d d= 1 mm/1450 blazes convert to nm x106 nm per groove! d(sin i + sin r) = nl 2) Calculate l for n=1 at +20 deg. l= nm ( sin 48 + sin 20)/1 = nm! Grating will give a monochromatic beam of light of nm at 20 deg, 632 nm at 10 deg and 513 nm at 0 deg. For n=1!")
94
New holographic gratings can have up to 64K grooves!
Resolution New holographic gratings can have up to 64K grooves! More grooves = better resolving power R = l/Dl (1K to 10K) R = nN (N = grooves!) How well can you focus on two adjacent wavelengths! Eugene Hecht, Optics, Addison-Wesley, Reading, MA, 1998.
 R = nN (N = grooves!) How well can you focus on two adjacent wavelengths! Eugene Hecht, Optics, Addison-Wesley, Reading, MA,")
95
2. Concave Gratings. Gratings can he formed on a concave surface in much the same way as on a plane surface. A concave grating permits the design of a monochromator without auxiliary collimating and focusing mirrors or lenses because the concave surface both disperses the radiation and focuses it on the exit slit. Such an arrangement is advantageous in terms of cost: in addition. the reduction in number of optical surfaces increases the energy throughput of a monochromator that contains a concave grating.

96
3. Holographic Gratings . Holographic gratings are appearing in ever-increasing numbers in modern optical instruments, even some of the less expensive ones.

97
Grating Equation d: Spacing between the reflecting surfaces
Grooved or blazed. Provides highly efficient diffraction (small enough in size compared to wavelength) of radiation. Each broad face is considered as a point source. Douglas A. Skoog and James J. Leary, Principles of Instrumental Analysis, Saunders College Publishing, Fort Worth, 1992.
 of radiation. Each broad face is considered as a point source. Douglas A. Skoog and James J. Leary, Principles of Instrumental Analysis, Saunders College Publishing, Fort Worth,")
98
n = d(sini + sinr) d: Spacing between the reflecting surfaces
Beam 2travels a greater distance than beam 1, for constructive interferences to occur, CB + BD = n angle i = CAB, angle r = DAB CB = dsini, BD = dsinr n = d(sini + sinr)
")
99
Performance Characteristics the relationship of Grating Monochromators
1.Spectral Purity. 2.Dispersion of Grating Monochromators. 3.Resolving Power of Monochromators. 4.light-Gathering power of Monochromators.

100
The quality of a monochromator depends on the purity of its radiant output, its ability to resolve adjacent wavelengths, its light-gathering power, and its spectral bandwidth.

101
1. Spectral Purity The exit beam of a monochromator is usually contaminated with small amounts of scattered or stray radiation with wavelengths far different from that of the instrument selling.

102
2. Dispersion of Grating Dispersion of Grating: Monochromators. The ability of a monochromator to separate different wavelengths depends on its dispersion. The angular dispersion is given by drld λ, where dr is the change in the angle of reflection or refraction with a change in wavelength dλ.

103
3. Resolving Power of Monochromators.
The resolving power R of a monochromator describes the limit of its ability to separate adjacent images that have a slight difference in wavelength. R=λ/∆λ R=λ/∆λ =nN

104
4. light-Gathering power of Monochromators
To in crease the signal-to-noise ratio of a spectrometer, it is necessary that the radiant energy that reaches the detector be as large as possible. The number F. or speed provides a measure of the ability of a monochromator To collect the radiation that emerges from the entran slit. The f.number is defined by:

105
C) Echelle Monochromators
 Echelle Monochromators")
106
Echelle monochromators
contain two dispersing elements arranged in series. The first of these elements is a special type of grating called an echelle grating. The second, which follows, is usually a low-dispersion prism, or sometimes a grating. The echelle grating, which was first described by G. R. Harrison in 1949, provides higher dispersion and higher resolution than an echellette of the same size.

107
Echelle grating: Light is reflected off the short side of the blazes (grooves) in the grating.
 in the grating.")
108
`

109
2-D distribution of light and detection
using an array of transducers (for later)
")
110
7C-3 Monochromator Slits

111
Slits = hole in the wall Control the entrance of light into and out from the monochromator. They control quality! Entrance slits control the intensity of light entering the monochromator and help control the range of wavelengths of light that strike the grating Less important than exit slits Exit slights help select the range of wavelengths that exit the monochromator and strike the detector More important than entrance slits Can be: Fixed (just a slot) Adjustable in width (effective bandwidth and intensity) Adjustable in height (intensity of light)
 Adjustable in width (effective bandwidth and intensity) Adjustable in height (intensity of light)")
112
Monochromator Slits Good slits Entrance slit
Two pieces of metal to give sharp edges Parallel to one another Spacing can be adjusted in some models Entrance slit Serves as a radiation source Focusing on the slit plane

113
Effect of Slit Width on Resolution

114
Effect of slit width on resolution
Bandwidth Defined as a span of monochromator setting needed to move the image of the entrance slit across the exit slit Effective bandwidth Dleff ½ of the bandwidth When two slits are identical FIGURE 7-24 Illumination of an exit slit by monochromatic radiation λ at various monochromator settings. Exit and entrance slits are identical.

116
Calculating slit width
Effective bandwidth(Dleff) and D-1 D-1 = Dl/Dy When Dy = w = (slit width) D-1 = Dleff /w Example Recpiprocal linear dispersion = 1.2nm/mm Sodium lines at nm and nm Required slit width? Dleff = ½ ( ) = 0.3 nm W = 0.3 nm/(1.2 nm/mm) = 0.25 mm Practically, narrower than the theoretical values is necessary to achieve a desired resolution
 and D-1. D-1 = Dl/Dy. When Dy = w = (slit width) D-1 = Dleff /w. Example. Recpiprocal linear dispersion = 1.2nm/mm. Sodium lines at nm and nm. Required slit width Dleff = ½ ( ) = 0.3 nm. W = 0.3 nm/(1.2 nm/mm) = 0.25 mm. Practically, narrower than the theoretical values is necessary to achieve a desired resolution.")
117
Wider slits = greater intensity, More signal trading off with
Poorer resolution Narrower slits = lower intensity, Less signal trading off with Better resolution FIGURE 7-25 The effect of the slit width on spectra. The entrance slit is illuminated with A" A" and A 3 only. Entrance and exit slits are identical. Plots on the right show changes in emitted power as the setting of monochromator is varied.

118
Wider slits = greater intensity,
Poorer resolution Narrower slits = lower intensity, Better resolution

119
Choice of slit widths Variable slits for effective bandwidth
Narrow spectrum Minimal slit width Bet decrease in the radiant power Quantitative analysis Wider slit width for “more” radiant power

120
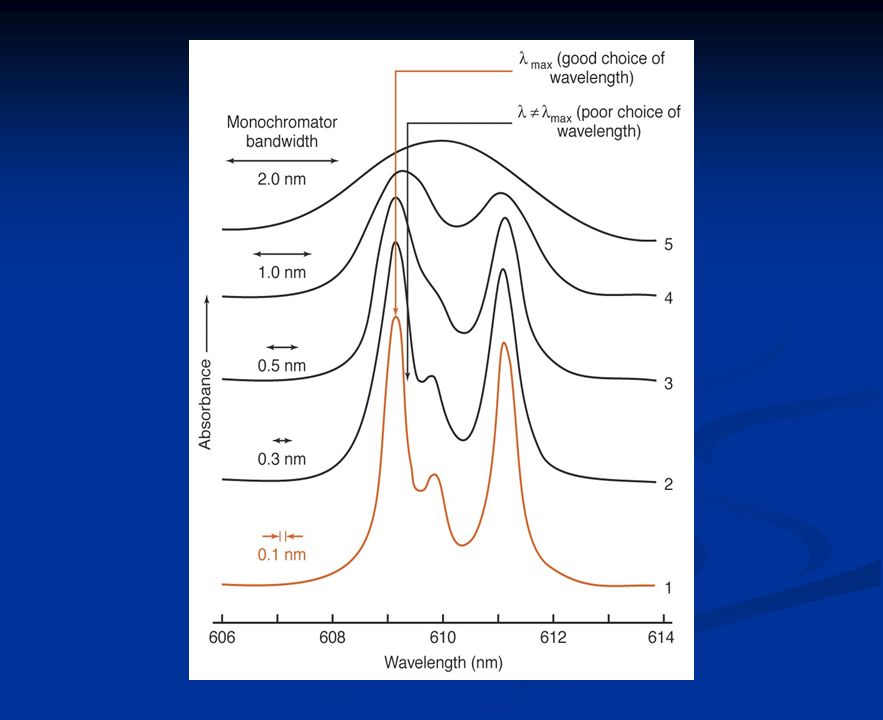
Effect of bandwidth on spectral detail for benzene vapor

121
Sample Holders (Cells)
")
122
Sample Holders (Cells)
Must: contain the sample without chemical interaction be more-or-less transparent to the wavelengths of light in use be readily cleaned for reuse be designed for the specific instrument of interest…. Examples quartz is good from about nm glass is a less expensive alternative from about nm NaCl and KBr are good to much higher wavelengths (IR range) Cells can be constructed to: transmit light absorbed at 180 degrees to the incident light allow emitted light to exit at 90 degrees from the incident light contain gases (lower concentrations) and have long path lengths (1.0 and 10.0 cm cells are most common)
 Cells can be constructed to: transmit light absorbed at 180 degrees to the incident light. allow emitted light to exit at 90 degrees from the incident light. contain gases (lower concentrations) and have long path lengths (1.0 and 10.0 cm cells are most common)")
123
Sample Containers The cells or cuvettes that hold the samples must be made of material that is transparent to radiation in the spectral region of interest. Quartz or fused silica is required for work in the ultraviolet region (below 350 nm), both of these substances are transparent in the visible region. Silicate glasses can be employed in the region between 350 and 2000 nm. Plastic containers can be used in the visible region. Crystalline NaCl is the most common cell windows in the i.r region.
, both of these substances are transparent in the visible region. Silicate glasses can be employed in the region between 350 and 2000 nm. Plastic containers can be used in the visible region. Crystalline NaCl is the most common cell windows in the i.r region.")
124
Absorbance: usually in a matched pair!
Fluorescence, Phosphorescence, Chemiluminescence

125
Different Shapes and Sizes of Cells

126
Radiation Transducers

127
Radiation Transducers

128
Radiation Transducers Introduction
The detectors for early spectroscopic instruments were the human eye or a photographic plate or film. Now a days more modern detectors are in use that convert radiant energy into electrical signal.

129
properties of the Ideal Transducer
The ideal transducer would have a high sensitivity, a high signal-to-noise ratio, and a constant response over a considerable range of wavelengths. In addition, it would exhibit a fast response time and a zero output signal in the absence of illumination, Finally, the electrical signal produced by the ideal transducer would be directly proportional to the radiant power P.

130
Types of Radiation Transducers
As indicated in Figure 7-3b, there arc two general types of radiation transducers.2o One type responds to photons, the other to heat. All photon transducers (also called photoelectric or quantum detectors) have an active surface that absorbs radiation. [n some types, the absorbed energy causes emission of electrons and the production of a photocurrent. In others, the radiation promotes electrons into conduction bands: detection here is based on the resulting enhanced conductivity (photo conduction), Photon transducers are used largely for measurement of UV, visible, and near infrared radiation.
 have an active surface that absorbs radiation. [n some types, the absorbed energy causes emission of electrons and the production of a photocurrent. In others, the radiation promotes electrons into conduction bands: detection here is based on the resulting enhanced conductivity (photo conduction), Photon transducers are used largely for measurement of UV, visible, and near infrared radiation.")
131
the relative spectral response of the various kinds of transducers that are useful for UV, visible, and IR spectroscopy.

132
7E-2 photon transducers

133
photon transducers Several types of photon transducers are available, including (I) photovoltaic cells, in which the radiant energy generates a current at the interface of a semiconductor layer and a metal; (2) phototubes, in which radiation causes emission of electrons from a photosensitive solid surface; (3) photomultiplier tubes, which contain a photoemissive surface as well as several additional surfaces that emit a cascade of electrons when struck by electrons from the photosensitive area; (4) photoconductivity transducers in which absorption of radiation by a semiconductor produces electrons and holes, thus leading to enhanced conductivity; (5) silicon photodiodes. in which photons cause the formation ofelectron-hole pairs and a current across a reversebiased pn junction; and ` (6) charge-transfer transducers, in which the charges developed in a silicon crystal as a result of absorption of photons are collected and measured.
 photovoltaic cells, in which the radiant energy generates a current at the interface of a semiconductor layer and a metal; (2) phototubes, in which radiation causes emission of electrons from a photosensitive solid surface; (3) photomultiplier tubes, which contain a photoemissive surface as well as several additional surfaces that emit a cascade of electrons when struck by electrons from the photosensitive area; (4) photoconductivity transducers in which absorption of radiation by a semiconductor produces electrons and holes, thus leading to enhanced conductivity; (5) silicon photodiodes. in which photons cause the formation ofelectron-hole pairs and a current across a reversebiased pn junction; and ` (6) charge-transfer transducers, in which the charges developed in a silicon crystal as a result of absorption of photons are collected and measured.")
134
a) Photovolatic cell Structure produce voltage when irradiated
metal-semiconductor-metal sandwiches produce voltage when irradiated nm 550 nm maximum response microA Barrier-layer cell Low-price Amplification difficulty Low sensensitivity for weak radiation Fatigue effect

135
b) Vacuum Phototube Structure
Wire anode and semi cylinder cathode in a vacuum tube Photosensitive material electrons produced by irradiation of cathode travel to anode. l response depends on cathode material ( nm) High sensitivity Red response UV response Flat response FIGURE 7-29 A phototube and op amp readout. The photocurrent induced by the radiation causes a voltage drop across R, which appears as "0 at the output of the current-to-voltage converter. This voltage may be displayed on a meter or acquired by a data-acquisition system.
 High sensitivity. Red response. UV response. Flat response. FIGURE 7-29 A phototube and op amp readout. The. photocurrent induced by the radiation causes a voltage. drop across R, which appears as 0 at the output of the. current-to-voltage converter. This voltage may be displayed. on a meter or acquired by a data-acquisition. system.")
136
What do we want in a transducer?
High sensitivity High S/N Constant response over many s (wide range of wavelength) Fast response time S = 0 if no light present S P (where P = radiant power) Photon transducers: light electrical signal Thermal transducers: response to heat conduction bands (enhance conductivity)
 Fast response time. S = 0 if no light present. S P (where P = radiant power) Photon transducers: light electrical signal. Thermal transducers: response to heat conduction bands (enhance conductivity)")
137
c) Photomultiplier Tube (PMT)
Extremely sensitive (use for low light applications). Light strikes photocathode (photons strike emits electrons); several electrons per photon. Bias voltage applied (several hundred volts) electrons form current. Electrons emitted towards a dynode (90 V more positive than photocathode electrons attracted to it). Electrons hit dynode each electron causes emission of several electrons. These electrons are accelerated towards dynode #2 (90 V more positive than dynode # 1) …etc.
. Light strikes photocathode (photons strike emits electrons); several electrons per photon. Bias voltage applied (several hundred volts) electrons form current. Electrons emitted towards a dynode (90 V more positive than photocathode electrons attracted to it). Electrons hit dynode each electron causes emission of several electrons. These electrons are accelerated towards dynode #2 (90 V more positive than dynode # 1) …etc.")
138
d) Photomultiplier tubes (found in more advanced, scanning UV-VIS and spectroscopic instruments)
Also function based on the photoelectric effect Additional signal is gained by multiplying the number of electrons produced by the initial reaction in the detector. Each electron produces as series of photo-electrons, multiplying its signal. Thus the name PMT! Very sensitive to incoming light. Most sensitive light detector in the UV-VIS range. VERY rugged. They last a long time. Sensitive to excessive stray light (room light + powered PMT = DEAD PMT) Always used with a scanning or moveable wavelength selector (grating) in a monochromator
 Always used with a scanning or moveable wavelength selector (grating) in a monochromator.")
139
FIGURE7-31 Photomultiplier tube: (a), photograph of a typical commercial tube; (b), cross: sectional view; (c), electrical diagram illustrating dynode polanzatlon and photocurrent mea surement. Radiation striking the photosensitive cathode (b) gives nse to photoelectrons by the hotoelectric effect. Dynode D1 is held at a positive voltage Withrespect to the photocathode. ~Iectrons emitted by the cathode are attracted to the first dynode and accelerated In the fteld. Each electron striking dynode D1 thus gives rise to two to four secondary electrons. These are attracted to dynode D2, which is again positive with respect to dynode D1. The resulting amplification at the anode can be 106 or greater. The exact amplification factor depends on the number of dynodes and the voltage difference between each. ThiSautomatic Internal amplification is one of the major advantages of photomultiplier tubes. With modern Instrumentation, the arrival of individual photocurrent pulses can be detected and counted Instead of being measured as an average current. This technique, called photon counting, IS advantageous at very low light levels.
 gives nse to photoelectrons by the hotoelectric effect. Dynode D1 is held at a positive voltage Withrespect to the photocathode. ~Iectrons emitted by the cathode are attracted to the first dynode and accelerated In the fteld. Each electron striking dynode D1 thus gives rise to two to four secondary electrons. These are attracted to dynode D2, which is again positive with respect to dynode D1. The resulting amplification at the anode can be 106 or greater. The exact amplification factor depends on the number of dynodes and the voltage difference between each. ThiSautomatic Internal amplification is one of the major advantages of photomultiplier tubes. With modern Instrumentation, the arrival of individual photocurrent pulses can be detected and counted Instead of being measured as an average current. This technique, called photon counting, IS advantageous at very low light levels..")
141
m = dk 8–19 dynodes (9-10 is most common).
Gain (m) is # e- emitted per incident e- (d) to the power of the # of dynodes (k). m = dk e.g. 5 e- emitted / incident e-10 dynodes. m = dk = 510 1 x 10⁷ Typical Gain = Douglas A. Skoog and James J. Leary, Principles of Instrumental Analysis, Saunders College Publishing, Fort Worth, 1992.
 is # e- emitted per incident e- (d) to the power of the # of dynodes (k). m = dk. e.g. 5 e- emitted / incident e-10 dynodes. m = dk = 510 1 x 10⁷. Typical Gain = Douglas A. Skoog and James J. Leary, Principles of Instrumental Analysis, Saunders College Publishing, Fort Worth,")
143
e) Silicon Diodes Constructed of charge depleted and charge rich regions of silicon (silicon doped with other ions) Light striking the detector causes charge to be created between the p and n regions. The charge collected is then measured as current and the array is ‘reset’ for the next collection Used most frequently these days in instruments where the grating is fixed in one position and light strikes an array of silicon diodes (aka the diode array Can have thousands of diodes on an array Each diode collects light from a specific wavelength range The resolution is generally poorer than with a PMT However, you can scan literally thousands of times a minute since there are NO moving parts! Then, the scans are averaged (ensemble or boxcar averaging) to give a resulting spectra.
 to give a resulting spectra.")
144
Photodiodes Douglas A. Skoog and James J. Leary, Principles of Instrumental Analysis, Saunders College Publishing, Fort Worth, 1992.

145
the relative spectral response of the various kinds of transducers that are useful for UV, visible, and IR spectroscopy.

146
Skoog et al. 2007

147
High resistant e- Forward biasing Reverse biasing

148
Multichannel photon transducers

149
Multichannel photon transducers
The first multichannel detector used in spectroscopy was a photographic plate or a film strip that was placed along the length of the focal plane of a spectrometer so that all the lines in a spectrum could be recorded simultaneously. Photographic detection is relatively sensitive, with some emulsions that respond to as few as 10 to 100 photons. The primary limitation of this type of detector, however, is the time required to develop the image of the spectrum and convert the blackening of the emulsion to radiant intensities. Modern multichannel transducers 24 consist of an array of small photosensitive elements arranged either linearly or in a two-dimensional pattern on a single semiconductor chip.

150
Multichannel Photon Transducers
Photographic plate or a film strip Place along the focal plane of a spectrometer

151
Photodiode Arrays

152
Photodiode Arrays In a PDA, the individual photosensitive elements are small silicon photodiodes, each of which consists of a reverse-biased pn junction

153
Photodiode Transducer
A silicon photodiode transducer consists of a Reversed Biased pn junction formed on a silicon chip A photon promotes an electron from the valence bond (filled orbitals) to the conduction bond (unfilled orbitals) creating an electron(-) - hole(+) pair The concentration of these electron-hole pairs is dependent on the amount of light striking the semiconductor
 to the conduction bond (unfilled orbitals) creating an electron(-) - hole(+) pair. The concentration of these electron-hole pairs is dependent on the amount of light striking the semiconductor.")
154
Photodiode Array Semiconductors (Silicon and Germanium)
Group IV elements Formation of holes (via thermal agitation/excitation) Doping n-type: Si (or Ge) doped with group V element (As, Sb) to add electrons. As: [Ar]4S23d104p3 p-type: Doped with group III element (In, Ga) to added holes In: [Kr]5S24d105p1 Skoog et al, p43
 Doping. n-type: Si (or Ge) doped with group V element (As, Sb) to add electrons. As: [Ar]4S23d104p3. p-type: Doped with group III element (In, Ga) to added holes. In: [Kr]5S24d105p1. Skoog et al, p43.")
155
FIGURE 7-33 A reverse-biased linear diode-array detector: (a)cross section and (b)top view.
cross section and (b)top view.")
156
Photodiode Arrays

159
Charge-Transfer Device

160
Charge-Transfer Device (CTD)
Important for multichannel detection (i.e., spatial resolution); 2-dimensional arrays. Sensitivity approaches PMT. An entire spectrum can be recorded as a “snapshot” without scanning. Integrate signal as photon strikes element. Each pixel: two conductive electrodes over an insulating material (e.g., SiO2). Insulator separates electrodes from n-doped silicon.
; 2-dimensional arrays. Sensitivity approaches PMT. An entire spectrum can be recorded as a snapshot without scanning. Integrate signal as photon strikes element. Each pixel: two conductive electrodes over an insulating material (e.g., SiO2). Insulator separates electrodes from n-doped silicon.")
161
Semiconductor capacitor: stores charges that are formed when photons strike the doped silicon.
105 –106 charges/pixel can be stored (gain approaches gain of PMT). How is amount of charge measured? Charge-injection device (CID): voltage change that occurs from charge moving between electrodes. Charge-coupled device (CCD): charge is moved to amplifier.
. How is amount of charge measured Charge-injection device (CID): voltage change that occurs from charge moving between electrodes. Charge-coupled device (CCD): charge is moved to amplifier.")
162
Photo conductivity Transducers

163
Photo conductivity Transducers
The most sensitive transducers for monitoring radiation 10 the near-infrared region (0.75 to 3 /µm) are semiconductors whose resistances decrease when they absorb radiation within this range.
 are semiconductors whose resistances decrease when they absorb radiation within this range.")
164
7E-5 Thermal Transducers

165
Thermal Transducers Thermal Transducers are used in infrared spectroscopy. Phototransducers are not applicable in infrared because photons in this region lack the energy to cause photoemission of electrons. Thermal transducers are – Thermocouples, Bolometer (thermistor).
.")
166
Thermocouples In its simplest form, a thermocouple consists of a pair of junctions formed when two pieces of a metal such as copper are fused to each end of a dissimilar metal such as constantan as shown in Figure A voltage develops between the two junctions that varies with the difference in their temperatures. A well-designed thermocouple transducer is capable of responding to temperature differences of 10-6 K. This difference corresponds to a potential difference of about 6 to 8 µV/µW.

167
Thermocouples

168
bolometer A bolometer is a type of resistance thermometer constructed of strips of metals, such as platinum or nickel, or of a semiconductor. Semiconductor bolometers are often called thermistors .

169
Pyroelectric transducers
Pyroelectric transducers are constructed from single crystalline wafers of pyroelectric materials, which are insulators (dielectric materials) with very special thermal and electrical properties. Triglycine sulfate (NH2CH2COOH)3· H2SO4 (usually deuterated or with a fraction of the glycines replaced with alanine), is the most important pyroelectric material used in the construction of infrared transducers.
 with very special thermal and electrical properties. Triglycine sulfate (NH2CH2COOH)3· H2SO4 (usually deuterated or with a fraction of the glycines replaced with alanine), is the most important pyroelectric material used in the construction of infrared transducers.")
170
SIGNAL PROCESSORS AND READOUTS
7F SIGNAL PROCESSORS AND READOUTS

171
Signal Processors and Readouts
The signal processor is ordinarily an electronic device that amplifies the electrical signal from the transducer. In addition, it may alter the signal from dc to ac (or the reverse), change the phase of the signal, and filter it to remove unwanted components. Furthermore, the signal processor may be called upon to perform such mathematical operations on the signal as differentiation, integration, or conversion to a logarithm.
, change the phase of the signal, and filter it to remove unwanted components. Furthermore, the signal processor may be called upon to perform such mathematical operations on the signal as differentiation, integration, or conversion to a logarithm.")
172
7F-1 Photon counting

173
Photon counting The output from a photomultiplier tube consists of a pulse of electrons for each photon that reaches the detector surface. This analog signal is often filtered to remove undesirable fluctuations due to the random appearance of photons at the photocathode and measured as a de voltage or eurrent.

174
7G Fiber optics

175
Fiber optics In the late 1960, analytical instruments began to appear on the market that contained fiber optics for transmiting radiation and images from one component of the instrument to another. Fiber optics have added a new dimension of utility to optical instrument designs."

176
Optical Fibers Used to transmit light waves over non-linear paths.
Often used in remote sensing, solution sampling (dipping probes) and field instruments Based on the fact that light inside a fiber can be continuously (totally internally reflected) if the angle it strikes the fiber surface at is correct (determines radius of bends, etc.). Used in construction of optodes (optical fiber based chemical sensor)
 and field instruments. Based on the fact that light inside a fiber can be continuously (totally internally reflected) if the angle it strikes the fiber surface at is correct (determines radius of bends, etc.). Used in construction of optodes (optical fiber based chemical sensor)")
177
Properties of Optical Fibers
7G-1 Properties of Optical Fibers

178
Properties of Optical Fibers
Optical fibers are fine strands of glass or plastic that transmit radiation for distances of several hundred feet or more. The diameter of optical fibers ranges from 0.05 pm to as large as 0.6 cm. Where images are to be transmitted, bundles of fibers, fused at the ends, are used. A major application of these fiber bundles has been in medical diagnoses, where their flexibility permits transmission of images of organs through tortuous pathways to the physician. Fiber optics are used not only for observation but also for illumination of objects. In such applications, the ability to illuminate without heating is often very important.

179
Optical Fiber

180
7G.2 Fiber-Optic Sensors

181
Fiber-optic sensors Fiber-optic sensors, which are sometimes called optrodes, consist of a reagent phase immobilized on the end of a fiber optic. Interaction of the analyte with the reagent creates a change in absorbance, reflectance, fluorescence, or luminescence, which is then transmitted to a detector via the optical fiber. Fiber optic Sensors are generally simple, inexpensive devices that are easily miniaturized.

182
types of Optical instrument
7H types of Optical instrument

183
Types of Optical Instruments
Spectroscope Optical instrument used for visual identification of atomic emission lines Colorimeter Human eye acts as detector for absorption measurements Photometer Contains a filter, no scanning function Fluorometer A photometer for fluorescence measurement Spectrograph Record simultaneously the entire spectrum of a dispersed radiation using plate or film Spectrometer Provides information about the intensity of radiaition as a function of wavelength or frequency More……………(confusing……)
")
184
types of Optical instrument
Spectroscope:an optical instrument used for the visual identification of atomic emission lines. We use the term colorimeter: to designate an instrument for absorption measurements in which the human eye serves as the detector using one or more color-comparison standards. spectro graph: is similar in construction to the two monochromators shown in Figure 7-18 except that the sht arrangement is replaced with a large aperture that holds a detector or transducer that is continuously exposed tn the entire spectrum of dispersed radiation. spectrometer :is an instrument that provides information about the intensity of radiation as a function of wavelength or frequency.

185
PRINCIPLES OF FOURIER TRANSFORM OPTICAL MEASUREMENTS

186
Fourier Transform (FT)
The instruments we have been talking about work over the frequency domain (we are measuring signal vs. frequency or wavelength) Fourier transform techniques measure signal vs. time and then convert time to wavelength or frequency FT techniques have much greater resolving power than frequency domain techniques Fewer mechanical parts No “monochromator” Mathematical deconvolution of the spectrum FT techniques have higher light throughput because there are fewer optical components. Widely used in IR and NMR Originally developed to separate out weak IR signals from astronomical objects. An interferometer splits the light beam into two beams and then measures the intensity of recombined beams The frequency of these beams is related to the frequency of the light that caused them….
 Fourier transform techniques measure signal vs. time and then convert time to wavelength or frequency. FT techniques have much greater resolving power than frequency domain techniques. Fewer mechanical parts. No monochromator Mathematical deconvolution of the spectrum. FT techniques have higher light throughput because there are fewer optical components. Widely used in IR and NMR. Originally developed to separate out weak IR signals from astronomical objects. An interferometer splits the light beam into two beams and then measures the intensity of recombined beams. The frequency of these beams is related to the frequency of the light that caused them….")
187
History Fourier transform In 1950s, astronomy
Separate weak signals from noise Late 1960s, FT-NIR & FT-IR Fourier transform

188
Resolution of FT spectrometer
Two closely spaced lines only separated if one complete "beat" is recorded. As lines get closer together, d must increase.

189
Inherent Advantages of Fourier Transform Spectrometry

190
Advantages of FT Throughput / Jaquinot advantage High Resolution
Few optics and slits Less dispersion, high intensity Usually to improve resolution decrease slit width but less light makes spectrum "noisier" (S/N) High Resolution Dl/l = 6 ppm Short time scale Simultaneously measure all spectrum at once saves time frequency scanning vs. time domain scanning Fellgett or multiplex advantage
 High Resolution. Dl/l = 6 ppm. Short time scale. Simultaneously measure all spectrum at once saves time. frequency scanning vs. time domain scanning. Fellgett or multiplex advantage.")
191
time -domain spectroscopy

192
time -domain spectroscopy
Conventional spectroscopy can be termed frequency domain spectroscopy in that radiant power data are recorded as a function of frequency or the inversely related wavelength. In contrast, time-domain spectroscopy, which can be achieved by the Fourier transform, is concerned with changes in radiant power with time.

193
Time domain spectroscopy
Unfortunately, no detector can respond on s time scale Use Michelson interferometer to measure signal proportional to time varying signal

194
Freq-domain / time-domain

195
Acquiring Time-Domain Spectra with a Michelson Interferometer

196
modulation Velocity of moving mirror(MM) Time to move l/2 cm
Bolometer, pyroelectric, photoconducting IR detectors can "see“ changes on 10-4 s time scale!

197
This time domain spectrum is made of different wavelengths of light arriving at the detector at different times.

198
Michelson interferometer

199
Analysis of interferogram
Computer needed to turn complex interferogram into spectrum Figure 7-43 (b) resolved lines (c) unresolved lines FT Time -> Frequency inverse FT Frequency -> Time
 resolved lines. (c) unresolved lines. FT. Time -> Frequency. inverse FT. Frequency -> Time.")
201
Fourier Transformation of Interferograms

202
Interferogram retardation d interferogram
Difference in pathlength interferogram Plot signal vs. d cosine wave with frequency proportional to light frequency but signal varies at much lower frequency One full cycle when mirror moves distance l/2 (round-trip = l)
")
204
resolution

205
resolution The resolution of a Fourier transform spectrometer can be described in terms of the difference in wavenumber between two lines that can be just separated by the instrument. That is,

207
Semiconductor Diodes Diode: is a nonlinear device that has greater conductance in one direction than in another Adjacent n-type and p-type regions pn junction: the interface between the two regions

208
This process continues for 9 dynodes
Result: for each photon that strikes photocathode ~106 –107 electrons collected at anode. Is there a drawback? Sensitivity usually limited by dark current. Dark current = current generated by thermal emission of electrons in the absence of light. Thermal emission reduce by cooling. Under optimal conditions, PMTs can detect single photons. Only used for low-light applications; it is possible to fry the photocathode.

Similar presentations


 a stable source of radiant energy, (2) a transparent.>")
 is based upon emission of electromagnetic radiation by atoms.>")


.>")

