Download presentation
Presentation is loading. Please wait.

1
® SELECTED FINDINGS

2
Compared to last year, increases are seen for monthly discretionary spending, annual personal earnings and the amount of money students receive from home Monthly discretionary spending: $225 (+15%) Monthly discretionary spending: $225 (+15%) Annual personal earnings: $4,809 (+15%) Annual personal earnings: $4,809 (+15%) 54% get money from home averaging $315 monthly (+19%) 54% get money from home averaging $315 monthly (+19%) 9% are employed full-time and 46% are employed part-time and 6% have an internship during the school year 9% are employed full-time and 46% are employed part-time and 6% have an internship during the school year Average age: 20.7 Average age: 20.7 Family HH income: $88,671 Family HH income: $88,671 Spring 2012 © STUDENT MONITOR LLC – All Rights Reserved, Unauthorized Use Prohibited
 Monthly discretionary spending: $225 (+15%) Annual personal earnings: $4,809 (+15%) Annual personal earnings: $4,809 (+15%) 54% get money from home averaging $315 monthly (+19%) 54% get money from home averaging $315 monthly (+19%) 9% are employed full-time and 46% are employed part-time and 6% have an internship during the school year 9% are employed full-time and 46% are employed part-time and 6% have an internship during the school year Average age: 20.7 Average age: 20.7 Family HH income: $88,671 Family HH income: $88,671 Spring 2012 © STUDENT MONITOR LLC – All Rights Reserved, Unauthorized Use Prohibited")
3
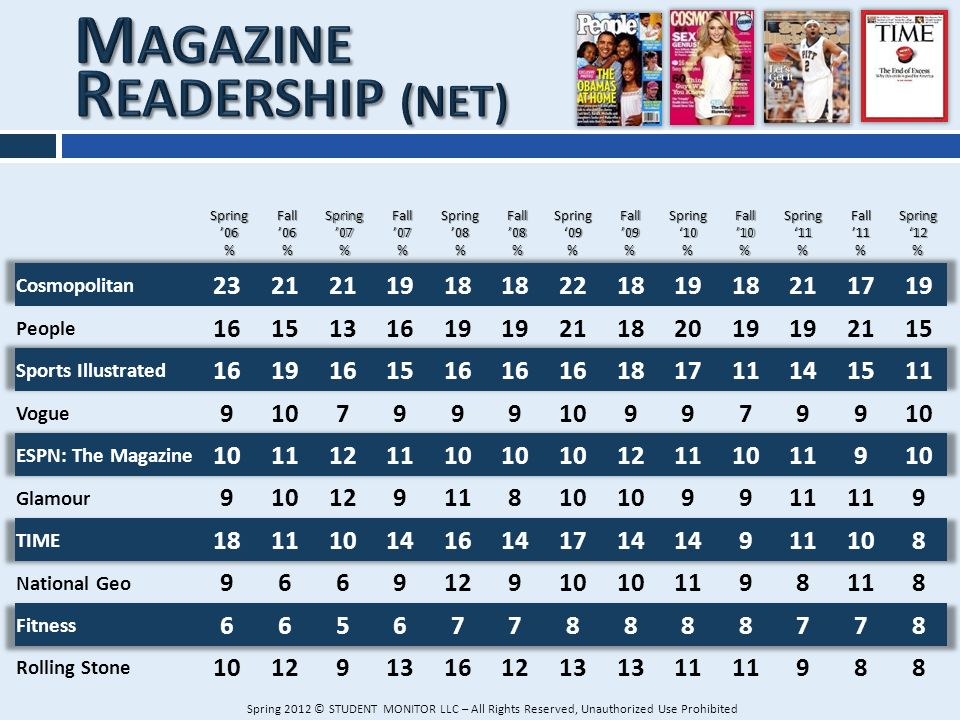
Media Habits: Less than half the time spent watching television is spent watching with a TV set (40%, down from 45% last year) and 56% are at least “Somewhat interested” in watching television exclusively online Less than half the time spent watching television is spent watching with a TV set (40%, down from 45% last year) and 56% are at least “Somewhat interested” in watching television exclusively online Comedy Central, ABC, ESPN, FOX and MTV are students’ favorite networks (Family Guy, How I Met Your Mother, Jersey Shore, The Big Bang Theory, Walking Dead and ESPN SportsCenter are the most watched programs) Comedy Central, ABC, ESPN, FOX and MTV are students’ favorite networks (Family Guy, How I Met Your Mother, Jersey Shore, The Big Bang Theory, Walking Dead and ESPN SportsCenter are the most watched programs) Cosmo, People, SI Vogue and ESPN The Magazine are students “best read” titles Cosmo, People, SI Vogue and ESPN The Magazine are students “best read” titles 41% (43% last year) read the print edition of a national newspaper while online readership is 36% (41% last year) 41% (43% last year) read the print edition of a national newspaper while online readership is 36% (41% last year) 54%, (compared to 61% last year) read at least 1 of the last 5 issues of their campus newspaper. 30% of those students with an online edition of their campus newspaper have read the online edition in the past month. 54%, (compared to 61% last year) read at least 1 of the last 5 issues of their campus newspaper. 30% of those students with an online edition of their campus newspaper have read the online edition in the past month. Spring 2012 © STUDENT MONITOR LLC – All Rights Reserved, Unauthorized Use Prohibited
 read at least 1 of the last 5 issues of their campus newspaper. 30% of those students with an online edition of their campus newspaper have read the online edition in the past month. Spring 2012 © STUDENT MONITOR LLC – All Rights Reserved, Unauthorized Use Prohibited.")
4
The Impact of Technology: 95% own a mobile phone. 64% (up from 54%) of owners own a Smartphone 95% own a mobile phone. 64% (up from 54%) of owners own a Smartphone 27%, up from 16% last year own an iPhone). 28% plan to purchase a new mobile and 43% of these plan to purchase an iPhone 27%, up from 16% last year own an iPhone). 28% plan to purchase a new mobile and 43% of these plan to purchase an iPhone 96% own a computer (88% a laptop, 19% a desktop, 10% a tablet and 4% a netbook) 96% own a computer (88% a laptop, 19% a desktop, 10% a tablet and 4% a netbook) Among computer owners 85% use a laptop most often Among computer owners 85% use a laptop most often More students use an Apple computer than any other brand More students use an Apple computer than any other brand 11% (including 15% of Juniors) plan to buy a new computer in the next 12 months 11% (including 15% of Juniors) plan to buy a new computer in the next 12 months 53% of the computers students plan to buy (desktops, laptops and tablets) are Apple 53% of the computers students plan to buy (desktops, laptops and tablets) are Apple Spring 2012 © STUDENT MONITOR LLC – All Rights Reserved, Unauthorized Use Prohibited
 of owners own a Smartphone 95% own a mobile phone. 64% (up from 54%) of owners own a Smartphone 27%, up from 16% last year own an iPhone). 28% plan to purchase a new mobile and 43% of these plan to purchase an iPhone 27%, up from 16% last year own an iPhone). 28% plan to purchase a new mobile and 43% of these plan to purchase an iPhone 96% own a computer (88% a laptop, 19% a desktop, 10% a tablet and 4% a netbook) 96% own a computer (88% a laptop, 19% a desktop, 10% a tablet and 4% a netbook) Among computer owners 85% use a laptop most often Among computer owners 85% use a laptop most often More students use an Apple computer than any other brand More students use an Apple computer than any other brand 11% (including 15% of Juniors) plan to buy a new computer in the next 12 months 11% (including 15% of Juniors) plan to buy a new computer in the next 12 months 53% of the computers students plan to buy (desktops, laptops and tablets) are Apple 53% of the computers students plan to buy (desktops, laptops and tablets) are Apple Spring 2012 © STUDENT MONITOR LLC – All Rights Reserved, Unauthorized Use Prohibited.")
5
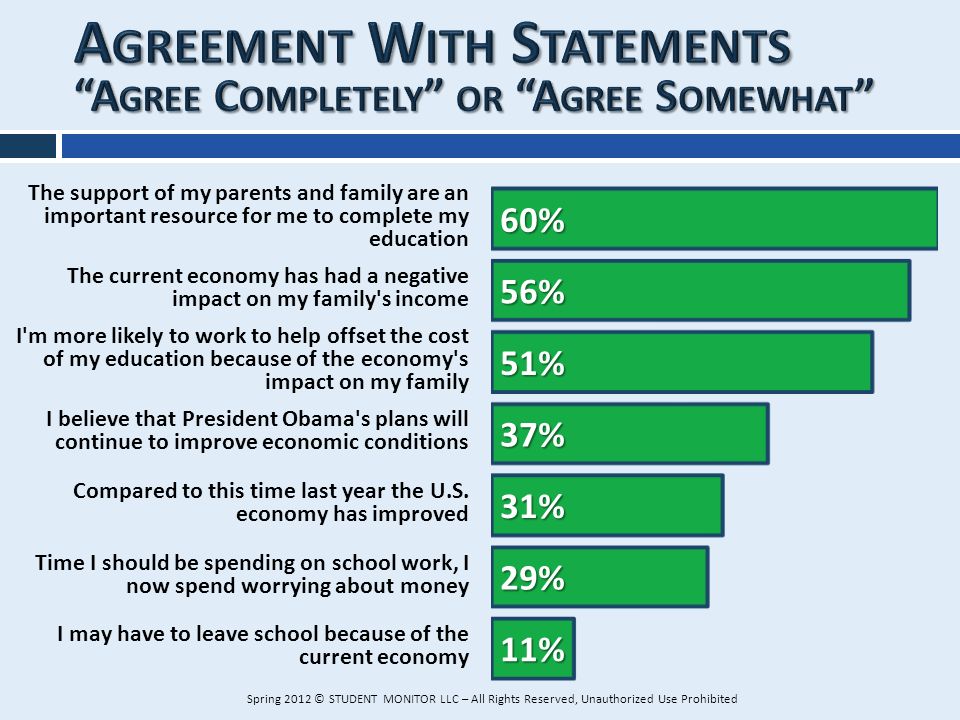
Attitudes & Behavior: 44% of textbook spending is “New”, 40% “Used”, 11% “Rented” and 4% “eTextbooks” During Summer Break, 35% went on a trip (53% went or stayed home, 35% worked) Apple iPhones, Facebook, Apple iPads, Texting and Drinking beer top the list of “What’s In On Campus” 56% (57% last year) report “the economy has had a negative impact on my family” “U.S. economy” (32%), “Cost of education” (30%) and “Health care (28%) are the “Top 3 Issues Facing The U.S.” Among the 87% who plan to vote in the Presidential election, nearly 6 times as many report a preference for President Obama than Gov. Romney Spring 2012 © STUDENT MONITOR LLC – All Rights Reserved, Unauthorized Use Prohibited
, Cost of education (30%) and Health care (28%) are the Top 3 Issues Facing The U.S. Among the 87% who plan to vote in the Presidential election, nearly 6 times as many report a preference for President Obama than Gov. Romney Spring 2012 © STUDENT MONITOR LLC – All Rights Reserved, Unauthorized Use Prohibited.")
6
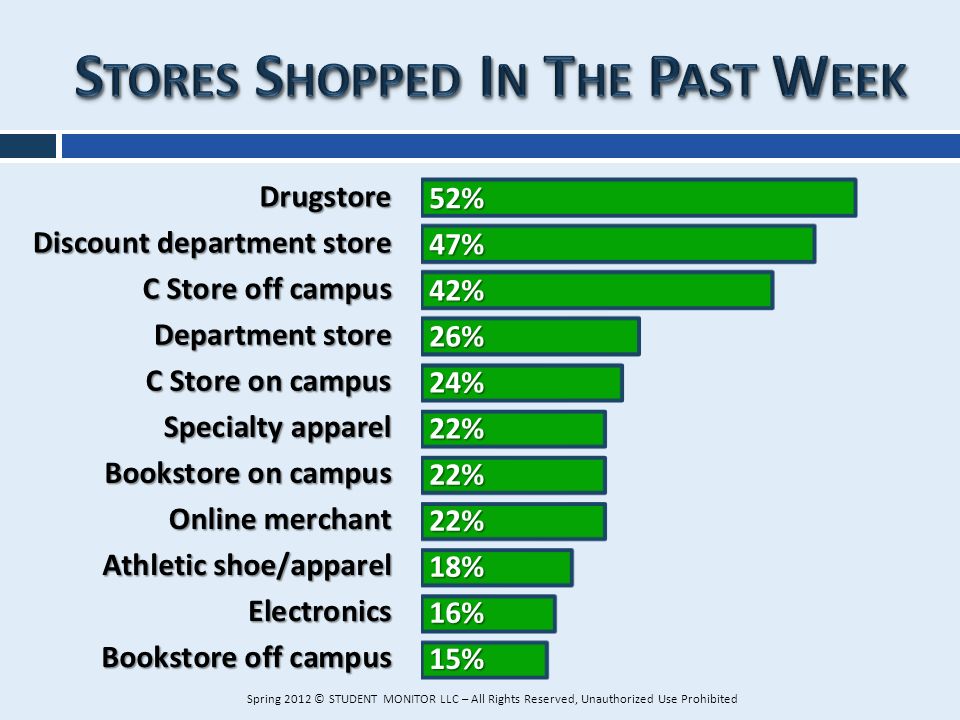
Students As Consumers: 82% report “Once I find a brand I like, I don’t try new ones” and more than four in ten (42%) report “I like to buy the newest/latest version of a product Fewer than a third of students (31%) agree with the statement “If I were purchasing a new vehicle, I would purchase a Chrysler, Ford or GM vehicle” In a typical month at school 34% make a purchase at an off campus bookstore, 44% at an on campus bookstore, 70% at an off campus convenience store, 54% in a department store, 81% at a fast food restaurant and 71% at a gas station 27% have a credit card in their own name (18% VISA, 8% MasterCard, 3% Discover and 2% American Express). When asked what they expect to be doing immediately following graduation, 50% expect to be employed full-time following graduation (only 2% expect to be unemployed) Spring 2012 © STUDENT MONITOR LLC – All Rights Reserved, Unauthorized Use Prohibited
 Spring 2012 © STUDENT MONITOR LLC – All Rights Reserved, Unauthorized Use Prohibited.")
7
FOX has surpassed CBS and now dominates the programs student watch most often FOX has surpassed CBS and now dominates the programs student watch most often By a somewhat smaller margin, “Family Guy” remains the program students watch most often By a somewhat smaller margin, “Family Guy” remains the program students watch most often Spring 2012 © STUDENT MONITOR LLC – All Rights Reserved, Unauthorized Use Prohibited

8
Less than half (40%) of the time spent watching television is spent watching with a traditional TV set Less than half (40%) of the time spent watching television is spent watching with a traditional TV set Spring 2012 © STUDENT MONITOR LLC – All Rights Reserved, Unauthorized Use Prohibited
 of the time spent watching television is spent watching with a traditional TV set Less than half (40%) of the time spent watching television is spent watching with a traditional TV set Spring 2012 © STUDENT MONITOR LLC – All Rights Reserved, Unauthorized Use Prohibited")
9
58% of the time students spend watching TV is spent offline (66% among users) 58% of the time students spend watching TV is spent offline (66% among users) More than half (56%) are at least “Somewhat interested” in watching TV exclusively online More than half (56%) are at least “Somewhat interested” in watching TV exclusively online Spring 2012 © STUDENT MONITOR LLC – All Rights Reserved, Unauthorized Use Prohibited
 58% of the time students spend watching TV is spent offline (66% among users) More than half (56%) are at least Somewhat interested in watching TV exclusively online More than half (56%) are at least Somewhat interested in watching TV exclusively online Spring 2012 © STUDENT MONITOR LLC – All Rights Reserved, Unauthorized Use Prohibited")
10
Comedy Central, ABC, ESPN, FOX and MTV continue to be students’ favorite television networks Comedy Central, ABC, ESPN, FOX and MTV continue to be students’ favorite television networks For some television networks, significant gender differences are seen For some television networks, significant gender differences are seen Spring 2012 © STUDENT MONITOR LLC – All Rights Reserved, Unauthorized Use Prohibited

11
Student readership of the online edition of a national newspaper is somewhat less than that of the print edition Student readership of the online edition of a national newspaper is somewhat less than that of the print edition Spring 2012 © STUDENT MONITOR LLC – All Rights Reserved, Unauthorized Use Prohibited

12
While somewhat more report reading the print edition, somewhat more report a preference for the online edition While somewhat more report reading the print edition, somewhat more report a preference for the online edition One in ten prefer to read the online edition with a mobile device One in ten prefer to read the online edition with a mobile device Spring 2012 © STUDENT MONITOR LLC – All Rights Reserved, Unauthorized Use Prohibited

13
54% (compared to 61% last year and 64% two years ago) read at least 1 of the last 5 issues of the print edition 54% (compared to 61% last year and 64% two years ago) read at least 1 of the last 5 issues of the print edition Readership is highest among Juniors at 60% and somewhat higher among females (55%) than males (52%) Readership is highest among Juniors at 60% and somewhat higher among females (55%) than males (52%) Readers spend an average 18 minutes reading a typical issue Readers spend an average 18 minutes reading a typical issue Most readers (57%) read their campus newspaper for “Local campus news” Most readers (57%) read their campus newspaper for “Local campus news” Half prefer the print to online edition and among those with an online edition, 30% read the online edition in the past month Half prefer the print to online edition and among those with an online edition, 30% read the online edition in the past month Spring 2012 © STUDENT MONITOR LLC – All Rights Reserved, Unauthorized Use Prohibited
 read at least 1 of the last 5 issues of the print edition 54% (compared to 61% last year and 64% two years ago) read at least 1 of the last 5 issues of the print edition Readership is highest among Juniors at 60% and somewhat higher among females (55%) than males (52%) Readership is highest among Juniors at 60% and somewhat higher among females (55%) than males (52%) Readers spend an average 18 minutes reading a typical issue Readers spend an average 18 minutes reading a typical issue Most readers (57%) read their campus newspaper for Local campus news Most readers (57%) read their campus newspaper for Local campus news Half prefer the print to online edition and among those with an online edition, 30% read the online edition in the past month Half prefer the print to online edition and among those with an online edition, 30% read the online edition in the past month Spring 2012 © STUDENT MONITOR LLC – All Rights Reserved, Unauthorized Use Prohibited")
15
96% of students own a computer 96% of students own a computer 88% own a laptop 88% own a laptop 19% own a desktop 19% own a desktop 10% own a tablet 10% own a tablet 4% own a netbook 4% own a netbook Spring 2012 © STUDENT MONITOR LLC – All Rights Reserved, Unauthorized Use Prohibited

16
Three in ten (30%) use an Apple computer most often Three in ten (30%) use an Apple computer most often About one in five (19%) use a Dell most often and about one in six (16%) use an HP most often About one in five (19%) use a Dell most often and about one in six (16%) use an HP most often Spring 2012 © STUDENT MONITOR LLC – All Rights Reserved, Unauthorized Use Prohibited
 use an Apple computer most often Three in ten (30%) use an Apple computer most often About one in five (19%) use a Dell most often and about one in six (16%) use an HP most often About one in five (19%) use a Dell most often and about one in six (16%) use an HP most often Spring 2012 © STUDENT MONITOR LLC – All Rights Reserved, Unauthorized Use Prohibited")
17
The economy appears to continue to have little impact on student plans to purchase a new computer The economy appears to continue to have little impact on student plans to purchase a new computer Virtually as many plan to purchase a tablet as plan to purchase a desktop Virtually as many plan to purchase a tablet as plan to purchase a desktop Interest in netbooks continues to decline Interest in netbooks continues to decline 11% (13% last year) plan to purchase a new computer in the next 12 months (19% “Don’t know”) 77% of purchase intenders plan to purchase a laptop 13% of purchase intenders plan to purchase a tablet 14% of purchase intenders plan to purchase a desktop 3% of purchase intenders plan to purchase a netbook Spring 2012 © STUDENT MONITOR LLC – All Rights Reserved, Unauthorized Use Prohibited
 plan to purchase a new computer in the next 12 months (19% Don’t know ) 77% of purchase intenders plan to purchase a laptop 13% of purchase intenders plan to purchase a tablet 14% of purchase intenders plan to purchase a desktop 3% of purchase intenders plan to purchase a netbook Spring 2012 © STUDENT MONITOR LLC – All Rights Reserved, Unauthorized Use Prohibited")
18
At least one in seven report participating in one or more of the following; Academic group/club Academic group/club Gave blood Gave blood Volunteer group Volunteer group Intramural sports Intramural sports Fraternity/sorority Fraternity/sorority Spring 2012 © STUDENT MONITOR LLC – All Rights Reserved, Unauthorized Use Prohibited

19
The five most commonly reported past week’s activities include; 1.Sent text 2.Logged onto a social network 3.Ate fast food off campus 4.Drank bottled water 5.Used a mobile phone to take/send a photo Spring 2012 © STUDENT MONITOR LLC – All Rights Reserved, Unauthorized Use Prohibited

20
62% read 1 or more books not required for class in a typical month including 66% of females. Among this 62%, students read an average of 2 books monthly 33% of students buy 1 or more books not required for class including 38% of females. Among this 33%, students buy an average of 1.9 books monthly (represents 5 million books monthly) 45% of these 5 million books are purchased at an off campus bookstore (Barnes & Noble, etc.) and 42% are purchased online (Amazon, Apple, etc.) Spring 2012 © STUDENT MONITOR LLC – All Rights Reserved, Unauthorized Use Prohibited
 45% of these 5 million books are purchased at an off campus bookstore (Barnes & Noble, etc.) and 42% are purchased online (Amazon, Apple, etc.) Spring 2012 © STUDENT MONITOR LLC – All Rights Reserved, Unauthorized Use Prohibited.")
21
51% more students “went/stayed home” for Spring Break as “went on a trip” (53% compared to 35%) 51% more students “went/stayed home” for Spring Break as “went on a trip” (53% compared to 35%) 18% “worked” at a job at home” during Spring Break 18% “worked” at a job at home” during Spring Break Spring 2012 © STUDENT MONITOR LLC – All Rights Reserved, Unauthorized Use Prohibited
 51% more students went/stayed home for Spring Break as went on a trip (53% compared to 35%) 18% worked at a job at home during Spring Break 18% worked at a job at home during Spring Break Spring 2012 © STUDENT MONITOR LLC – All Rights Reserved, Unauthorized Use Prohibited")
22
Technology related activities and drinking continue to top the list of “What’s IN” Technology related activities and drinking continue to top the list of “What’s IN” Spring 2012 © STUDENT MONITOR LLC – All Rights Reserved, Unauthorized Use Prohibited

23
Students place virtually equal importance on a “Happy marriage” as a “Satisfying career” as the highest rated indicator of success Spring 2012 © STUDENT MONITOR LLC – All Rights Reserved, Unauthorized Use Prohibited

24
One in four believe they will need more than four years to complete their undergraduate degree (somewhat less among students attending Private schools) Spring 2012 © STUDENT MONITOR LLC – All Rights Reserved, Unauthorized Use Prohibited
 Spring 2012 © STUDENT MONITOR LLC – All Rights Reserved, Unauthorized Use Prohibited")
29
The Top 3 issues facing the U.S. are; 1.U.S. economy 2.Cost of education 3.Health care Spring 2012 © STUDENT MONITOR LLC – All Rights Reserved, Unauthorized Use Prohibited

30
The largest share of students (45%) at least “Somewhat agree” with this statement The largest share of students (45%) at least “Somewhat agree” with this statement The next largest group (41%) are ambivalent The next largest group (41%) are ambivalent Spring 2012 © STUDENT MONITOR LLC – All Rights Reserved, Unauthorized Use Prohibited
 at least Somewhat agree with this statement The largest share of students (45%) at least Somewhat agree with this statement The next largest group (41%) are ambivalent The next largest group (41%) are ambivalent Spring 2012 © STUDENT MONITOR LLC – All Rights Reserved, Unauthorized Use Prohibited")
31
Nearly four times as many (47%) approve of President Obama’s performance as approve of Congress’ performance (13%) 47%, up from Fall 2011’s 38%, approve of President Obama’s performance 47%, up from Fall 2011’s 38%, approve of President Obama’s performance 13%, similar to Fall 2011’s 14%, down approve of Congress’ performance 13%, similar to Fall 2011’s 14%, down approve of Congress’ performance Most (42%) are “Democrats” and most (31%) describe themselves as “Middle of the road” Most (42%) are “Democrats” and most (31%) describe themselves as “Middle of the road” Spring 2012 © STUDENT MONITOR LLC – All Rights Reserved, Unauthorized Use Prohibited
 approve of President Obama’s performance as approve of Congress’ performance (13%) 47%, up from Fall 2011’s 38%, approve of President Obama’s performance 47%, up from Fall 2011’s 38%, approve of President Obama’s performance 13%, similar to Fall 2011’s 14%, down approve of Congress’ performance 13%, similar to Fall 2011’s 14%, down approve of Congress’ performance Most (42%) are Democrats and most (31%) describe themselves as Middle of the road Most (42%) are Democrats and most (31%) describe themselves as Middle of the road Spring 2012 © STUDENT MONITOR LLC – All Rights Reserved, Unauthorized Use Prohibited")
33
About one in three (32%) purchased most of their textbooks off the shelf from their on campus bookstore Another one in five (20%) purchased most of their textbooks online from an online seller other than their on campus bookstore 42% (down from 56% last year) purchased or rented most of their textbooks from their on campus bookstore Spring 2012 © STUDENT MONITOR LLC – All Rights Reserved, Unauthorized Use Prohibited
 purchased most of their textbooks off the shelf from their on campus bookstore Another one in five (20%) purchased most of their textbooks online from an online seller other than their on campus bookstore 42% (down from 56% last year) purchased or rented most of their textbooks from their on campus bookstore Spring 2012 © STUDENT MONITOR LLC – All Rights Reserved, Unauthorized Use Prohibited")
34
Similar to last year, among students who purchased or rented textbooks, 60% were purchased offline and 40% were purchased online Similar to last year, among students who purchased or rented textbooks, 60% were purchased offline and 40% were purchased online Spring 2012 © STUDENT MONITOR LLC – All Rights Reserved, Unauthorized Use Prohibited

35
Students purchased or rented an average of 5.5 textbooks (+15% compared to 4.8 last year) Students purchased or rented an average of 5.5 textbooks (+15% compared to 4.8 last year) 45% of those textbooks were purchased used, 31% purchased new, 19% were rented and the remaining 5% were purchased eTextbooks 45% of those textbooks were purchased used, 31% purchased new, 19% were rented and the remaining 5% were purchased eTextbooks Spring 2012 © STUDENT MONITOR LLC – All Rights Reserved, Unauthorized Use Prohibited
 Students purchased or rented an average of 5.5 textbooks (+15% compared to 4.8 last year) 45% of those textbooks were purchased used, 31% purchased new, 19% were rented and the remaining 5% were purchased eTextbooks 45% of those textbooks were purchased used, 31% purchased new, 19% were rented and the remaining 5% were purchased eTextbooks Spring 2012 © STUDENT MONITOR LLC – All Rights Reserved, Unauthorized Use Prohibited")
36
Students are most likely to report purchasing or renting a combination of textbook formats (purchase or rent, new or used, print or eTextbook) Students are most likely to report purchasing or renting a combination of textbook formats (purchase or rent, new or used, print or eTextbook) Small numbers of students report purchasing or renting a single format exclusively Small numbers of students report purchasing or renting a single format exclusively Students are most likely to report purchasing or renting a combination of textbook formats (purchase or rent, new or used, print or eTextbook) Students are most likely to report purchasing or renting a combination of textbook formats (purchase or rent, new or used, print or eTextbook) Small numbers of students report purchasing or renting a single format exclusively Small numbers of students report purchasing or renting a single format exclusively Spring 2012 © STUDENT MONITOR LLC – All Rights Reserved, Unauthorized Use Prohibited
 Students are most likely to report purchasing or renting a combination of textbook formats (purchase or rent, new or used, print or eTextbook) Small numbers of students report purchasing or renting a single format exclusively Small numbers of students report purchasing or renting a single format exclusively Students are most likely to report purchasing or renting a combination of textbook formats (purchase or rent, new or used, print or eTextbook) Students are most likely to report purchasing or renting a combination of textbook formats (purchase or rent, new or used, print or eTextbook) Small numbers of students report purchasing or renting a single format exclusively Small numbers of students report purchasing or renting a single format exclusively Spring 2012 © STUDENT MONITOR LLC – All Rights Reserved, Unauthorized Use Prohibited")
37
Spending for purchased, printed textbooks continued to decline due to; Decline in the number of units purchased Decline in the number of units purchased Purchases from less expensive channels Purchases from less expensive channels Impact of rentals (print) and to a lesser extent the impact of purchased an rented eTextbooks Impact of rentals (print) and to a lesser extent the impact of purchased an rented eTextbooks Spring 2012 © STUDENT MONITOR LLC – All Rights Reserved, Unauthorized Use Prohibited
 and to a lesser extent the impact of purchased an rented eTextbooks Impact of rentals (print) and to a lesser extent the impact of purchased an rented eTextbooks Spring 2012 © STUDENT MONITOR LLC – All Rights Reserved, Unauthorized Use Prohibited")
38
Students spent an average of $250 for textbooks Students spent an average of $250 for textbooks 44% of spending was for new textbooks, 40% used, 3% for purchased eTextbooks and the remaining 12% to rent print or eTextbooks 44% of spending was for new textbooks, 40% used, 3% for purchased eTextbooks and the remaining 12% to rent print or eTextbooks Spring 2012 © STUDENT MONITOR LLC – All Rights Reserved, Unauthorized Use Prohibited

39
Among the 27% of textbook renters... The largest share (70%) rented a textbook for their major The largest share (70%) rented a textbook for their major 84% report the rental process as “Very” or “Somewhat easy” 84% report the rental process as “Very” or “Somewhat easy” “I like to save money” (76%) is the most commonly mentioned reason for renting “I like to save money” (76%) is the most commonly mentioned reason for renting Spring 2012 © STUDENT MONITOR LLC – All Rights Reserved, Unauthorized Use Prohibited
 rented a textbook for their major The largest share (70%) rented a textbook for their major 84% report the rental process as Very or Somewhat easy 84% report the rental process as Very or Somewhat easy I like to save money (76%) is the most commonly mentioned reason for renting I like to save money (76%) is the most commonly mentioned reason for renting Spring 2012 © STUDENT MONITOR LLC – All Rights Reserved, Unauthorized Use Prohibited.")
40
Among the 27% of textbook renters, the most commonly reported sources students rented textbooks from are: 1.On campus bookstore (46%) 2.Chegg.com (24%) 3.Off campus bookstore (10%) Spring 2012 © STUDENT MONITOR LLC – All Rights Reserved, Unauthorized Use Prohibited
 2.Chegg.com (24%) 3.Off campus bookstore (10%) Spring 2012 © STUDENT MONITOR LLC – All Rights Reserved, Unauthorized Use Prohibited")
41
Students most commonly identify their “On campus bookstore” (27%) or “Chegg.com” (21%) as the source of renting textbooks that comes to mind first Students most commonly identify their “On campus bookstore” (27%) or “Chegg.com” (21%) as the source of renting textbooks that comes to mind first About three in ten are unable to identify any source About three in ten are unable to identify any source Spring 2012 © STUDENT MONITOR LLC – All Rights Reserved, Unauthorized Use Prohibited
 or Chegg.com (21%) as the source of renting textbooks that comes to mind first Students most commonly identify their On campus bookstore (27%) or Chegg.com (21%) as the source of renting textbooks that comes to mind first About three in ten are unable to identify any source About three in ten are unable to identify any source Spring 2012 © STUDENT MONITOR LLC – All Rights Reserved, Unauthorized Use Prohibited")
42
Among those who plan to be in school next semester, more than four in ten (42%) are at least “Somewhat likely” to rent 1 or more textbooks next semester Among those who plan to be in school next semester, more than four in ten (42%) are at least “Somewhat likely” to rent 1 or more textbooks next semester Spring 2012 © STUDENT MONITOR LLC – All Rights Reserved, Unauthorized Use Prohibited
 are at least Somewhat likely to rent 1 or more textbooks next semester Among those who plan to be in school next semester, more than four in ten (42%) are at least Somewhat likely to rent 1 or more textbooks next semester Spring 2012 © STUDENT MONITOR LLC – All Rights Reserved, Unauthorized Use Prohibited")
43
About six in ten have some level of familiarity with eTextbooks (58%) but nearly one in five (17%) report they have “Never heard of eTextbooks” About six in ten have some level of familiarity with eTextbooks (58%) but nearly one in five (17%) report they have “Never heard of eTextbooks” As would be expected, Freshmen (24%) are most likely to report they have “Never heard of eTextbooks” As would be expected, Freshmen (24%) are most likely to report they have “Never heard of eTextbooks” Spring 2012 © STUDENT MONITOR LLC – All Rights Reserved, Unauthorized Use Prohibited
 but nearly one in five (17%) report they have Never heard of eTextbooks About six in ten have some level of familiarity with eTextbooks (58%) but nearly one in five (17%) report they have Never heard of eTextbooks As would be expected, Freshmen (24%) are most likely to report they have Never heard of eTextbooks As would be expected, Freshmen (24%) are most likely to report they have Never heard of eTextbooks Spring 2012 © STUDENT MONITOR LLC – All Rights Reserved, Unauthorized Use Prohibited")
44
Awareness of eTextbooks continues to trend up at a rate greater than the number of purchasers and preference for “traditional, printed” textbooks continues to be the most common reason why students have not adopted eTextbooks About one in five (21% compared to 19% last year) have ever purchased or rented an eTextbook “My professor required me” (32%) and “Less expensive than a traditional printed textbook” (27%) are the most common reason for purchasing an eTextbook. Another 25% mention “instant access” 19% (13% last year) are at least “Somewhat likely” to purchase an eTextbook next semester Among those who have not purchased, the largest group 39% “Prefer traditional printed textbooks” and another 34%, up somewhat from 29% mention “I don’t like reading on a screen for a long period of time” Spring 2012 © STUDENT MONITOR LLC – All Rights Reserved, Unauthorized Use Prohibited
 are at least Somewhat likely to purchase an eTextbook next semester Among those who have not purchased, the largest group 39% Prefer traditional printed textbooks and another 34%, up somewhat from 29% mention I don’t like reading on a screen for a long period of time Spring 2012 © STUDENT MONITOR LLC – All Rights Reserved, Unauthorized Use Prohibited.")
45
27% (up from 20% last Fall) own a tablet computer 27% (up from 20% last Fall) own a tablet computer Among this group, 44% own an iPad while about one in three (33%) own a Kindle (skewing somewhat higher among females) Among this group, 44% own an iPad while about one in three (33%) own a Kindle (skewing somewhat higher among females) Spring 2012 © STUDENT MONITOR LLC – All Rights Reserved, Unauthorized Use Prohibited
 own a tablet computer 27% (up from 20% last Fall) own a tablet computer Among this group, 44% own an iPad while about one in three (33%) own a Kindle (skewing somewhat higher among females) Among this group, 44% own an iPad while about one in three (33%) own a Kindle (skewing somewhat higher among females) Spring 2012 © STUDENT MONITOR LLC – All Rights Reserved, Unauthorized Use Prohibited")
46
95% of students own a mobile phone 95% of students own a mobile phone 64% (up from 56% last year) own a Smartphone 64% (up from 56% last year) own a Smartphone 67% of mobile owners (up from 60% last year) report ownership of a SmartPhone 67% of mobile owners (up from 60% last year) report ownership of a SmartPhone Spring 2012 © STUDENT MONITOR LLC – All Rights Reserved, Unauthorized Use Prohibited
 own a Smartphone 64% (up from 56% last year) own a Smartphone 67% of mobile owners (up from 60% last year) report ownership of a SmartPhone 67% of mobile owners (up from 60% last year) report ownership of a SmartPhone Spring 2012 © STUDENT MONITOR LLC – All Rights Reserved, Unauthorized Use Prohibited")
47
Monthly spending averages $96 (up from $79 last year) and most students (52%) report their parents pay their bill Monthly spending averages $96 (up from $79 last year) and most students (52%) report their parents pay their bill 69% report their phone is part of a “Family plan” 69% report their phone is part of a “Family plan” Spring 2012 © STUDENT MONITOR LLC – All Rights Reserved, Unauthorized Use Prohibited
 and most students (52%) report their parents pay their bill Monthly spending averages $96 (up from $79 last year) and most students (52%) report their parents pay their bill 69% report their phone is part of a Family plan 69% report their phone is part of a Family plan Spring 2012 © STUDENT MONITOR LLC – All Rights Reserved, Unauthorized Use Prohibited")
48
iPhone (27%, up sharply from 16% last year) is the leading mobile phone owned by students iPhone (27%, up sharply from 16% last year) is the leading mobile phone owned by students Samsung’s share remains unchanged while Blackberry’s share has declined sharply from 15% last year to 8% this year Samsung’s share remains unchanged while Blackberry’s share has declined sharply from 15% last year to 8% this year Spring 2012 © STUDENT MONITOR LLC – All Rights Reserved, Unauthorized Use Prohibited
 is the leading mobile phone owned by students iPhone (27%, up sharply from 16% last year) is the leading mobile phone owned by students Samsung’s share remains unchanged while Blackberry’s share has declined sharply from 15% last year to 8% this year Samsung’s share remains unchanged while Blackberry’s share has declined sharply from 15% last year to 8% this year Spring 2012 © STUDENT MONITOR LLC – All Rights Reserved, Unauthorized Use Prohibited")
49
28% (36% last year) plan to purchase a new phone in the next 12 months 28% (36% last year) plan to purchase a new phone in the next 12 months 82% (up from 79%) plan to purchase a SmartPhone 82% (up from 79%) plan to purchase a SmartPhone 43% plan to purchase an Apple iPhone (up from 35% last year) 43% plan to purchase an Apple iPhone (up from 35% last year) 3% plan to purchase a BlackBerry (down sharply from 11% last year 3% plan to purchase a BlackBerry (down sharply from 11% last year Spring 2012 © STUDENT MONITOR LLC – All Rights Reserved, Unauthorized Use Prohibited
 plan to purchase a new phone in the next 12 months 28% (36% last year) plan to purchase a new phone in the next 12 months 82% (up from 79%) plan to purchase a SmartPhone 82% (up from 79%) plan to purchase a SmartPhone 43% plan to purchase an Apple iPhone (up from 35% last year) 43% plan to purchase an Apple iPhone (up from 35% last year) 3% plan to purchase a BlackBerry (down sharply from 11% last year 3% plan to purchase a BlackBerry (down sharply from 11% last year Spring 2012 © STUDENT MONITOR LLC – All Rights Reserved, Unauthorized Use Prohibited")
50
86% report using their mobile for “Texting” 86% report using their mobile for “Texting” Nearly six in ten (57%) used their Smartphone to “take photos” Nearly six in ten (57%) used their Smartphone to “take photos” More than half used their Smartphone to “check email” More than half used their Smartphone to “check email” Spring 2012 © STUDENT MONITOR LLC – All Rights Reserved, Unauthorized Use Prohibited
 used their Smartphone to take photos Nearly six in ten (57%) used their Smartphone to take photos More than half used their Smartphone to check More than half used their Smartphone to check Spring 2012 © STUDENT MONITOR LLC – All Rights Reserved, Unauthorized Use Prohibited")
51
29% (up from 20% last year and 13% two years ago) make purchases with their mobile phone 29% (up from 20% last year and 13% two years ago) make purchases with their mobile phone Among this 29%, in a typical month an average of 7 (up from 4 purchases last year) are made Among this 29%, in a typical month an average of 7 (up from 4 purchases last year) are made The average amount spent is $23 per transaction (similar to last year’s $26) The average amount spent is $23 per transaction (similar to last year’s $26) Spring 2012 © STUDENT MONITOR LLC – All Rights Reserved, Unauthorized Use Prohibited
 make purchases with their mobile phone 29% (up from 20% last year and 13% two years ago) make purchases with their mobile phone Among this 29%, in a typical month an average of 7 (up from 4 purchases last year) are made Among this 29%, in a typical month an average of 7 (up from 4 purchases last year) are made The average amount spent is $23 per transaction (similar to last year’s $26) The average amount spent is $23 per transaction (similar to last year’s $26) Spring 2012 © STUDENT MONITOR LLC – All Rights Reserved, Unauthorized Use Prohibited")
52
31% have applied for 1 or more paid internships (user mean of 2.7) 21% have experienced 1 or more paid internships (user mean of 1.6) 23% have applied for 1 or more unpaid internships (user mean of 2.3) 18% have experienced 1 or more unpaid internships (user mean of 1.7) Spring 2012 © STUDENT MONITOR LLC – All Rights Reserved, Unauthorized Use Prohibited
 21% have experienced 1 or more paid internships (user mean of 1.6) 23% have applied for 1 or more unpaid internships (user mean of 2.3) 18% have experienced 1 or more unpaid internships (user mean of 1.7) Spring 2012 © STUDENT MONITOR LLC – All Rights Reserved, Unauthorized Use Prohibited")
53
Two in three have a resume (66%, highest among Seniors at 79%) Based on helpfulness, “Online resources (65%), “Parents” (57%) and “Friends” (55%) are the highest rated resources to help students write their resume 42% have posted their resume online (LinkedIn, Monster and CareerBuilder.com are the most common sites where students post their resume) 60% of those without a resume cite “I just haven’t taken the time to write it” and 35% mention “No one has ever asked me for my resume” Spring 2012 © STUDENT MONITOR LLC – All Rights Reserved, Unauthorized Use Prohibited
 Based on helpfulness, Online resources (65%), Parents (57%) and Friends (55%) are the highest rated resources to help students write their resume 42% have posted their resume online (LinkedIn, Monster and CareerBuilder.com are the most common sites where students post their resume) 60% of those without a resume cite I just haven’t taken the time to write it and 35% mention No one has ever asked me for my resume Spring 2012 © STUDENT MONITOR LLC – All Rights Reserved, Unauthorized Use Prohibited")
54
Exactly half (50%, including 57% of Seniors) expect to be employed at a full- time job following graduation Exactly half (50%, including 57% of Seniors) expect to be employed at a full- time job following graduation Three in ten (30%, including 25% of Seniors) expect to be attending graduate school full-time Three in ten (30%, including 25% of Seniors) expect to be attending graduate school full-time Spring 2012 © STUDENT MONITOR LLC – All Rights Reserved, Unauthorized Use Prohibited
 expect to be employed at a full- time job following graduation Exactly half (50%, including 57% of Seniors) expect to be employed at a full- time job following graduation Three in ten (30%, including 25% of Seniors) expect to be attending graduate school full-time Three in ten (30%, including 25% of Seniors) expect to be attending graduate school full-time Spring 2012 © STUDENT MONITOR LLC – All Rights Reserved, Unauthorized Use Prohibited")
Similar presentations