Download presentation
Presentation is loading. Please wait.

1
Cost-Effective Interventions for Juvenile Offenders Dr. Peter W. Greenwood Academy of Experimental Criminology Association for the Advancement of Evidence-Based Practice University of California at Irvine VisionQuest Greenwood & Associates

2
The Good News There are proven program strategies and models that consistently improve outcomes, when implemented correctly They cover full range of child development Several pay for themselves, many times over, in reduced corrections costs

3
What Works Functional Family Therapy(FFT) Multi-systemic Therapy(MST) Treatment Foster Care(TFC) Nurse-Family Partnerships(NFP) Cognitive Behavioral Therapy (CBT) Aggression Replacement Training (ART) Program Accountability (QA)
 Multi-systemic Therapy(MST) Treatment Foster Care(TFC) Nurse-Family Partnerships(NFP) Cognitive Behavioral Therapy (CBT) Aggression Replacement Training (ART) Program Accountability (QA)")
5
2005 Legislative Direction (ESSB 6094): “Study options to stabilize future prison populations.” “Study the net short-run and long-run fiscal savings to state and local governments of implementing… evidence-based treatment human service and corrections programs and policies, including prevention and intervention programs, sentencing alternatives, and the use of risk factors in sentencing.” “Project total fiscal impacts under alternative implementation scenarios.” WSIPP published report in October, 2006 2 of 7
: Study options to stabilize future prison populations. Study the net short-run and long-run fiscal savings to state and local governments of implementing… evidence-based treatment human service and corrections programs and policies, including prevention and intervention programs, sentencing alternatives, and the use of risk factors in sentencing. Project total fiscal impacts under alternative implementation scenarios. WSIPP published report in October, of 7")
6
0 1 2 3 4 5 6 7 8 9 10 11 12 1930 1940 1950 1960 1970 1980 1990 2000 2010 2020 *Incarceration Rate Adult Prison Incarceration Rates: 1930 to 2005 *The incarceration rate is defined as the number of inmates in state prisons per 1,000 18- to 49-year-olds in Washington or the United States. 3 of 7 Forecast for WA United States Washington

7
In 2005, crime rates were 26% lower than they were in 1980. In 1980, taxpayers spent $589 per household on the Criminal Justice System. Today they spend $1,125: a 91% increase. All Data are for Washington State: 1980 to 2005 4 of 7 -40% -20% 0% +20% +40% +60% +80% +100% Percent Change Since 1980 198019851990199520002005 Taxpayer Costs Are Up (Inflation-Adjusted Criminal Justice Dollars Per Household) $ $ $ $ $ $ $ $ $ $ $ $ $ $ $ $ $ $ $ $ $ $ $ $ Crime Rates and Taxpayer Costs 20102015 ? ? ? ? Crime Rates Are Down (Violent and Property Crimes Reported to Police, Per 1,000 People)
 $ $ $ $ $ $ $ $ $ $ $ $ $ $ $ $ $ $ $ $ $ $ $ $ Crime Rates and Taxpayer Costs Crime Rates Are Down (Violent and Property Crimes Reported to Police, Per 1,000 People).")
8
6 of 7 Results for Three Example Portfolios of Evidence-Based Options Long-run benefits minus costs$1.1 billion $1.7 billion $2.4 billion Benefit-to-cost ratio $2.45 $2.55 $2.60 Return on investment24%27%28% Crime Rate in 2020 (2005 rate = 52)48 49 Current LevelAggressiveModerateTaxpayer Summary Statistics 16,000 18,000 20,000 22,000 24,000 26,000 28,000 30,000 CFC prison forecast and WSIPP extension Forecast with Current Level Portfolio Forecast with Moderate Implementation Portfolio Forecast with Aggressive Implementation Portfolio Existing Prison Supply & Rented Jail Beds Prison Supply & Demand in Washington: 2008 to 2030 0 200820102012201420162018202020222024202620282030 0 16,000 18,000 20,000 22,000 24,000 26,000 28,000 30,000 200820102012201420162018202020222024202620282030 Prison Beds Current Prison Bed Forecast Current Level Portfolio “Moderate” Expansion Portfolio “Aggressive” Expansion Portfolio Existing Prison Supply & Rented Jail Beds 2 prison shortfall 3 Annual cost of portfolio$41 million $63 million $85 million
48 49 Current LevelAggressiveModerateTaxpayer Summary Statistics 16,000 18,000 20,000 22,000 24,000 26,000 28,000 30,000 CFC prison forecast and WSIPP extension Forecast with Current Level Portfolio Forecast with Moderate Implementation Portfolio Forecast with Aggressive Implementation Portfolio Existing Prison Supply & Rented Jail Beds Prison Supply & Demand in Washington: 2008 to ,000 18,000 20,000 22,000 24,000 26,000 28,000 30, Prison Beds Current Prison Bed Forecast Current Level Portfolio Moderate Expansion Portfolio Aggressive Expansion Portfolio Existing Prison Supply & Rented Jail Beds 2 prison shortfall 3 Annual cost of portfolio$41 million $63 million $85 million")
9
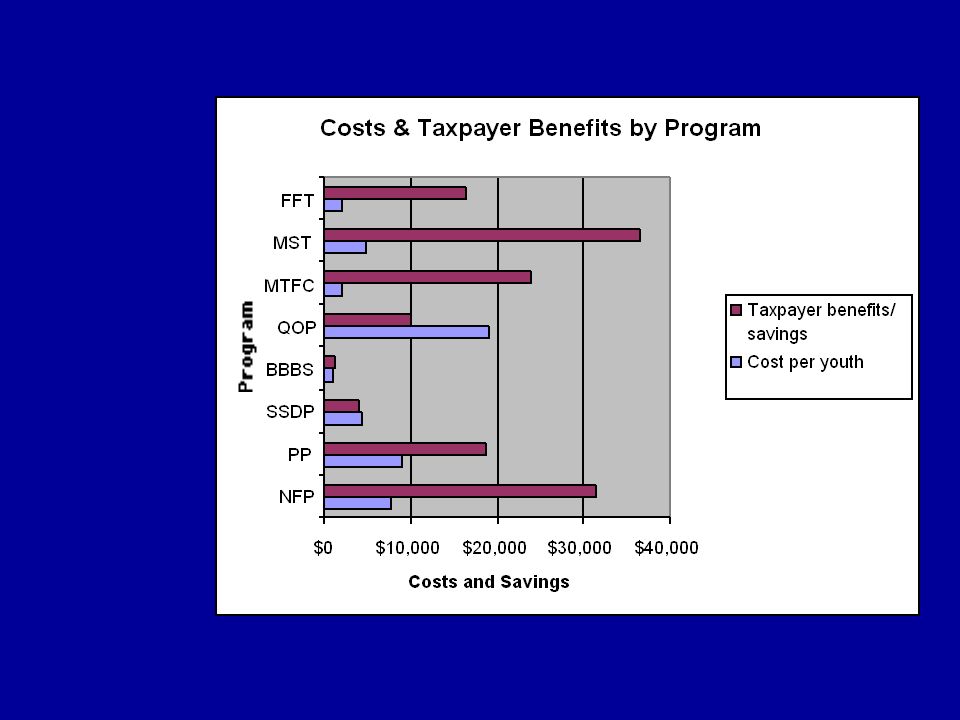
Expected Change In Crime (# of EB Studies) Benefits minus Costs (per-person, life cycle) Adult Drug Courts-8.0% (57)$4,767 Education Prms., Prison-7.0% (17)$10,669 Evidence-Based Programs, Crime Outcomes Some Things Work, Some Don’t…Be a Smart Investor! What does this mean? Answer: Without the Drug Court, an adult offender has a 43% chance of recidivating with a new felony within 8 years; with the Drug Court, the odds drop to about 38%. This finding is based on 57 rigorous studies conducted throughout the United States. What does this mean? Answer: The reduction in recidivism generates $5,640 per participant in benefits to taxpayers (reduced future criminal justice costs) and crime victims (reduced victimization). Drug Courts cost $4,245 more per person than regular court processing (court costs, treatment). Cog-Behavioral Treatment-6.3% (25) $10,299 ISP: surveillance-0.0% (23)-$3,747 ISP: treatment-17.1% (11)$11,563 Electronic Monitoring*-0.0% (9) $870 Family Int. Transitions-13.0% (1)$40,545 Aggression Repl. Trng.-7.3% (4)$14,660 Restorative Justice (low risk) -8.7% (21)$7,067 Adult Offenders Juvenile Offenders Pre-School* (low income) -14.2% (8)$12,196 Nurse Family Partnership*-36.3% (2)$27,105 Prevention Selected Results Why Focus on Juveniles? 73% of Adults in Washington’s Prisons have been in Washington’s Juvenile Justice System Functional Family Thpy.-15.9% (7)$31,821 Drug Tx in Prison (TC or out-patient) -5.7% (20) $7,835
 and crime victims (reduced victimization). Drug Courts cost $4,245 more per person than regular court processing (court costs, treatment). Cog-Behavioral Treatment-6.3% (25) $10,299 ISP: surveillance-0.0% (23)-$3,747 ISP: treatment-17.1% (11)$11,563 Electronic Monitoring*-0.0% (9) $870 Family Int. Transitions-13.0% (1)$40,545 Aggression Repl. Trng.-7.3% (4)$14,660 Restorative Justice (low risk) -8.7% (21)$7,067 Adult Offenders Juvenile Offenders Pre-School* (low income) -14.2% (8)$12,196 Nurse Family Partnership*-36.3% (2)$27,105 Prevention Selected Results Why Focus on Juveniles. 73% of Adults in Washington’s Prisons have been in Washington’s Juvenile Justice System Functional Family Thpy.-15.9% (7)$31,821 Drug Tx in Prison (TC or out-patient) -5.7% (20) $7,835.")
10
What does this mean for Connecticut State has been leader in implementing E-B programs Evidence suggests these investments have high pay-off But these programs are not available to youth at highest risk

11
For further information Greenwood, P.W., Changing Lives: Delinquency Prevention as Crime Control Policy,, University of Chicago Press (2006) Greenwood, P. W. Promising Solutions in Juvenile Justice in Dishion, T. and K. Dodge (eds.) Deviant Peer Influences in Programs for Youth, Guilford Press (2006) www.greenwoodassociates.org peter.greenwood@sbcglobal.net www.wsipp.org
 Deviant Peer Influences in Programs for Youth, Guilford Press (2006)")
Similar presentations


>")


 586-2740 Institute Publications:>")


