Download presentation
Presentation is loading. Please wait.

1
Traffic Theory Jo, Hang-Hyun (KAIST) April 9, 2003
 April 9, 2003")
2
Motivations & Aims Traffic problems get worse. -Heavy traffic congestion, Smog, Noise, and Environmental problems, etc. To discover the fundamental properties and laws in the transportation systems and make applications to the real world.

3
Brief history on traffic research Greenshields (1935) Lighthill & Whitham (1955) : macroscopic model based on fluid-dynamic theory Prigogine et al. (1960) : gas-kinetic model based on the Boltzmann equation Newell (1961) : microscopic, optimal velocity model Musha & Higuchi (1976, 1978) : the noisy behavior of traffic flow
 : gas-kinetic model based on the Boltzmann equation Newell (1961) : microscopic, optimal velocity model Musha & Higuchi (1976, 1978) : the noisy behavior of traffic flow.")
4
(continued) O. Biham et al. (1992) : “Self-organization and a dynamical transition in traffic-flow models”, PRA K. Nagel & M. Schreckenberg (1992) : “A cellular automaton model for freeway traffic”, J. Phys. I France B. S. Kerner & P. Konhauser (1993) : “Cluster effect in initially homogeneous traffic flow”, PRE
 : Self-organization and a dynamical transition in traffic-flow models , PRA K. Nagel & M. Schreckenberg (1992) : A cellular automaton model for freeway traffic , J. Phys. I France B. S. Kerner & P. Konhauser (1993) : Cluster effect in initially homogeneous traffic flow , PRE.")
5
Review Papers Chowdhury et al. : Statistical physics of vehicular traffic and some related systems (Physics Reports 2000) Helbing : Traffic and related self-driven many-particle systems (RMP 2001) Kerner : Empirical macroscopic features of spatial- temporal traffic patterns at highway bottlenecks (PRE 2002) Nagatani : The physics of traffic jams (RPP 2002)
 Helbing : Traffic and related self-driven many-particle systems (RMP 2001) Kerner : Empirical macroscopic features of spatial- temporal traffic patterns at highway bottlenecks (PRE 2002) Nagatani : The physics of traffic jams (RPP 2002).")
6
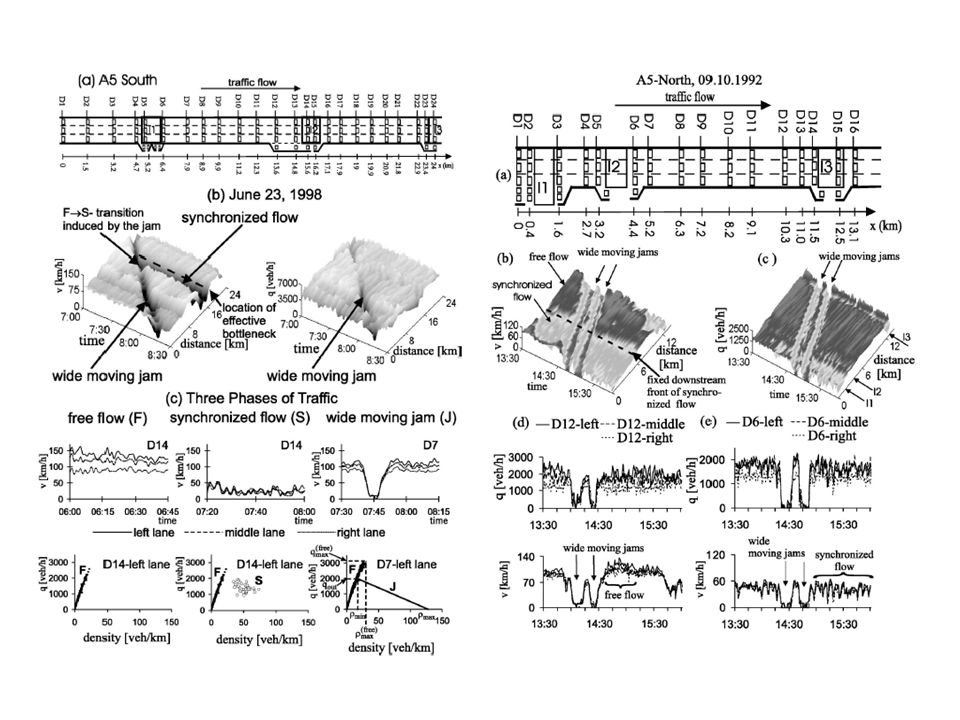
Empirical Findings

7
Schematic diagram of “Fundamental diagram”

10
Modeling Approach for Vehicle Traffic

11
Models 1 : Microscopic Follow-the-leader model / optimal velocity model : Newell ; relaxation time, ; Optimal velocity function Intelligent driver model : Treiber et al. (PRE 2000) ; headway relative velocity
 ; headway relative velocity.")
12
(continued) The next-nearest-neighbor interaction : Nagatani (PRE 1999) ; interaction strength Backward looking optimal velocity model : Nakayama (PRE 2001) → Stabilize and enhance the traffic flow
 The next-nearest-neighbor interaction : Nagatani (PRE 1999) ; interaction strength Backward looking optimal velocity model : Nakayama (PRE 2001) → Stabilize and enhance the traffic flow")
14
Models 2 : Cellular Automata Nagel-Schreckenberg model (J. Phys. I France 1992) 1)Motion : v i cells forward 2)Acceleration : v i ’=v i +1 if v i <v max 3)Deceleration : v i ’’=d i -1 if d i ≤v i ’ 4)Randomization : v i+1 =v i ’’-1 with probability p discretization of time and space :
 1)Motion : v i cells forward 2)Acceleration : v i ’=v i +1 if v i <v max 3)Deceleration : v i ’’=d i -1 if d i ≤v i ’ 4)Randomization : v i+1 =v i ’’-1 with probability p discretization of time and space :.")
16
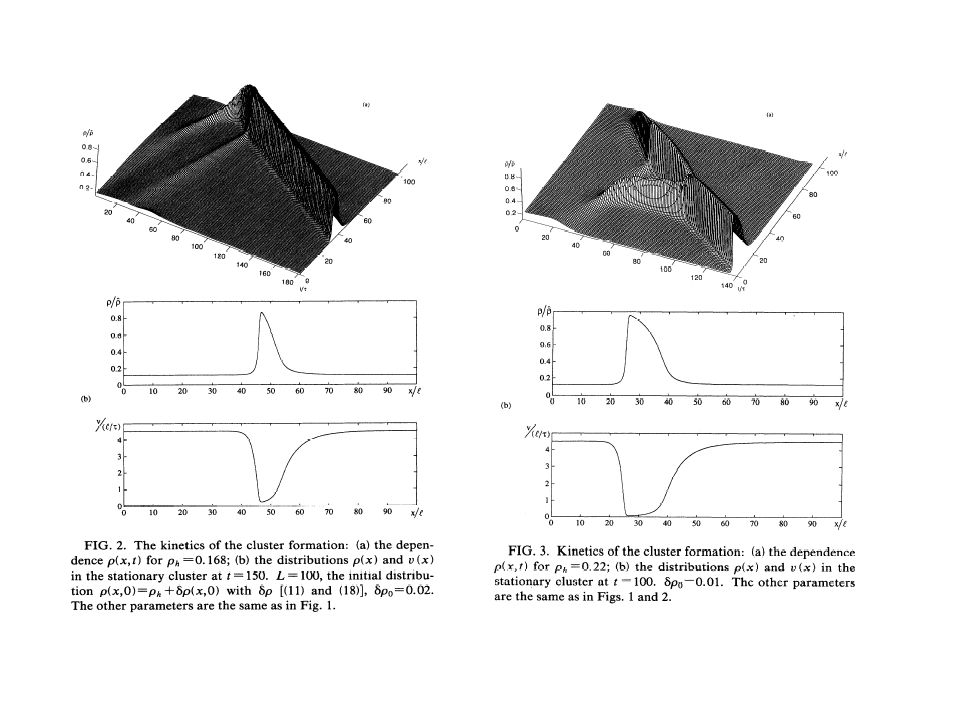
Models 3 : Macroscopic Traffic flow as a 1D compressible fluid : Kerner & Konhauser (PRE 1993) Eq. of motion : Eq. of continuity : variance of velocity safe velocity relaxation time viscosity

18
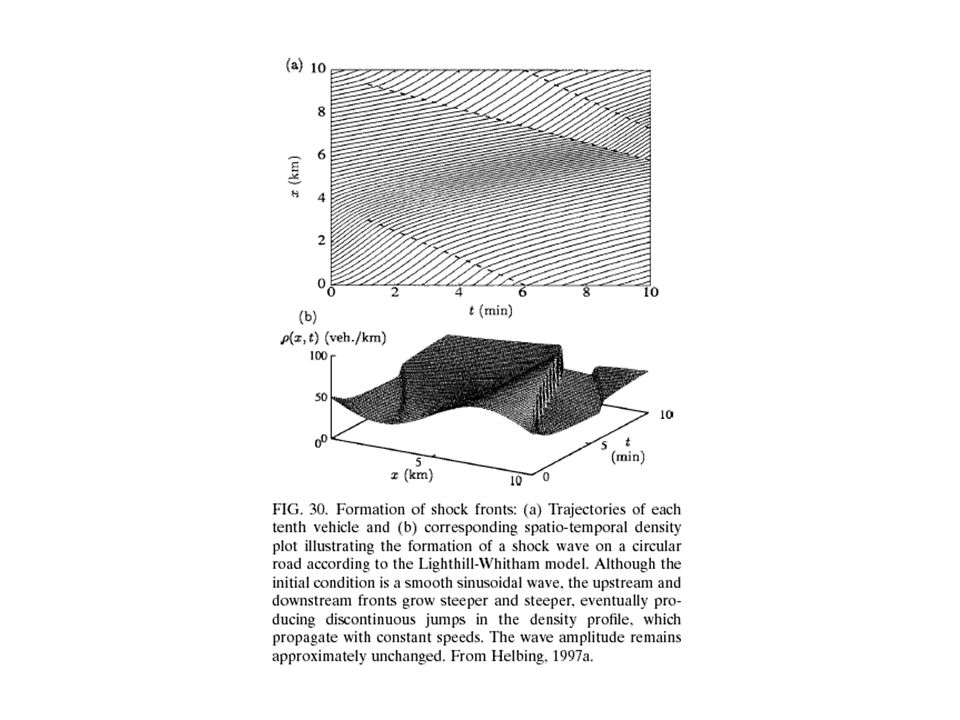
(continued) Lighthill-Whitham Model (1955), where Greenshields (1935) equilibrium velocity-density relation velocity of propagation of kinematic waves :
 Lighthill-Whitham Model (1955), where Greenshields (1935) equilibrium velocity-density relation velocity of propagation of kinematic waves :")
20
(continued) To avoid the development of shock fronts, add a diffusion term. → Burgers equation Cole-Hopf transformation → linear heat equation

21
Models 4 : Gas-kinetic Prigogine’s Boltzmann-like Model (1960,1971) ; distribution function ; desired velocity distribution ; relaxation time
 ; distribution function ; desired velocity distribution ; relaxation time")
22
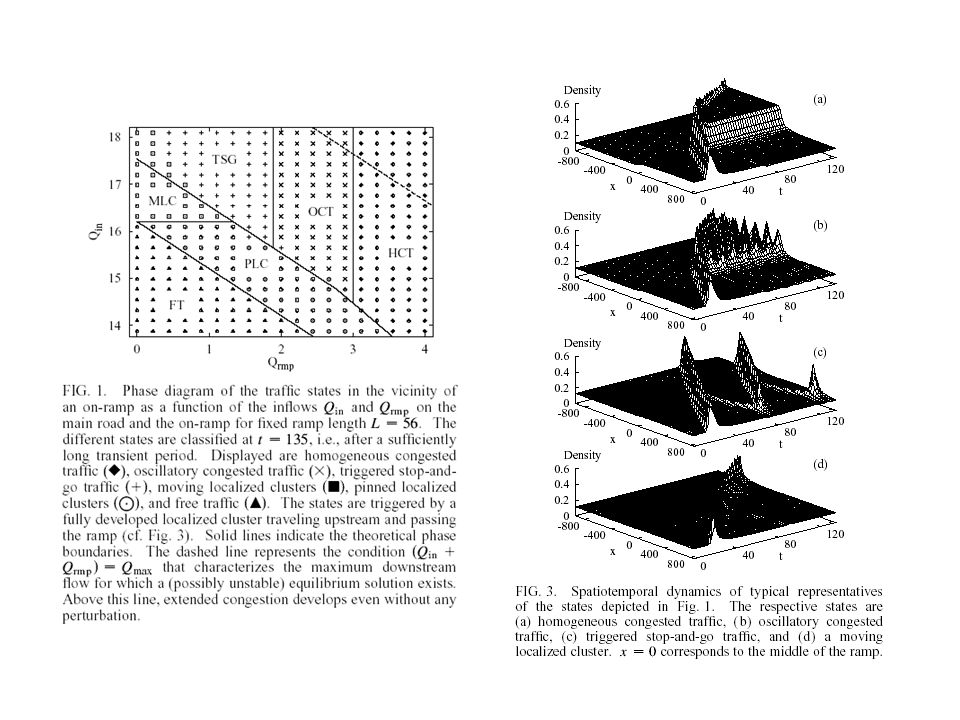
(continued) Phase diagram in the presence of inhomogeneities : Helbing et al. (PRL 1999) → the nonlocal, gas-kinetic-based traffic model
 → the nonlocal, gas-kinetic-based traffic model.")
24
Pedestrian Traffic

25
Formation of human trail systems Active walker model : Helbing et al. (Nature 1997, PRE 1997) Active walker Environment Other walkers
 Active walker Environment Other walkers.")
26
Active walker model natural ground potential ground potential strength of new markings The moving agents continuously change the environment by leaving markings while moving.

27
(continued) desired direction trail potential or attractiveness destination potential motion of a pedestrian α
 desired direction trail potential or attractiveness destination potential motion of a pedestrian α")
28
Active walker model : Results For large σ, ∇ V becomes negligible. → direct way system For small σ, ∇ U becomes negligible. → minimal way system Otherwise, → minimal detour system

29
Alfred Russell / Panic (1961)
")
30
Escape panic People try to move faster than normal. Interactions among people become physical in nature. Jams build up. People show a tendency towards mass behavior to do what other people do. Alternative exits are often overlooked or not efficiently used in escape situations.

31
Modeling acceleration equation repulsive interaction force body force sliding friction force

32
Results

33
Applications & Future Works Optimization of byways around ‘Duck Square’ in KAIST using trail formation methods Study on the transportation systems that guarantee the safety of pedestrians

34
Traffic and Self-Organized Criticality

35
Fundamental Diagram Flow-density relations ; empirical Helbing (RMP 2001) Schematic diagram Nagatani (RPP 2002)
 Schematic diagram Nagatani (RPP 2002)")
36
Phase transition in traffic TrafficGas-liquid Freeway trafficGas Jammed trafficLiquid Headway (dist. between cars) Volume Vehicle densityDensity Drivers’ sensitivityTemperature
 Volume Vehicle densityDensity Drivers’ sensitivityTemperature.")
37
What happens at critical point? (i) If v=v max and n gap ≥v max, v t+1 =v t (ii) When it is jammed 1) acceleration : v t+1 =v t +1 with prob. ½ if n gap ≥v+1 2) slow down due to other cars : v t+1 =n gap if n gap ≤v-1 3) overaction : v=max(n gap -1,0) with prob. ½ (iii) Movement : Each vehicle advances v sites “Emergent traffic jams” : Nagel & Paczuski (PRE 1995) SOC in traffic : Cellular automata model
 If v=v max and n gap ≥v max, v t+1 =v t (ii) When it is jammed 1) acceleration : v t+1 =v t +1 with prob. ½ if n gap ≥v+1 2) slow down due to other cars : v t+1 =n gap if n gap ≤v-1 3) overaction : v=max(n gap -1,0) with prob. ½ (iii) Movement : Each vehicle advances v sites Emergent traffic jams : Nagel & Paczuski (PRE 1995) SOC in traffic : Cellular automata model.")
38
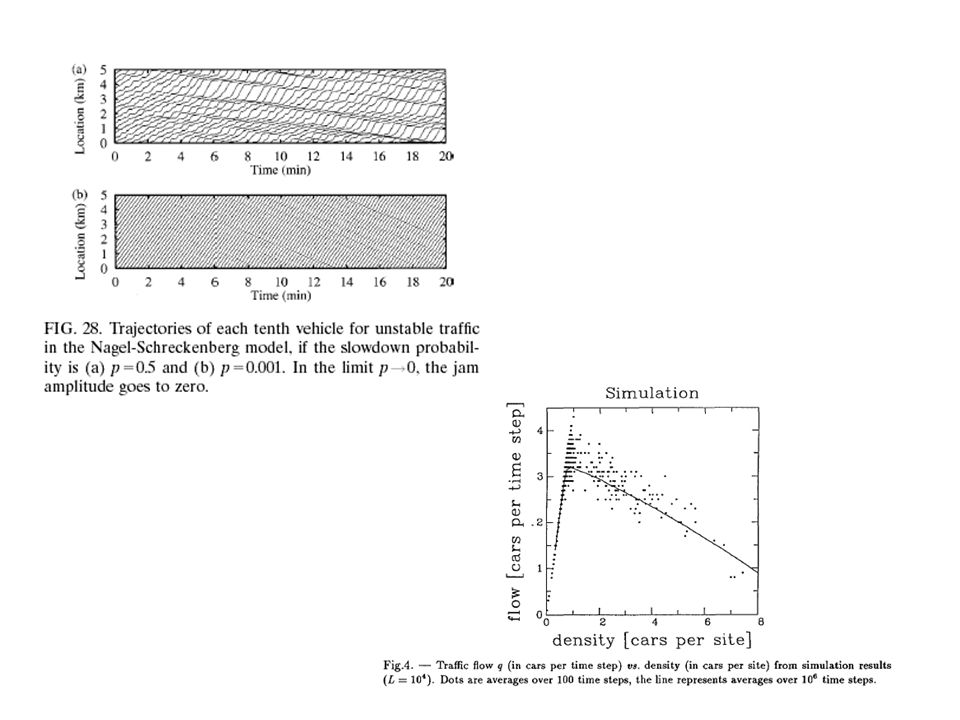
CA Model : Results

39
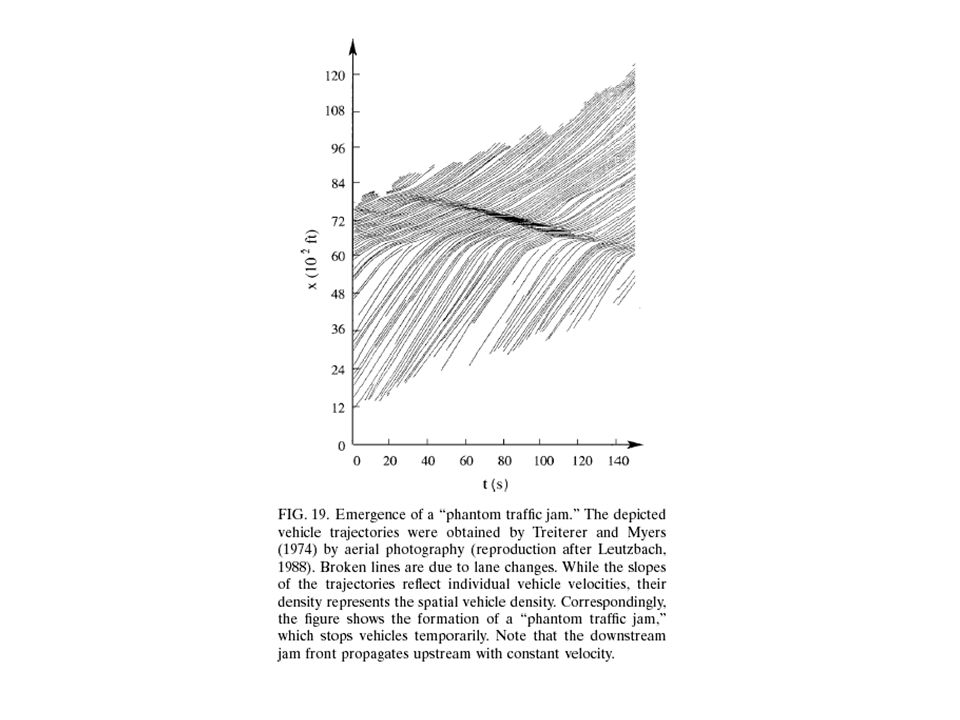
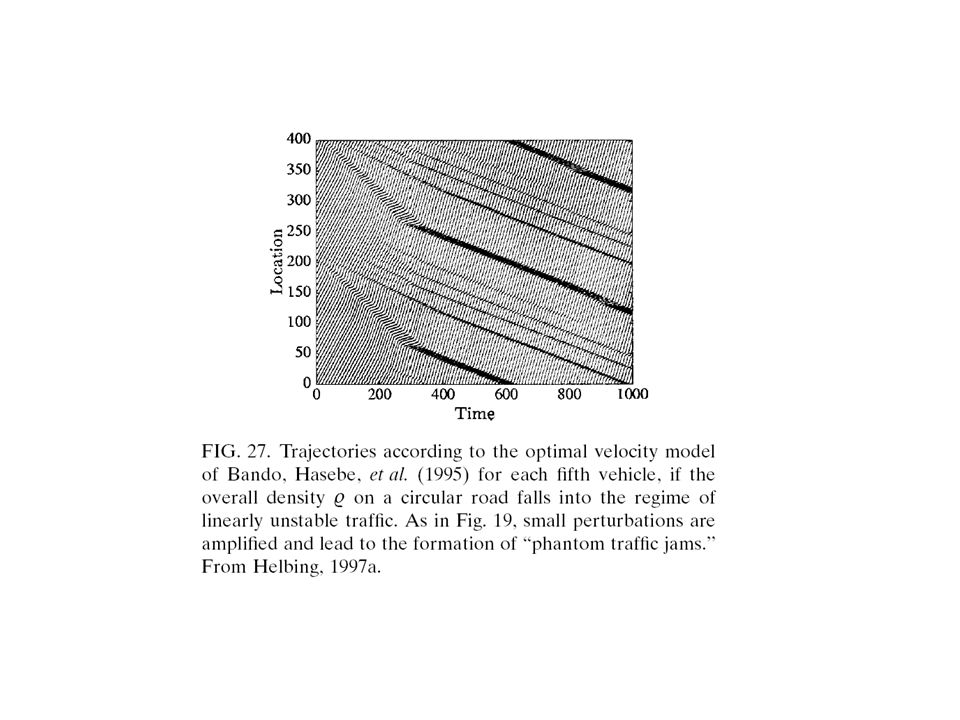
(continued) prob. dist. of jams of lifetime t “phantom traffic jams” -Spontaneous formation of jams with no obvious reason (i)Spontaneous small fluctuations grow to jams of all sizes. (ii) Cruise-control may make prediction more difficult.
Spontaneous small fluctuations grow to jams of all sizes. (ii) Cruise-control may make prediction more difficult..")
40
Why self-organize? ? Sandpile modelTraffic model Maximum throughput SandpileTraffic SubcriticalThreshold=0Low density Critical0<Threshold<∞Critical density SupercriticalThreshold→∞High density

41
How self-organize? Model of computer network traffic : Sole & Valverde (Physica A 2001) Hosts and routers on 2D lattice Hosts create packets with prob. λ. Packets are forwarded via routers to destination hosts. To minimize the communication time, the shortest path must be taken and the congested links avoided. The congestion of a link = the amount of packets forwarded through that link.
 Hosts and routers on 2D lattice Hosts create packets with prob. λ. Packets are forwarded via routers to destination hosts. To minimize the communication time, the shortest path must be taken and the congested links avoided. The congestion of a link = the amount of packets forwarded through that link..")
42
Network traffic model : Results If congestion is low, users might increase their levels of activity. If it is very congested, users decrease or leave the system. → The system might self-organize into the critical state.

43
Applications & Future Works How to optimize traffic networks (the Internet) - to minimize cost Which is the best path (strategy) for drivers (users)? Analogy : particles ↔ vehicles ↔ packets However, self-driven many-particle system agentsneuron signals

Similar presentations


>")


 To view the embedded objects in this Document,>")

. Learning Objectives To differentiate between interrupted and uninterrupted flow facilities To define general and linear.>")


, Rex Oleson II (b), Dr. D. J. Kaup (c) (a,b,c) Institute for Simulation and.>")


 11th Week 04.07.-06.07.2007.>")
 Know the primary elements of traffic flow Know the difference between TMS and SMS Know.>")