Download presentation
Presentation is loading. Please wait.

1
The Economics of Climate Change
Daniel De La Torre Ugarte Professor, University of Tennessee Trade, Environment, Climate Change and Sustainable Development Branch, UNCTAD

2
Environemental Problems According to Area of Influence
Domestic: Local/Regional Bi-national / Multinational Global

4
Sources of emissions

5
Externalities Left on its own, the market will not solve the problem in a social optimal way Climate change is an externality: the emitter does not bear the direct costs of their action. As with any externality without policy interventions, the emitter has little motivation to consider the costs in their decision-making.

6
Climate Change is a Unique Externality”
The emission of greenhouse gasses imposes costs on others that are not borne by the emitter. The costs will be felt over a long time period and over the entire world. But, the exact nature of costs is uncertain: they will be shaped by policies, market mechanisms, & other events. Those most affected—future generations– cannot speak up for their interests

7
Basic Policy Approaches For Reducing GHGs
Tax the emitter equivalent to the marginal external social costs Ultimately borne by households, raises revenues that can be used to achieve other goals, provides incentives to economize on the damaging activity The allocation of property rights linked with emissions trading Provides large emitters the flexibility to trade emission rights across sectors. Direct regulation Tends to place burden on industry (which generally passes on the costs to consumers—if they can/will pay) Provide financial incentives Usually popular, sends clear signals, but often suffers from free rider problem.
 Provide financial incentives. Usually popular, sends clear signals, but often suffers from free rider problem.")
10
Stern Review on the Economics of Climate Change
Author: Economist Sir Nicholas Stern Purpose: Created for the British government to address climate change using economic analysis Length: 700 pages! Published: October, 2006

11
The Science Doubling of pre-industrial greenhouse gases (~ 1900) = 2°-5° C change in mean global temperatures This doubling will most likely occur between 2030 and 2060, at today’s rate of carbon emissions Feedback effects could bring temperatures even higher (permafrost thaw) 3 ½ to 9 degrees F
 3 ½ to 9 degrees F.")
12
Risk If carbon emissions stabilize at today’s rates:
0-2% chance of less than 1° C increase in temps. 2-20% chance of greater than 5° C increase in temps. Risk on high side > risk on low side

13
Projected impacts of climate change
Global temperature change (relative to pre-industrial) 0°C 1°C 2°C 3°C 4°C 5°C Food Falling crop yields in many areas, particularly developing regions Possible rising yields in some high latitude regions Falling yields in many developed regions Water Significant decreases in water availability in many areas, including Mediterranean and Southern Africa Small mountain glaciers disappear – water supplies threatened in several areas Sea level rise threatens major cities Ecosystems Extensive Damage to Coral Reefs Rising number of species face extinction So, how did the Review demonstrate that climate change is so important? It did so in two ways. First, it looked at the potential impacts and effects of climate change at different increases in temperature, then related those temperature rises to projections of greenhouse gas emissions. Many of you will know that this is the task of the Intergovernmental Panel on Climate Change’s WG2 on impacts, adaptation and vulnerability, and it supports the findings of the Review. If the world continues to emit greenhouse gases in the quantities we are doing right now, we run very high risks – it implies a rise in temperature of around 4-5 degrees C above pre-industrial levels, which we’ve not really considered or seen before. A change of 5 degC could change the worlds physical geography, and therefore human geography, how we live our lives. And these effects are, in the main, negative effects and inequitable – they hit poor countries earliest and hardest. Let me give just one example briefly: at a temperature increase of 1 deg C, we expect severe impacts in the marginal Sahel, at an increase of 2-3deg C we may see a 25-60% increase in the people at risk of hunger with half of that increase in Africa and West Asia, while at 4-5degC scientists expect crop yields to decline by up to a third in Africa. Many other effects of climate change are mediated through water, risks of more extreme events such as both drought and flooding - leading to major water shortages. There are risks to ecosystems, of extinction of major species, of abrupt and major irreversible changes. Extreme Weather Events Rising intensity of storms, forest fires, droughts, flooding and heat waves Risk of Abrupt and Major Irreversible Changes Increasing risk of dangerous feedbacks and abrupt, large-scale shifts in the climate system
 0°C. 1°C. 2°C. 3°C. 4°C. 5°C. Food. Falling crop yields in many areas, particularly developing regions. Possible rising yields in some high latitude regions. Falling yields in many developed regions. Water. Significant decreases in water availability in many areas, including Mediterranean and Southern Africa. Small mountain glaciers disappear – water supplies threatened in several areas. Sea level rise threatens major cities. Ecosystems. Extensive Damage to Coral Reefs. Rising number of species face extinction. So, how did the Review demonstrate that climate change is so important It did so in two ways. First, it looked at the potential impacts and effects of climate change at different increases in temperature, then related those temperature rises to projections of greenhouse gas emissions. Many of you will know that this is the task of the Intergovernmental Panel on Climate Change’s WG2 on impacts, adaptation and vulnerability, and it supports the findings of the Review. If the world continues to emit greenhouse gases in the quantities we are doing right now, we run very high risks – it implies a rise in temperature of around 4-5 degrees C above pre-industrial levels, which we’ve not really considered or seen before. A change of 5 degC could change the worlds physical geography, and therefore human geography, how we live our lives. And these effects are, in the main, negative effects and inequitable – they hit poor countries earliest and hardest. Let me give just one example briefly: at a temperature increase of 1 deg C, we expect severe impacts in the marginal Sahel, at an increase of 2-3deg C we may see a 25-60% increase in the people at risk of hunger with half of that increase in Africa and West Asia, while at 4-5degC scientists expect crop yields to decline by up to a third in Africa. Many other effects of climate change are mediated through water, risks of more extreme events such as both drought and flooding - leading to major water shortages. There are risks to ecosystems, of extinction of major species, of abrupt and major irreversible changes. Extreme Weather Events. Rising intensity of storms, forest fires, droughts, flooding and heat waves. Risk of Abrupt and Major Irreversible Changes. Increasing risk of dangerous feedbacks and abrupt, large-scale shifts in the climate system.")
14
Anticipated Regional Impacts
Climate change impacts will vary upon regions. This table provides a sample of some predictions for regions of the world.

15
Examples of Impacts of Climate Change: Africa
(The information provided with this map is self explanatory)
")
16
Examples of Impacts of Climate Change: Asia
(The information provided in this table is self explanatory)
")
17
Stabilization and Commitment to Warming
5% 400 ppm CO2e 95% 450 ppm CO2e 550 ppm CO2e 650ppm CO2e There are some very serious threats we face, and by considering those risks, the Review finds that we should try to do something to stabilise greenhouse gas emissions, in order to avoid these dangerous temperature increases. Our emissions are a flow each year that accumulates in the atmosphere, building up stocks over time – concentrations – and it is that stock that leads to climate change. At the moment, we are at around 430ppm concentrations, and rising by around 2ppm per year. Therefore, stabilising at around 450ppm, where the risk of a temperature rise of around 2deg C will be about 50:50, will be very difficult – we will get to 450 within the next 10 years on current projections. But even something more “realistic” of stabilising at around 550ppm would be very risky – that gives a 50:50 chance of a 3 deg C rise, but it is far less risky than staying on a BAU path, which gets us to 5 deg rises. This underlines the problem, that the actions we – the world - takes now make a very large difference. 750ppm CO2e Eventual temperature change (relative to pre-industrial) 0°C 1°C 2°C 3°C 4°C 5°C 17
 0°C. 1°C. 2°C. 3°C. 4°C. 5°C. 17.")
18
Mean losses in income per capita from scenarios of climate change
I mentioned earlier that the Stern Review demonstrated that climate change is urgent and serious in two ways, and this is the second. As you will know, economists like to turn concepts, actions, events into numbers – and that is exactly what we did here. We considered just how much these sorts of impacts might cost the world, and comparing those to what the costs of doing something about emissions now – trying to stabilise at those levels I’ve already mentioned of ppm – might be. To do this, we averaged over three things – time, risk and countries. Depending on how you average these things, on whether, for example, you take an ethical view about how we should value future generations, about how we should value those who are poorer than us, we found that these costs equated to something between 5 and 20% of GDP every year if we continue as we are. 5 and 20% of GDP – those are big numbers, and a wide range. But even that valuation is limited – there were many things, many impacts on human life, that as economists, we still can’t value. And modelling is a simplification exercise. But at least it gives a broad range of the kinds of costs we might expect. Essential to take account of risk and uncertainty Models do not provide precise forecasts Assumptions on discounting, equity, and risk aversion affect results

19
Taking urgent action makes good economics - delaying is dangerous and costly
The cost of cutting emissions consistent with a 550ppm CO2e stabilisation trajectory averages 1% of GDP per year in 2050 – this can be achieved by deployment of available technologies and those expected to be commercialised in coming decades Delaying emissions reductions significantly constrains the opportunities to achieve lower stabilisation - strong mitigation is fully consistent with aspirations for growth and development in poor and rich countries And compared to the costs of reducing emissions? Well, that depends on when we start to cut emissions, how we do so, and how much technology costs fall over time. This graph illustrates the scale of action required. Doing more, costs more. But, for example, we found that a very wide range of models – both top down and bottom up - suggest that trying to stabilise at 550ppm will cost 1% of GDP per year. Again, that finding was corroborated by the IPCC report on mitigation released earlier this month. It is manageable, and it means we can grow and be green. In fact, comparing this to the potential costs of doing nothing, it is the other way round – if we don’t tackle climate change we will reduce growth and development. And that’s a strong message. A strong message delivered by Sir Nick that was embraced by African Heads of State at the African Union summit here in Addis Ababa earlier this year – so much so that they adopted a declaration on climate change and development. 19

20
Costs of climate change
A loss of 5% average per capita GDP ‘now and forever’ Costs are not evenly distributed Developing nations will pay higher price Sub-Sahara Africa (high non-market costs) India & Southeast Asia (9-13% loss in GDP) Developed nations will vary depending upon geography US (1-1.2% loss in GDP)
 India & Southeast Asia (9-13% loss in GDP) Developed nations will vary depending upon geography. US (1-1.2% loss in GDP)")
21
What kinds of costs? Agriculture Water Temperature Mortality
Increased flooding / droughts Extreme weather events Mortality Heat Malnutrition Disease Infrastructure Storm damage Coastal Protection Species Loss

22
Other potential cost factors
Non-market impacts Environment & human health Amplified feedback effects Methane release & loss of carbon sinks Correct weighting of poor regions If these factors are taken into account, total costs are potentially as high as 20% of world GDP

23
Economics of Stabilization
Today’s Carbon level: 430 ppm Pre-industrial level: 280 ppm ‘Business as usual’: 550 ppm by 2035 and 700 ppm by 2100 creating temperature changes unseen in human experience Last ice age to pre-industrial = 5 degree C temp difference

24
Sources: National differences
Direct relationship between per capita income and carbon emissions. U.S. emits five time the world average for per person carbon emissions As populations increase, carbon emissions will increase As the large populations in Asia (India & China) continue to develop economically, carbon emissions will continue to increase.
 continue to develop economically, carbon emissions will continue to increase.")
25
Stabilization Goal Stabilization defined: A balance whereby emissions are equal to the Earth’s natural capacity to remove the gases. Carbon Goal to obtain stabilization: ppm Cut of 25% of current emissions levels by 2050 Cost of abatement: Approximately 1% of world GDP Consistent with continued growth & development

26
Emergency Pathways Global emissions peak in 2015
Emergency Pathways Global emissions peak in Drop by % by 2050 Risk of exceeding 2ºC These three pathways define a band of emergency reduction trajectories The least stringent of these emergency pathways – by which we mean 50% emissions reduction by 2050 – is being supported by the most courageous politicians. This is progress. But the fact remains that this is a rather risky trajectory. So, taking seriously that the climate crisis warrants an emergency response, we take the most stringent of these pathways, the blue line, the one that has global emissions dropping by 80% by 2050, as our reference, and reckon our calculations with respect to it. Delaying the peak, or slowing the subsequent rate of reductions, increases the risk of exceeding 2ºC

27
What does the Emergency Pathway mean for Southern development?
80% global reductions by 2050 What’s left for the South? The blue line is our global emergency pathway – the most most stringent of the three from the previous slide The green line is 90% (below 1990) by 2050, Gore’s trajectory, but across all of the A1 countries rather than just the US The purple line is the problem. This is where the tension between climate protection and development comes in. This is where the global climate policy impasse resides. NOTE: Relaxing the blue pathway doesn’t really change our results – unless you really relax it to blow off stringency Quick CYA: This slide approximates the North with A1 and the South with NA1 90% by 2050 in the North Greenhouse Development Right Framework
 by 2050, Gore’s trajectory, but across all of the A1 countries rather than just the US. The purple line is the problem. This is where the tension between climate protection and development comes in. This is where the global climate policy impasse resides. NOTE: Relaxing the blue pathway doesn’t really change our results – unless you really relax it to blow off stringency. Quick CYA: This slide approximates the North with A1 and the South with NA1. 90% by in the North. Greenhouse Development Right Framework.")
28
Income and Capacity National income distributions showing capacity (in green) as fraction of income above the development threshold India China US The curves here represent reasonable approximations of the income distributions within these three countries. Each chart arrays people from poorest to the richest member of these three countries. (We’ve constructed such curves for all countries, using the World Bank and World Income Inequality Databases of per-capita incomes and GINI coefficients, respectively.) The first thing to notice is the horizontal line at $9,000 that represents the development threshold You can see that a very small portion of India’s population, about 4% earns more than the $9,000 development threshold. (And the income above the threshold is about 4% of the aggregate national income.) A much larger portion, nearly 95%, of the US population earns more than the development threshold. (And the income above the threshold is about 80% of the aggregate national income.) China falls of course between these two. It’s total consuming class is almost the size of the US consuming class, but has a much smaller aggregate capacity. (About China’s 22% of population, 24% of aggregate national income.) It’s these green areas – income above the threshold – that represent our definition of national capacity. If we think of the burden sharing system as a global income tax, the development threshold can be thought of as marking a “0% tax bracket”, so as to shield the resources of those who’ve not yet reached the development threshold. On thing that is plainly obvious is that the US, despite its much smaller population, has the lion’s share of the capacity – and (you’ll see in a moment) a similarly disproportionate national obligation. The obligation falling on those members of the global consuming class residing in India and China is small enough that it might be reasonable to excuse them altogether. However, as a political matter, it is probably not possible to do so. It unlikely that the working consensus to pay a large proportion of the total mitigation and adaption bill could ever emerge in the US if the “wealthy” people in the Indian and Chinese nations were not also paying their “fair shares.” Ultimately, this “Greenhouse Development Rights” approach seeks to define, in quantifiable terms, such national fair shares – fair in the sense of safeguarding the right to development, by – again – shielding those below the line from the costs of action. The precisely analogous calculation can be done for responsibility…. $9,000/capita (PPP) “development threshold”
 The first thing to notice is the horizontal line at $9,000 that represents the development threshold. You can see that a very small portion of India’s population, about 4% earns more than the $9,000 development threshold. (And the income above the threshold is about 4% of the aggregate national income.) A much larger portion, nearly 95%, of the US population earns more than the development threshold. (And the income above the threshold is about 80% of the aggregate national income.) China falls of course between these two. It’s total consuming class is almost the size of the US consuming class, but has a much smaller aggregate capacity. (About China’s 22% of population, 24% of aggregate national income.) It’s these green areas – income above the threshold – that represent our definition of national capacity. If we think of the burden sharing system as a global income tax, the development threshold can be thought of as marking a 0% tax bracket , so as to shield the resources of those who’ve not yet reached the development threshold. On thing that is plainly obvious is that the US, despite its much smaller population, has the lion’s share of the capacity – and (you’ll see in a moment) a similarly disproportionate national obligation. The obligation falling on those members of the global consuming class residing in India and China is small enough that it might be reasonable to excuse them altogether. However, as a political matter, it is probably not possible to do so. It unlikely that the working consensus to pay a large proportion of the total mitigation and adaption bill could ever emerge in the US if the wealthy people in the Indian and Chinese nations were not also paying their fair shares. Ultimately, this Greenhouse Development Rights approach seeks to define, in quantifiable terms, such national fair shares – fair in the sense of safeguarding the right to development, by – again – shielding those below the line from the costs of action. The precisely analogous calculation can be done for responsibility…. $9,000/capita (PPP) development threshold")
29
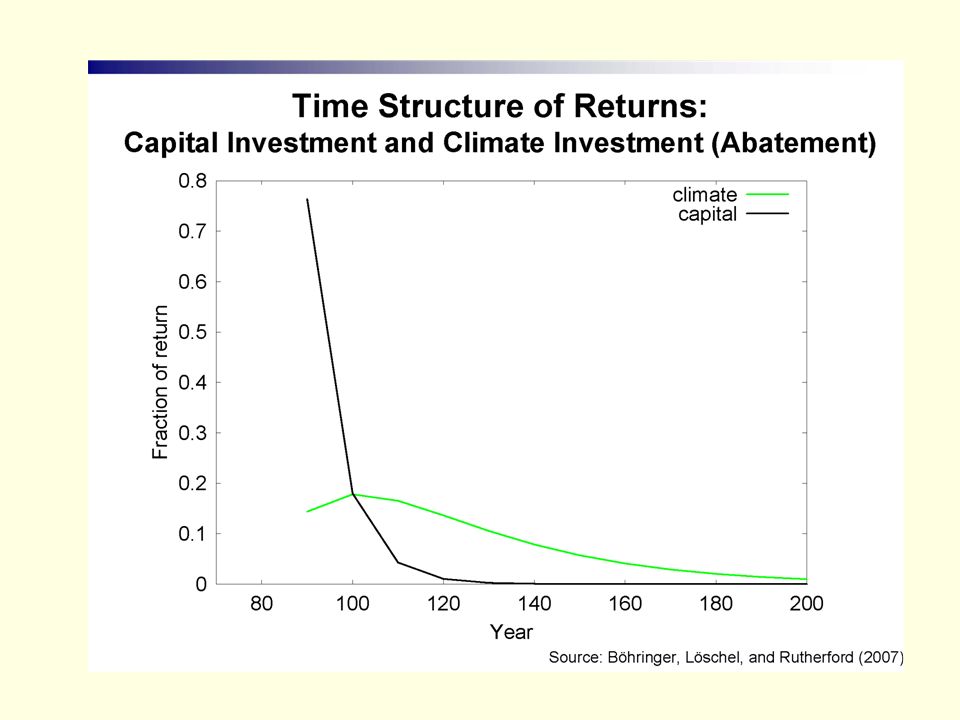
Cost of delay Mitigating carbon emissions is a slow process
Once abatement proceeds, peak emissions will still not occur for ten or more years The longer the wait, the greater the risk factors associated with drastic climate change The longer the wait, the greater the costs associated with abatement

30
Abatement Opportunities I
Reduce non-fossil fuel emissions Land use (deforestation) Halt deforestation especially in tropics Plant new forests Require enforcement & regulatory costs Require aid from developed world Agriculture Change tilling practices Produce bioenergy crops
 Halt deforestation especially in tropics. Plant new forests. Require enforcement & regulatory costs. Require aid from developed world. Agriculture. Change tilling practices. Produce bioenergy crops.")
31
Abatement Opportunities II
Reduce Demand for Emission-intensive goods Primarily energy use in heating, transport, & electricity Pricing signals via taxes. Costs to atmosphere should be included in purchase of offending products Change preferences via information

32
Abatement Opportunities III
Improve energy efficiency Power generation Energy use Efficient appliances & vehicles Greatest abatement potential may lie here.

33
Abatement Opportunities IV
Switch to lower carbon emitting energy production Wind Wave & tidal Solar Carbon capture Hydrogen Nuclear Hydroelectric Bioenergy

34
Policy requirements Successful policy requires three elements:
1. Carbon pricing 2. Technology policy 3. Remove barriers to change

35
Carbon Pricing The cost of carbon emissions must be included in the pricing of carbon emitting goods This will result in: Less of the offending activity Incentives to find non-emitting alternatives Types of pricing Taxes Pros: creates revenues Cons: unpopular, does not directly control amount of emissions Carbon trading (cap & trade) Pros: efficient, directly controls amount of emissions Cons: does not create revenue
 Pros: efficient, directly controls amount of emissions. Cons: does not create revenue.")
36
Technology Policy Public investment in R&D
R&D subsidies encourage private firms to invest in risky technology Creation of new technologies become public goods which can be dispersed globally

37
Remove barriers to change
Standards Where carbon pricing proves ineffective, regulatory standards may be useful Education Understanding of climate change and its consequences can shape future policy

38
Adaptation Strategies
High-quality climate information Rainfall & storm patterns critical Land-use standards Infrastructure should account for climate change Climate sensitive public goods Natural resource & coastal protection Emergency readiness Social safety nets Those who are most vulnerable and cannot afford protection (insurance)
")
39
Collective Action Climate change is a global problem which will require: Building of effective institutions Shared understanding of long-term goals Leadership and trust

40
Thanks ! daniel.de.la.torre.ugarte@unctad.org danieltu@utk.edu
Stern Review on the Economics of Climate Change

Similar presentations


 February.>")


