Download presentation
Presentation is loading. Please wait.

1
The Next Three Weeks In this sequence we will cover end-to-end data collection and analysis for a practical application. The overall objective is to develop an algorithm to determine ground surface temperature using satellite imagery, and to correlate and calibrate that algorithm against field measurements taken with calibrated thermocouples through a data acquisition system. At the end of the sequence, you will have an introductory familiarity with: Remote Sensing NASA’s LandSat 8 satellite imagery products Geographic Information Systems (GIS) using a free software platform, QGIS Thermal infrared spectrum analysis Ground surface temperature derivation Thermocouple design and calibration Data acquisition through a analog to digital (A/D) converter MySQL data storage and retrieval Data calibration, statistical analysis and correlations using the R-Project for statistical computing Collecting field data for ground truthing Correlation and calibration of ground data against satellite derived data
 using a free software platform, QGIS Thermal infrared spectrum analysis Ground surface temperature derivation Thermocouple design and calibration Data acquisition through a analog to digital (A/D) converter MySQL data storage and retrieval Data calibration, statistical analysis and correlations using the R-Project for statistical computing Collecting field data for ground truthing Correlation and calibration of ground data against satellite derived data.")
2
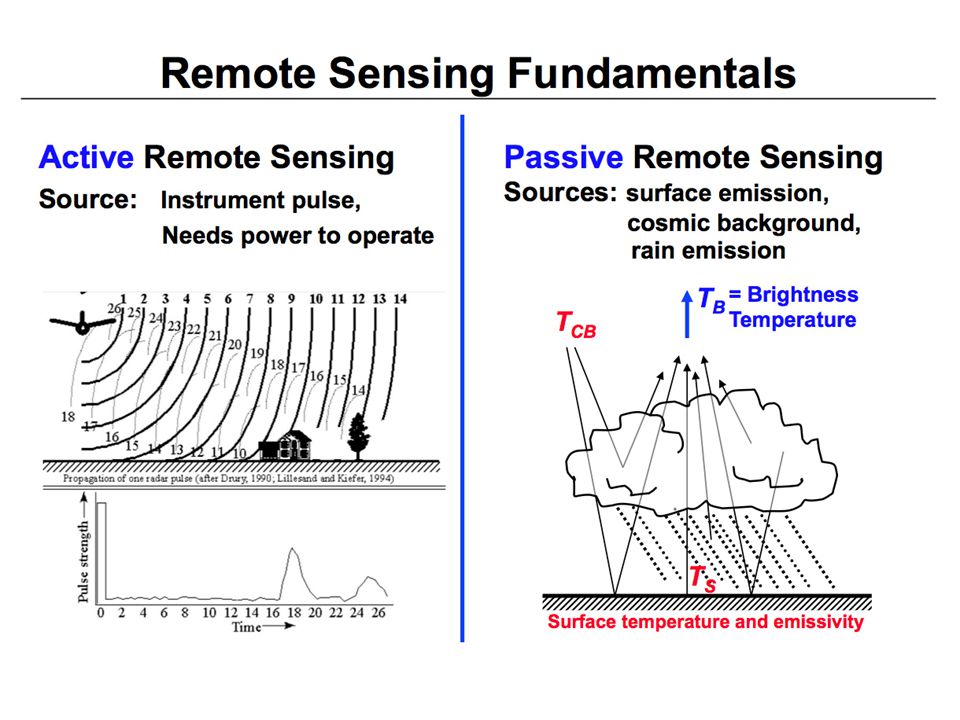
Remote Sensing The term remote sensing usually describes the collection of data by satellites. In most cases, the “remote” refers to spectral imagery collected by cameras and other spectral instruments across a broad range of wavelengths. In case the of Earth observation, satellites take spectral data reflecting from the atmosphere and the Earth’s surface. Interpretation of this data (often represented as imagery) requires an understanding of spectral data and physical properties of the Earth and atmosphere. It also often requires calibration against data collected on the Earth’s surface or in the atmosphere directly – data from sensors that are in-situ, rather than “remote”.
 requires an understanding of spectral data and physical properties of the Earth and atmosphere. It also often requires calibration against data collected on the Earth’s surface or in the atmosphere directly – data from sensors that are in-situ, rather than remote ..")
4
zd

5
asdf

7
Spectroradiometry

8
NASA / USGS LandSat 8 The NASA / USGS LandSat program was launched in 1972 and was the first Earth observation satellite not designed for military use. The current satellite, LandSat 8, was launched in 2013. LandSat 8 has two main instruments, the Operational Land Imager (visible, near IR and short wave IR) and the Thermal Infrared Sensor (thermal IR). LandSat 8 covers every point on Earth every 16 days, and has a resolution of 15-100 meters. TIRS was added to the LandSat 8 mission “when it became clear that state water resource managers rely on the highly accurate measurements of Earth's thermal energy obtained by LDCM's predecessors, Landsat 5 and Landsat 7, to track how land and water are being used. With nearly 80 percent of the fresh water in the Western U.S. being used to irrigate crops, TIRS will become an invaluable tool for managing water consumption.” TIRS Spectral Bands Spectral BandWavelengthResolution Band 10 - Long Wavelength Infrared10.30 - 11.30 µm100 m Band 11 - Long Wavelength Infrared11.50 - 12.50 µm100 m
 and the Thermal Infrared Sensor (thermal IR). LandSat 8 covers every point on Earth every 16 days, and has a resolution of meters. TIRS was added to the LandSat 8 mission when it became clear that state water resource managers rely on the highly accurate measurements of Earth s thermal energy obtained by LDCM s predecessors, Landsat 5 and Landsat 7, to track how land and water are being used. With nearly 80 percent of the fresh water in the Western U.S. being used to irrigate crops, TIRS will become an invaluable tool for managing water consumption. TIRS Spectral Bands Spectral BandWavelengthResolution Band 10 - Long Wavelength Infrared µm100 m Band 11 - Long Wavelength Infrared µm100 m.")
9
Spectroradiometry

10
Global Mean Surface Temperature Daily Variation Seasonal Variation Epoch Variation?

11
Signal Decomposition Fourier Series Parametric model for surface temperature variation decomposition – Where Y(t) is the at-satellite brightness temperature, – A(t) is diurnal (daily) variations and annual variations – B(t) is linear trend in temperature – Where the coefficients a kn and b lm are complex and a 00 and b 00 are real numbers. K and L are the number of Fourier harmonics for the diurnal cycle (period H = 1 day), whereas N and M correspond to the seasonal cycle (period T = 1 year).
, whereas N and M correspond to the seasonal cycle (period T = 1 year)..")
12
Numerical Derivation of Fourier Series Consider only daily variation in a week of data Fourier regression in Microsoft Excel

13
Fig. 3. (A) Bias-corrected globally averaged daily mean (pentad-averaged) satellite observed tropospheric temperatures (circles) and climatic trend (a00 + b00t) in annual averages (thick line). K Y Vinnikov, and N C Grody Science 2003;302:269-272 Published by AAAS
 Bias-corrected globally averaged daily mean (pentad-averaged) satellite observed tropospheric temperatures (circles) and climatic trend (a00 + b00t) in annual averages (thick line). K Y Vinnikov, and N C Grody Science 2003;302: Published by AAAS.")
14
From At-Satellite Brightness Temperature to Land Surface Temperature – Planck blackbody function Brightness temperature – Matches intensity of a blackbody Emissivity – fraction of energy emitted compared to a blackbody λ = wavelength of emitted radiance p = h * c / s (1.438 * 10^-2 m K) h = Planck’s constant (6.626 * 10^-34 Js) s = Boltzmann constant (1.38 * 10^-23 J/K) c = velocity of light (2.998 * 10^8 m/s)
 h = Planck’s constant (6.626 * 10^-34 Js) s = Boltzmann constant (1.38 * 10^-23 J/K) c = velocity of light (2.998 * 10^8 m/s)")
15
Analyzing spatial data Many products exist for analyzing geospatial data Software used predominately for remotely sensed image processing – ex. ENVI, Erdas Imagine Software used for broader geospatial needs – ex. Esri’s ArcGIS, QGIS “GIS” = Geographic Information System – Combines geographic, or spatial, and attribute data for endless purposes – Usually includes some type of cartography (visual representation of data) output
 output.")
16
QGIS “Quantum Geographic Information System” Open-source, free Can run on multiple operating systems First version released in 2002; Newest version (2.6) released November 2014; constantly updated (39 versions in 12 years) Great online resources, tutorials, and community – http://docs.qgis.org/2.6/en/docs/gentle_gis_introduction/ introducing_gis.html http://docs.qgis.org/2.6/en/docs/gentle_gis_introduction/ introducing_gis.html – http://docs.qgis.org/2.6/en/docs/training_manual/ http://docs.qgis.org/2.6/en/docs/training_manual/ – http://gis.stackexchange.com http://gis.stackexchange.com
 released November 2014; constantly updated (39 versions in 12 years) Great online resources, tutorials, and community – introducing_gis.html introducing_gis.html – –")
17
Vector vs Raster vector data: A representation of the world using points, lines, and polygons. Vector models are useful for storing data that has discrete boundaries, such as country borders, land parcels, and streets. raster data: A representation of the world as a surface divided into a regular grid of cells. Raster models are useful for storing data that varies continuously, as in an aerial photograph, a satellite image, a surface of chemical concentrations, or an elevation surface.

18
Coordinate Reference System Map projections try to portray the surface of the earth or a portion of the earth on a flat piece of paper or computer screen. A coordinate reference system (CRS) then defines, with the help of coordinates, how the two-dimensional, projected map in your GIS is related to real places on the earth. The decision as to which map projection and coordinate reference system to use, depends on the regional extent of the area you want to work in, on the analysis you want to do and often on the availability of data.
 then defines, with the help of coordinates, how the two-dimensional, projected map in your GIS is related to real places on the earth. The decision as to which map projection and coordinate reference system to use, depends on the regional extent of the area you want to work in, on the analysis you want to do and often on the availability of data..")
Similar presentations