Download presentation
Presentation is loading. Please wait.

2
Naturalistic Driving Assessments of Driver Distraction and Fatigue Presented by: Thomas A. Dingus, Ph.D., CHFP Director Virginia Tech Transportation Institute Newport News Shipbuilding Professor of Engineering Virginia Tech University

3
First on-road assessment of in-vehicle navigation: 1984

4
Overview: VTTI Research Centers Research Collaborations Transportation Policy Group Ray Pethtel, Leader (Outreach) Center for Injury Biomechanics Warren Hardy, Director (ME) Virginia Institute for Performance Engineering and Research Steve Southward, Director (ME) Research Centers Center for Automotive Safety Research Jon Hankey, Director Center for Infrastructure Safety Ron Gibbons, Director Center for Truck and Bus Safety Rich Hanowski, Director Center for Sustainable Mobility Hesham Rakha, Director Center for Product Development Mike Mollenhauer, Director Center for Technology Development Andy Petersen, Director Center for Sustainable Roadway Infrastructure Gerardo Flintsch, Director Center for Infrastructure Sensing Technology Linbing Wang, Director
 Center for Injury Biomechanics Warren Hardy, Director (ME) Virginia Institute for Performance Engineering and Research Steve Southward, Director (ME) Research Centers Center for Automotive Safety Research Jon Hankey, Director Center for Infrastructure Safety Ron Gibbons, Director Center for Truck and Bus Safety Rich Hanowski, Director Center for Sustainable Mobility Hesham Rakha, Director Center for Product Development Mike Mollenhauer, Director Center for Technology Development Andy Petersen, Director Center for Sustainable Roadway Infrastructure Gerardo Flintsch, Director Center for Infrastructure Sensing Technology Linbing Wang, Director")
6
VT/VTTI Facts VT is a larger US university: Approximately 30,000 students VT has the 8 th largest college of engineering in the US: 350 faculty VTTI is VT’s largest research enterprises – Almost 350 faculty, staff and students/over 70 projects – Large supporter of both undergraduate and graduate students (100-120 depending on time of year) VTTI has grown to become the 2 nd largest U.S. Transportation Research Institute We believe that VTTI has the largest group of driving safety researchers in the world (approximately 200)
.")
7
Research Impact VTTI conducts research that has a measurable impact on US National Transportation Policy – Driver distraction – Truck driver fatigue – Connected vehicle safety apps – Night visibility enhancement – Intersection crash avoidance – Teen driving safety – Evaluation of ITS technologies – Evaluation of in-vehicle systems – Transportation policy effects

8
Data Acquisition System 7

10
Data Acquisition System Overview Multiple Videos Machine Vision – Eyes Forward Monitor – Lane Tracker – Driver ID (post hoc) Accelerometer Data (3 axis) Rate Sensors (3 axis) GPS – Latitude, Longitude, Elevation, Time, Velocity Forward Radar – X and Y positions – X and Y Velocities Cell Phone – ACN, health checks, location notification – Health checks, remote upgrades Illuminance sensor Infrared illumination Passive alcohol sensor Incident push button – Audio (only on incident push button) Turn signals Vehicle network data – Accelerator – Brake pedal activation – ABS – Gear position – Steering wheel angle – Speed – Horn – Seat Belt Information – Airbag deployment – Many more variables… 9
 Accelerometer Data (3 axis) Rate Sensors (3 axis) GPS – Latitude, Longitude, Elevation, Time, Velocity Forward Radar – X and Y positions – X and Y Velocities Cell Phone – ACN, health checks, location notification – Health checks, remote upgrades Illuminance sensor Infrared illumination Passive alcohol sensor Incident push button – Audio (only on incident push button) Turn signals Vehicle network data – Accelerator – Brake pedal activation – ABS – Gear position – Steering wheel angle – Speed – Horn – Seat Belt Information – Airbag deployment – Many more variables… 9")
11
Camera Image Samples 15 Hz continuous video 640x320 pixels Center stack – Pedal Interactions Forward View - color Right-Rear View Driver Face – Rotated for max pixel efficiency Periodic still cabin image, permanently blurred for passenger anonymity 10

12
Accelerometer & Rate Sensors Acceleration (buffered @ 500 Hz for incident recording; 10 Hz continuous) – Lateral – Longitudinal – Vertical Gyro yaw rate (buffered @ 100 Hz for incident recording; 10 Hz continuous) 11
 – Lateral – Longitudinal – Vertical Gyro yaw rate 100 Hz for incident recording; 10 Hz continuous) 11")
13
Forward Radar (10 – 20 Hz) Minimum of 5 objects tracked – Target vehicle range – Target vehicle range rate – Target vehicle orientation relative to participating vehicle – Track type 12
 Minimum of 5 objects tracked – Target vehicle range – Target vehicle range rate – Target vehicle orientation relative to participating vehicle – Track type 12")
14
GPS (1 Hz) GPS time Latitude Longitude Altitude Velocity (X, Y, Z) Status (number of satellites being tracked) 13
 GPS time Latitude Longitude Altitude Velocity (X, Y, Z) Status (number of satellites being tracked) 13")
15
VTTI Machine Vision Lane Tracking:

17
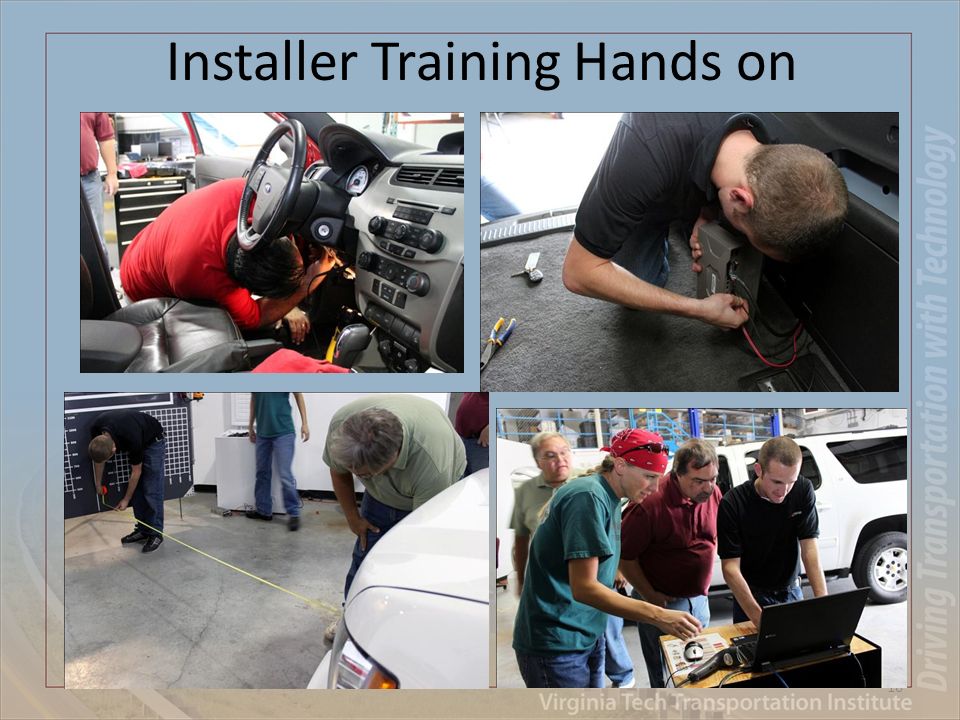
Installer Training Hands on 16

18
Installation Support Software 17

19
Installation Support Software 18

20
MCS Participant Dashboard 19

21
VTTI Instrumentation 2010: The future is here.... – Driver behavior monitoring provides proactive data for risk assessment, driver coaching and remediation – Lane / roadway departure system provides real time warnings for impending departure – Forward collision warning provides real time warnings for impending crashes – Drowsy driver monitor provides real time feedback about driver alertness – Driver attention monitor provides inputs to the system as to whether the driver is attending to the driving environment – Passive alcohol sensing provides an indication of possible impairment – Flexibility for research applications allows up to 6 cameras and additional sensors – All of the above in a single device at an order of magnitude lower cost than just a few years ago Main Processing Unit Driver Behavior Monitor Lane / Roadway Departure Warning Forward Crash Warning Drowsy Driver Monitor and Warning Driver Attention Monitor Indirect Vision System

22
A New Method of Study: Naturalistic Driving Studies of Crash/Near Crash Risk

23
Why develop a new methodology? Human performance and behavior contribute to over 90% of vehicular crashes. A subset of these behaviors create the majority of the crash risk. – impairment (primarily alcohol) – inattention and distraction – drowsiness – judgment-related error Current methods of studying driver performance/ behavior and their safety impacts have limitations. – Frequency of use, conditions of use, and factors in the larger context of driving are key elements of risk which are not observable. – Detailed pre-crash information is not available from crash databases.
 – inattention and distraction – drowsiness – judgment-related error Current methods of studying driver performance/ behavior and their safety impacts have limitations. – Frequency of use, conditions of use, and factors in the larger context of driving are key elements of risk which are not observable. – Detailed pre-crash information is not available from crash databases..")
24
Why Monitor Drivers Directly? To Supplement Police Accident Reports and other Data Well meaning, nominally trained police officers coming upon a scene is the source of much of our data Vehicles have often been moved Drivers/Passengers may be deceased or injured Drivers/Passenger are almost always dazed Pre-crash events happen so fast key elements are forgotten by driver/passenger and left out by witnesses Drivers are often trying to avoid prosecution or embarrassment

25
Driving Safety Research Approaches Epidemiological Studies PARs Simulation Test Track Lab Experiment Missing Piece? 24 NDS

26
Overview of Light Vehicle NDS at VTTI 25 VTTI NDS 40 Teen Older Driver 100 Car Motorcycle SHRP 2

27
In these studies, drivers are not given any instructions and often there are also no specific evaluations. Studies capture a large number of crash events, there has yet to be a single study large enough to capture a statistically significant number of crashes. To overcome this limitation several studies have utilized “near crashes” in combination with crashes. Near crashes, in this case, are defined as having all of the elements of a crash with the exception that the driver implements a successful evasive maneuver.

28
Since the success of an evasive maneuver depends upon factors such as timing and skill, it has been hypothesized that near crashes are predictive of crashes. Several studies over the past 15 years have used near crashes as safety surrogates. The 100 Car Study showed that near crash involvement is correlated with crash involvement across differing drivers There is a growing body of evidence that combining crash and near crash events provides a valid measure of overall crash risk.

29
Event Pyramid Crashes Near Crashes Safety-Related Incidents 28 x10

30
Analysis Approach Data analyses were conducted utilizing the “100 car”, 40 teen and several heavy truck naturalistic driving databases. These data were specifically analyzed for the purpose of assessing relative crash/near crash risk. From these data, an “event” database of crashes and near crashes was created with over 1,000 crashes, minor collisions and near crashes. These data were also used to develop a “non-event” or baseline database to assess exposure.

31
VT High Performance Computing Center: 1.0 Petabytes + 100 Teraflops dedicated to VTTI

32
Odds Ratios 31 ExposureNon-Exposure Crash AB Baseline CD Point Estimate Odds Ratio E = (A E /C E )/(B -E /D -E )
/(B -E /D -E )")
33
Key Findings 10% of drivers create roughly 50% of the crash risk. – True for both light and heavy vehicles. – Opportunity for driver monitoring for populations under administrative rule (e.g., truck drivers and teens) Distraction and inattention are greatly under estimated as a crash causal factor. However, If you are awake and looking at something you almost never hit it. – Where is cognitive distraction? Teens are involved in crashes/near crashes while distracted four times more often than adults. – A rising epidemic? Fatigue is a much larger (i.e., 20%+) crash risk problem than previously thought. – True for both light and heavy vehicles.
 Distraction and inattention are greatly under estimated as a crash causal factor. However, If you are awake and looking at something you almost never hit it. – Where is cognitive distraction. Teens are involved in crashes/near crashes while distracted four times more often than adults. – A rising epidemic. Fatigue is a much larger (i.e., 20%+) crash risk problem than previously thought. – True for both light and heavy vehicles..")
34
100 Car Study Results 33

35
95 Drivers: Worst 15 Middle 30 Best 50 10.5% 34% 55.5% 40.3% 47.4% 12.3% Exposure (Hours Driving) # of At-Fault Events
 # of At-Fault Events")
36
Inattention-Related Relative Crash/ Near Crash Risk Estimates (Odds Ratio 0-2)
")
37
Are Naturalistic Driving data on cell phone conversations inconsistent with crash data? What one would expect the crash rate to be from the growth of cell phones if conversation imposed substantial risk: Year2008 vehicle miles traveled (100 millions)29,740 number of police reported crashes (total)5,811,000 Actual rate of crashes per 100mvmt195.34 Predicted CR per 100mvmt if 10% cell and 4x254.01 Predicted CR per 100mvmt if 10% cell and 7x312.63
29,740 number of police reported crashes (total)5,811,000 Actual rate of crashes per 100mvmt Predicted CR per 100mvmt if 10% cell and 4x Predicted CR per 100mvmt if 10% cell and 7x")
39
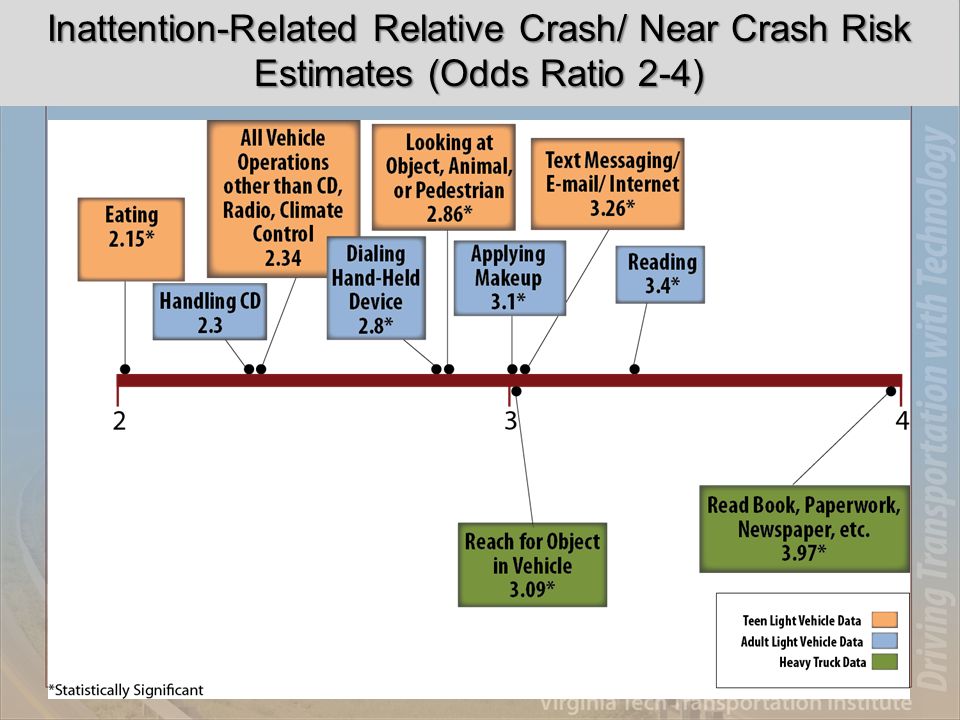
Inattention-Related Relative Crash/ Near Crash Risk Estimates (Odds Ratio 2-4)
")
40
Inattention-Related Relative Crash/ Near Crash Risk Estimates (Odds Ratio 4-6)
")
41
Inattention-Related Relative Crash/ Near Crash Risk Estimates (Odds Ratio Greater than 6)
")
42
Key Findings: What we know is NOT true Talking on a cell phone is worse than driving drunk. Since a cell phone conversation happens outside of the driving context, it is substantially more dangerous than a conversation with a passenger Truck drivers can use fully functional Mobile Data Terminals because they are highly trained professionals. – That is, no one can drive safely and type, text, read or dial “Headset” use with a conventional cell phone is significantly safer than “hand-held” use. – The primary risk of either method is manual answering, dialing, and other tasks that require eyes to be off the road.

43
Key Findings: What we know is NOT true Teens can text and drive because they are highly trained texting experts. Teens primarily have higher crash risk because they lack knowledge, skills and abilities. – Teens drive just like their parents when their parents are present. Fatigue is only a heavy truck, long trip and/or truck issue

44
Turns.57** Yaw.31* Low Rates of Elevated G-Force Event Rates With Adult Passengers Simons-Morton et al., Journal of Adolescent Health, in press

45
VTTI Results Summary Driving is a visual task and non-driving-related, visually-demanding tasks should always be avoided. – Includes hand-held cell phone texting and dialing, nomadic MP3 manipulation, and internet access, among others. Texting, typing, reading, and dialing have the potential to create a true crash epidemic as highly capable nomadic devices continue to rapidly grow in popularity. “Headset” use with a conventional cell phone is not substantially safer than “hand-held” use. – The primary risk of either method is manual answering, dialing, and other tasks that require eyes to be off the road.

46
VTTI Results Summary “True hands-free” voice activated systems are less risky. – Must be designed well enough so the driver does not have to divert visual attention away from the driving task for long periods. Teens engage in complex, non-driving tasks much more frequently, and in riskier situations, than adults.

47
Recommendations A primary law banning the use of hand-held, wireless devices in a moving vehicle is required. The law should: – Preclude manual use of: Cell phones, MP3 players, Blackberry, iphone, etc., and headset use with conventional cell phones – Exclude “true-hands-free” and in-vehicle devices that are simple to operate and do not require substantial “eye-off- road time” – Carry a significant monetary fine and “points” – Include a total cell phone ban for newly-licensed teens and for special cases like school buses – Exclude emergency communications for all users

48
Recommendations A regulation limiting functionality of visually- demanding, in-vehicle devices in a moving vehicle is necessary. – Includes manual destination entry and all “keyboard” tasks – Includes all complex reading tasks Standards for testing of potentially distracting devices prior to market introduction need to be broadly applied.

49
Questions? Thanks!

Similar presentations


 939–953 Situation awareness and workload in driving while using adaptive cruise control and a.>")

![SHRP 2 Naturalistic Driving Study [Presenter’s Organization] [Presenter’s Name] [Presenter’s Title] Accelerating solutions for highway safety, renewal,](/16/4991180/big_thumb.jpg "SHRP 2 Naturalistic Driving Study [Presenter’s Organization] [Presenter’s Name] [Presenter’s Title] Accelerating solutions for highway safety, renewal,>")


 while driving. What would.>")