Download presentation
Presentation is loading. Please wait.

1
Electron Spin Resonance Spectroscopy
Dylan W. Benningfield Department of Chemistry

2
Electron Spin Resonance (ESR)
Electron paramagnetic resonance (EPR) Study of paramagnetic materials Radicals, bi-radicals, triplet states, unfilled conduction bands, transition metal ions, impurities in semi-conductors, etc. Electron spin resonance (ESR), or electron paramagnetic resonance (EPR) is a technique used to study unpaired electrons in a molecular system. Generally used to study radicals and coordination complexes. Unpaired electrons will interact with their chemical environment which produces unique spectra for different compounds
 Study of paramagnetic materials. Radicals, bi-radicals, triplet states, unfilled conduction bands, transition metal ions, impurities in semi-conductors, etc. Electron spin resonance (ESR), or electron paramagnetic resonance (EPR) is a technique used to study unpaired electrons in a molecular system. Generally used to study radicals and coordination complexes. Unpaired electrons will interact with their chemical environment which produces unique spectra for different compounds.")
3
Electron Spin Resonance (ESR)
Provides molecular structure information inaccessible by other analytical methods Stable paramagnetic species are more easily detected Electron spin resonance (ESR), or electron paramagnetic resonance (EPR) is a technique used to study unpaired electrons in a molecular system. Generally used to study radicals and coordination complexes. Unpaired electrons will interact with their chemical environment which produces unique spectra for different compounds
, or electron paramagnetic resonance (EPR) is a technique used to study unpaired electrons in a molecular system. Generally used to study radicals and coordination complexes. Unpaired electrons will interact with their chemical environment which produces unique spectra for different compounds.")
4
ESR Overview Molecules with one or more unpaired electrons
Unpaired electrons have spin and charge (magnetic moment) Electronic spin can be in one of two directions Electron spin states are initially degenerate Degeneracy lost when exposed to external magnetic field Electron spin resonance (ESR), or electron paramagnetic resonance (EPR) is a technique used to study unpaired electrons in a molecular system. Generally used to study radicals and coordination complexes. Unpaired electrons will interact with their chemical environment which produces unique spectra for different compounds
 Electronic spin can be in one of two directions. Electron spin states are initially degenerate. Degeneracy lost when exposed to external magnetic field. Electron spin resonance (ESR), or electron paramagnetic resonance (EPR) is a technique used to study unpaired electrons in a molecular system. Generally used to study radicals and coordination complexes. Unpaired electrons will interact with their chemical environment which produces unique spectra for different compounds.")
5
ESR Overview Place sample into magnetic field (B)
Irradiate sample with microwave frequencies (GHz) Scan B at constant frequency to make spectra Electron spin resonance (ESR), or electron paramagnetic resonance (EPR) is a technique used to study unpaired electrons in a molecular system. Generally used to study radicals and coordination complexes. Unpaired electrons will interact with their chemical environment which produces unique spectra for different compounds
 Scan B at constant frequency to make spectra. Electron spin resonance (ESR), or electron paramagnetic resonance (EPR) is a technique used to study unpaired electrons in a molecular system. Generally used to study radicals and coordination complexes. Unpaired electrons will interact with their chemical environment which produces unique spectra for different compounds")
6
ESR Overview Microwave source and detector
Modulation of magnetic field and phase-sensitive detection Spectrum of 1st derivative (shown below) Electron spin resonance (ESR), or electron paramagnetic resonance (EPR) is a technique used to study unpaired electrons in a molecular system. Generally used to study radicals and coordination complexes. Unpaired electrons will interact with their chemical environment which produces unique spectra for different compounds
 Electron spin resonance (ESR), or electron paramagnetic resonance (EPR) is a technique used to study unpaired electrons in a molecular system. Generally used to study radicals and coordination complexes. Unpaired electrons will interact with their chemical environment which produces unique spectra for different compounds.")
7
ESR Theory g-value (𝑔) ≈ chemical shift
𝑔 𝑒 = for a free electron Generally 𝑔 = “Resonance” occurs when microwave frequency (GHz) = ∆E Electron spin resonance (ESR), or electron paramagnetic resonance (EPR) is a technique used to study unpaired electrons in a molecular system. Generally used to study radicals and coordination complexes. Unpaired electrons will interact with their chemical environment which produces unique spectra for different compounds
 = ∆E. Electron spin resonance (ESR), or electron paramagnetic resonance (EPR) is a technique used to study unpaired electrons in a molecular system. Generally used to study radicals and coordination complexes. Unpaired electrons will interact with their chemical environment which produces unique spectra for different compounds.")
8
Energy Levels ∆𝐸= 𝐸 + − 𝐸 − =ℎ𝑣=𝑔 𝜇 𝐵 𝐵
𝑔= ℎ𝑣 𝜇 𝐵 𝐵 = 𝑣(𝐺𝐻𝑧) 𝐵(𝑚𝑇) g is the g-value 𝜇 𝐵 is the Bohr magneton (9.274 x 10 −28 J/G) B is the magnetic field strength (G = 1x 10 −1 mT)
 𝐵(𝑚𝑇) g is the g-value. 𝜇 𝐵 is the Bohr magneton (9.274 x 10 −28 J/G) B is the magnetic field strength (G = 1x 10 −1 mT)")
9
Absorption

10
Microwaves and Waveguides
Energy in the microwave region Microwaves handled with a waveguide Several types of waveguides The energy level required for electron transitions is in the microwave region. Microwaves are usually handled with a waveguide which are constructed on the order of size of the microwaves they are transporting. There are several types of waveguides that are used, but X-band are the most common with a size for cm. Free electron resonances is found around 3390 G Using an X-band waveguide.

11
X-band Waveguide X-band waveguides most common Size = 3.0-3.3 cm
Free electron resonance ≈ 3390 G The energy level required for electron transitions is in the microwave region. Microwaves are usually handled with a waveguide which are constructed on the order of size of the microwaves they are transporting. There are several types of waveguides that are used, but X-band are the most common with a size for cm. Free electron resonances is found around 3390 G Using an X-band waveguide.

12
Alternative Waveguide
Fun fact: the waveguide letters are randomized, b/c in WW2 they were used as code to denote which radio freq they were using to try to detect incoming bombers. The first observation of epr resonance was done with S-band.

13
𝑁 + 𝑁 − = 𝑒 − ∆𝐸 𝑘 𝐵 𝑇 = 𝑒 − ℎ𝑣 𝑘 𝐵 𝑇 = 𝑒 − 𝑔 𝜇 𝐵 𝐵 𝑘 𝐵 𝑇
Sensitivity ESR focuses on absorption of photons by the sample Net Absorption ( 𝑁 − − 𝑁 + ) can be found using the Boltzmann distribution seen below: 𝑁 + 𝑁 − = 𝑒 − ∆𝐸 𝑘 𝐵 𝑇 = 𝑒 − ℎ𝑣 𝑘 𝐵 𝑇 = 𝑒 − 𝑔 𝜇 𝐵 𝐵 𝑘 𝐵 𝑇
 can be found using the Boltzmann distribution seen below: 𝑁 + 𝑁 − = 𝑒 − ∆𝐸 𝑘 𝐵 𝑇 = 𝑒 − ℎ𝑣 𝑘 𝐵 𝑇 = 𝑒 − 𝑔 𝜇 𝐵 𝐵 𝑘 𝐵 𝑇.")
14
𝑁 − − 𝑁 + = 𝑁 − 1− 1− 𝑔 𝜇 𝐵 𝐵 𝑘 𝐵 𝑇 = 𝑁𝑔 𝜇 𝐵 𝐵 2 𝑘 𝐵 𝑇
Sensitivity For most commonly used temperatures and magnetic fields, the exponent is very small and can be approximated as the following: 𝑒 − 𝑔 𝜇 𝐵 𝐵 𝑘 𝐵 𝑇 ≈1− 𝑔 𝜇 𝐵 𝐵 𝑘 𝐵 𝑇 This allows for the following simplification for 𝑁 − − 𝑁 + : 𝑁 − − 𝑁 + = 𝑁 − 1− 1− 𝑔 𝜇 𝐵 𝐵 𝑘 𝐵 𝑇 = 𝑁𝑔 𝜇 𝐵 𝐵 2 𝑘 𝐵 𝑇

15
𝑁 − − 𝑁 + = 𝑁 − 1− 1− 𝑔 𝜇 𝑔 𝐵 𝑘 𝐵 𝑇 = 𝑁𝑔 𝜇 𝐵 𝐵 2 𝑘 𝐵 𝑇
Sensitivity 𝑁 − − 𝑁 + = 𝑁 − 1− 1− 𝑔 𝜇 𝑔 𝐵 𝑘 𝐵 𝑇 = 𝑁𝑔 𝜇 𝐵 𝐵 2 𝑘 𝐵 𝑇 This equations shows that ESR sensitivity (net absorption) increases with magnetic field strength and decreasing temperature
 increases with magnetic field strength and decreasing temperature.")
16
Saturation Spin-lattice Relaxation
Instead of simply raising in energy and then releasing it, the excited state becomes “full” at which point the intensity of absorption is lessened. This is related to relaxation times. Molecules with short relaxation times will not become saturated as easily. This is the reason that it is better to use certain frequencies for different samples.

17
Saturation Instrument must be temperature controlled
Instead of simply raising in energy and then releasing it, the excited state becomes “full” at which point the intensity of absorption is lessened. This is related to relaxation times. Molecules with short relaxation times will not become saturated as easily. This is the reason that it is better to use certain frequencies for different samples.

18
ESR Instrumentation An ESR Spectrometer have 6 main parts:
Klystron Tube (microwave generator) Attenuator Circulator Load Sample Cavity Diode Detector with μ-Ammeter
 Attenuator. Circulator. Load. Sample Cavity. Diode Detector with μ-Ammeter.")
19
ESR Instrumentation Kystron tube will generate microwaves. The Attenuator adjusts the power of the microwaves to the desired level. The circulator routes the microwaves into the correct path so that they go toward the cavity. The microwaves being reflected from the cavity (less power if sample absorbs) will be sent to the diode detector. Any microwave reflect from the detector will be fully absorbed by the load.
 will be sent to the diode detector. Any microwave reflect from the detector will be fully absorbed by the load.")
20
ESR Instrumentation Kystron tube will generate microwaves. The Attenuator adjusts the power of the microwaves to the desired level. The circulator routes the microwaves into the correct path so that they go toward the cavity. The microwaves being reflected from the cavity (less power if sample absorbs) will be sent to the diode detector. Any microwave reflect from the detector will be fully absorbed by the load.
 will be sent to the diode detector. Any microwave reflect from the detector will be fully absorbed by the load.")
21
Klystron Tube Reflector electrode Anode Electron pathway Heated
Filament Cathode The anode distance is a coarse adjustment and changing the voltage is the fine adjustment for the wavelength of the microwaves produced

22
Klystron Tube λ of the microwave = sample cavity size.
Anode = coarse correction for the λ of the microwave. Voltage = fine correction for the λ of the microwave When preparing a Klystron tube, the λ of the microwave needs to equal the sample cavity size. The anode plate of the Klystron tube can be moved as a coarse correction for the λ of the microwave. The voltage ran through the tube is used as the fine correction for the λ of the microwave

23
ESR Instrumentation Kystron tube will generate microwaves. The Attenuator adjusts the power of the microwaves to the desired level. The circulator routes the microwaves into the correct path so that they go toward the cavity. The microwaves being reflected from the cavity (less power if sample absorbs) will be sent to the diode detector. Any microwave reflect from the detector will be fully absorbed by the load.
 will be sent to the diode detector. Any microwave reflect from the detector will be fully absorbed by the load.")
24
Attenuator The attenuator homogenizes the power of the incoming microwaves Does not change frequency Reduces noise

25
ESR Instrumentation Kystron tube will generate microwaves. The Attenuator adjusts the power of the microwaves to the desired level. The circulator routes the microwaves into the correct path so that they go toward the cavity. The microwaves being reflected from the cavity (less power if sample absorbs) will be sent to the diode detector. Any microwave reflect from the detector will be fully absorbed by the load.
 will be sent to the diode detector. Any microwave reflect from the detector will be fully absorbed by the load.")
26
Circulator The circulator is used to direct the microwaves
Keeps microwaves from reflecting back towards the source

27
ESR Instrumentation Kystron tube will generate microwaves. The Attenuator adjusts the power of the microwaves to the desired level. The circulator routes the microwaves into the correct path so that they go toward the cavity. The microwaves being reflected from the cavity (less power if sample absorbs) will be sent to the diode detector. Any microwave reflect from the detector will be fully absorbed by the load.
 will be sent to the diode detector. Any microwave reflect from the detector will be fully absorbed by the load.")
28
Load Completely absorb any reflected microwaves
Turns microwaves to heat energy

29
ESR Instrumentation Kystron tube will generate microwaves. The Attenuator adjusts the power of the microwaves to the desired level. The circulator routes the microwaves into the correct path so that they go toward the cavity. The microwaves being reflected from the cavity (less power if sample absorbs) will be sent to the diode detector. Any microwave reflect from the detector will be fully absorbed by the load.
 will be sent to the diode detector. Any microwave reflect from the detector will be fully absorbed by the load.")
30
Sample Cavity An oscillating magnetic field is super-imposed on the d.c. Adds a.c. component in the diode current An oscillating magnetic field is super-imposed on the d.c. field by means of small coils, usually built into the sample cavity walls. When the field is in the vicinity of a resonance line, it is swept back and forth through part of the line, leading to an a.c. component in the diode current

31
ESR Instrumentation

32
ESR Instrumentation

33
𝒗 Resonance 𝑄= (𝑣 𝑟𝑒𝑠 )/(∆𝑣)
An oscillating magnetic field is super-imposed on the d.c. field by means of small coils, usually built into the sample cavity walls. When the field is in the vicinity of a resonance line, it is swept back and forth through part of the line, leading to an a.c. component in the diode current 𝑄= (𝑣 𝑟𝑒𝑠 )/(∆𝑣)
/(∆𝑣)")
34
ESR Instrumentation Kystron tube will generate microwaves. The Attenuator adjusts the power of the microwaves to the desired level. The circulator routes the microwaves into the correct path so that they go toward the cavity. The microwaves being reflected from the cavity (less power if sample absorbs) will be sent to the diode detector. Any microwave reflect from the detector will be fully absorbed by the load.
 will be sent to the diode detector. Any microwave reflect from the detector will be fully absorbed by the load.")
35
Diode Detector and μ-Ammeter
Current is proportional to microwave power reflected from the sample cavity Plain d.c. measurements have too much noise a.c. component is added in the sample cavity The diode detector is mounted along the E-vector of the plane-polarized microwaves. This produces a current that is proportional to the microwave power reflected from the sample cavity. However, the plain d.c. measurement has too much noise to be useful on its own. In order to compensate for this, there is an a.c. component is added with the modification of the sample cavity

36
ESR Instrumentation

37
ESR Spectra This a.c. component is amplified using a frequency selective amplifier Modulation amplitude is less than the line width Detected a.c. signal is proportional to the change in sample absorption This a.c. component is amplified using a frequency selective amplifier, thus eliminating a great deal of noise. The modulation amplitude is normally less than the line width. Thus the detected a.c. signal is proportional to the change in sample absorption.

38
ESR Spectra Absorbance = Too Noisy
1st derivative = better apparent resolution 2nd derivative = even better resolution, but less sensitive The spectrum can also be shown using the 2nd derivative. But the more time the data is differentiated, the lower the sensitivity. Only 1st and 2nd derivative plots are commonly used to analyze the spectra

39
Coalescence Similar to NMR, ESR signals can coalesce at higher temperatures Some compounds have to be run at lower temperatures (or higher field strength) in order to see all of the necessary details in the chromatogram
 in order to see all of the necessary details in the chromatogram.")
40
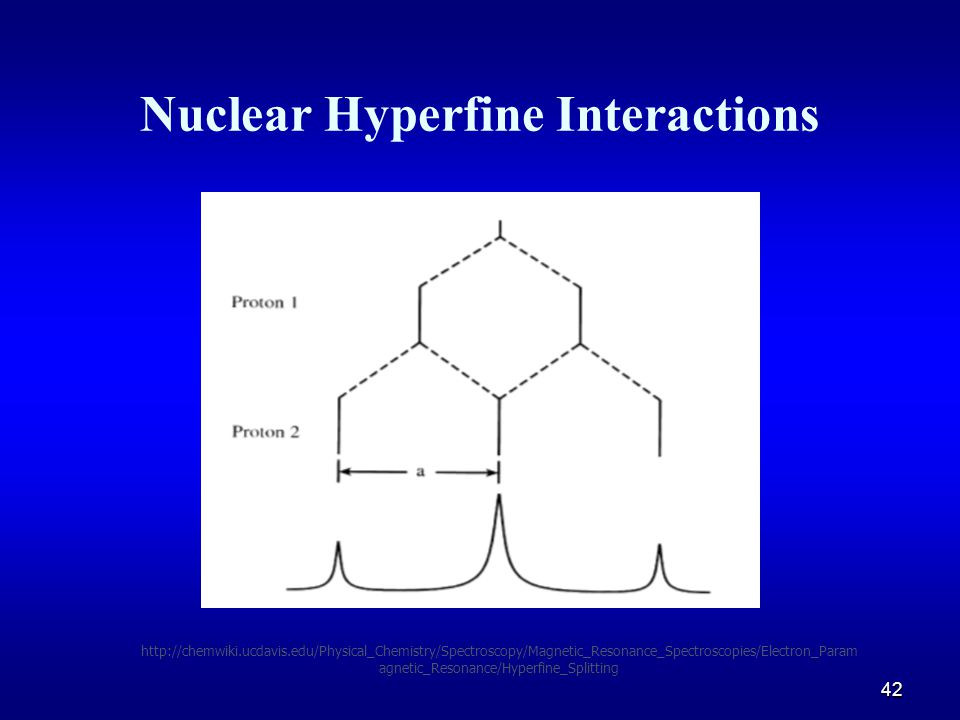
Nuclear Hyperfine Interactions
Hyperfine coupling is caused by the interaction between the magnetic moments arising from the spins of both the nucleus and electrons in atoms. As shown in Figure 1, in a single electron system the electron with its own magnetic moment moves within the magnetic dipole field of the nucleus. B is magnetic field, μ is dipole moment, ‘N’ refers to the nucleus, ‘e’ refers to the electron:

41
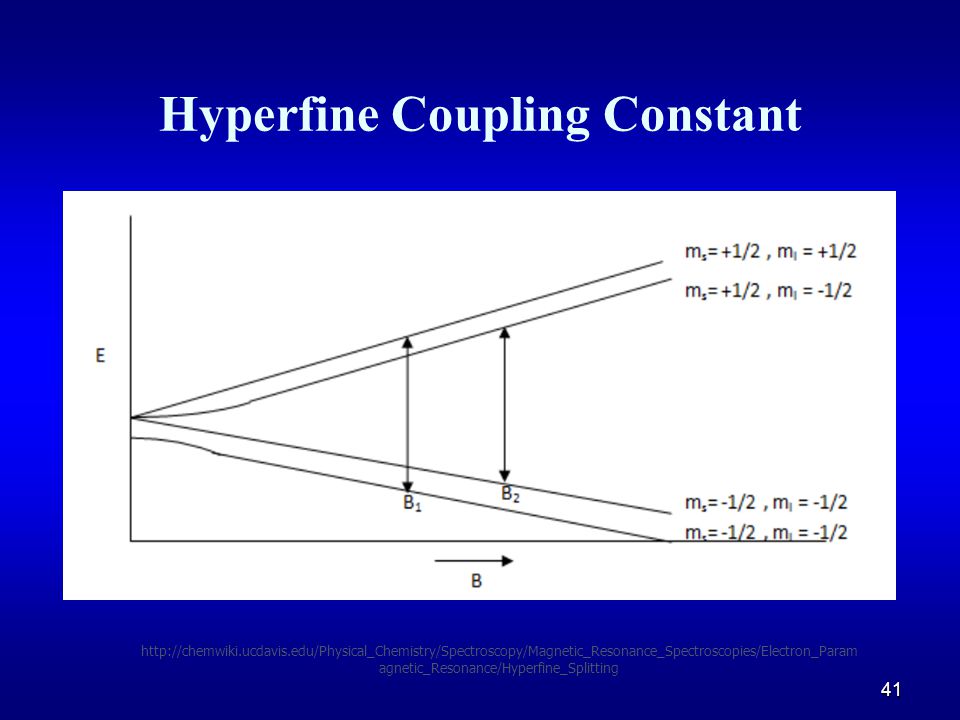
Hyperfine Coupling Constant
42
Nuclear Hyperfine Interactions
43
Nuclear Hyperfine Interactions
It is important to note that the spacing between peaks is 'a', the hyperfine coupling constant. This constant is equivalent for both protons in the equivalent system but unequal for the unequivalent protons.

44
Nuclear Hyperfine Interactions
𝐵 1 = ℎ𝑣− 𝑎 2 𝑔 𝜇 𝐵 𝐵 2 = ℎ𝑣+ 𝑎 2 𝑔 𝜇 𝐵 B = field strength a = hyperfine coupling constant g = g-value ℎ𝑣 = frequency of radiation 𝜇 𝐵 = Bohr magneton

45
Nuclear Hyperfine Interactions
∆𝐵= 𝐵 2 − 𝐵 1 = ℎ𝑣+ 𝑎 2 𝑔 𝜇 𝐵 − ℎ𝑣− 𝑎 2 𝑔 𝜇 𝐵 𝑎= 𝑔 𝜇 𝐵 ∆𝐵 B = field strength a = hyperfine coupling constant g = g-value ℎ𝑣 = frequency of radiation 𝜇 𝐵 = Bohr magneton

46
Superhyperfine Splitting
Further splitting from hyperfine interactions Very small Due to neighboring nuclei

47
Isotropic and Anisotropic Interactions
Electron-nuclei interactions have several mechanisms, the most prevalent being Fermi contact interaction and dipole interaction. Dipole interactions occur between the magnetic moments of the nucleus and electron as an electron moves around a nucleus. However, as an electron approaches a nucleus, it has a magnetic moment associated with it. As this magnetic moment moves very close to the nucleus, the magnetic field associated with that nucleus is no longer entirely dipolar. The resulting interaction of these magnetic moments while the electron and nucleus are in contact is radically different from the dipolar interaction of the electron when it is outside the nucleus. This non-dipolar interaction of a nucleus and electron spin in contact is the Fermi contact interaction. A comparison of this is shown in Figure 6. The sum of these interactions is the overall hyperfine coupling of the system. Fermi contact interactions predominate with isotropic interactions, meaning sample orientation to the magnetic field does not affect the interaction. Due to the fact that this interaction only occurs when the electron is inside the nucleus, only electrons in the s orbital exhibit this kind of interaction. All other orbitals (p,d,f) contain a node at the nucleus and can never have an electron at that node. The hyperfine coupling constant in isotropic interactions is denoted 'a'.
 contain a node at the nucleus and can never have an electron at that node. The hyperfine coupling constant in isotropic interactions is denoted a .")
48
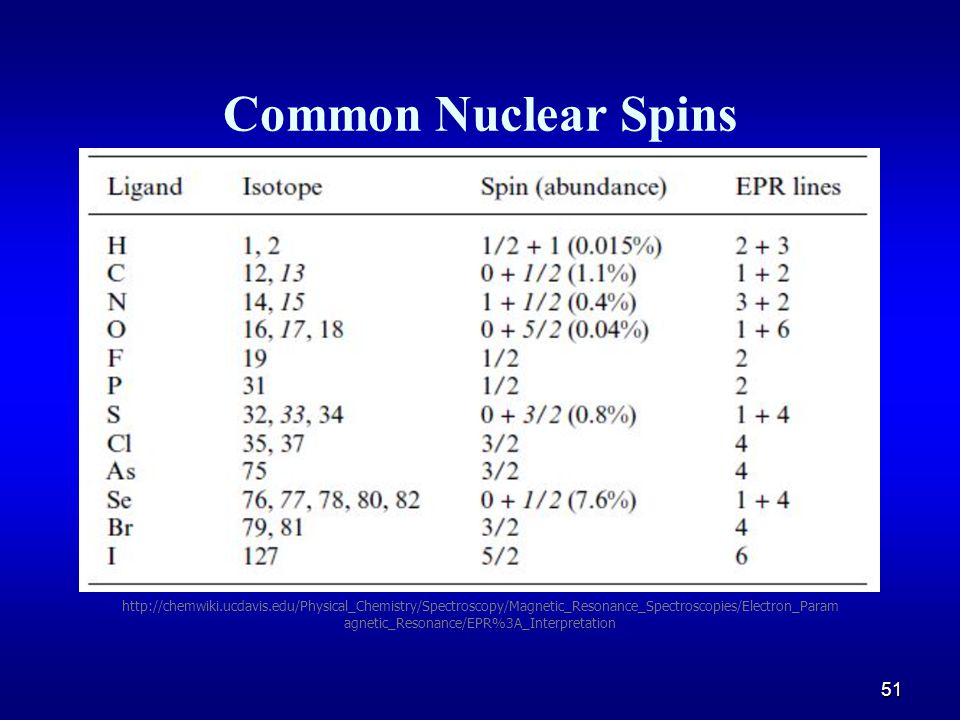
Number of Peaks For equivalent nuclei: # 𝑝𝑒𝑎𝑘𝑠=2𝑀𝐼+1
M = number of equivalent nuclei I = nuclear spin number

49
Number of Peaks For more than one set of equivalent nuclei:
# 𝑝𝑒𝑎𝑘𝑠= 2 𝑀 1 𝐼 𝑀 2 𝐼 𝑀 3 𝐼 3 +1 … M = number of equivalent nuclei I = nuclear spin number

50
Number of Peaks

51
Common Nuclear Spins
52
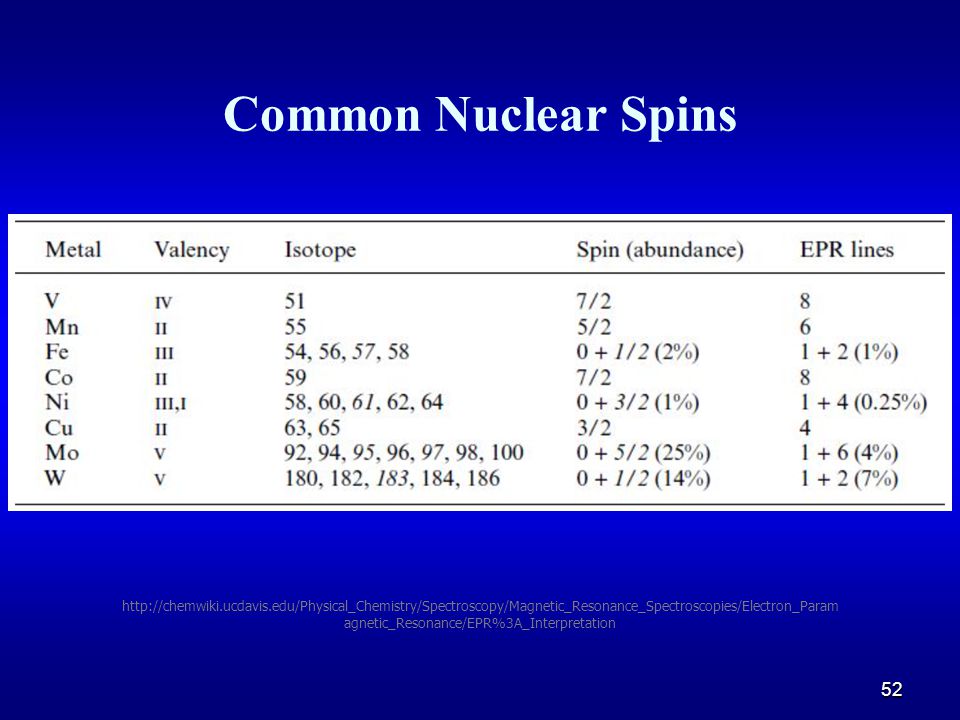
Common Nuclear Spins
53
Number of Peaks Example: radical CO2 # 𝑝𝑒𝑎𝑘𝑠=2𝑀𝐼+1
2 Oxygen, I = 3 2 # 𝑝𝑒𝑎𝑘𝑠=2𝑀𝐼+1 #𝑝𝑒𝑎𝑘𝑠=(2)(2) =7 peaks
(2) =7 peaks.")
54
Number of Peaks Example: radical NH3
1 Nitrogen, I = 1 3 Hydrogen, I = 1 2 # 𝑝𝑒𝑎𝑘𝑠=(2 𝑀 𝑁 𝐼 𝑁 +1)(2 𝑀 𝐻 𝐼 𝐻 +1) #𝑝𝑒𝑎𝑘𝑠=( )((2)(3) )=12 peaks
(2 𝑀 𝐻 𝐼 𝐻 +1) #𝑝𝑒𝑎𝑘𝑠=( )((2)(3) )=12 peaks.")
55
Practice ESR Spectra Oxygen has an I = 3 2
For compounds with equivalent nuclei, #peaks=2𝑀𝐼+1 #𝑝𝑒𝑎𝑘𝑠=(2)(2) =7 •+
(2) =7. •+")
56
Practice ESR Spectra •+ Oxygen radical
SDBSWeb : (National Institute of Advanced Industrial Science and Technology, 3/24/2015)
")
57
Practice ESR Spectra 3 H, I = 1 2 1 C, I = 0
For compounds with equivalent nuclei, #peaks=2𝑀𝐼+1 #𝑝𝑒𝑎𝑘𝑠=(2)(3) =4
(3) =4.")
58
Practice ESR Spectra Methyl radical

59
Practice ESR Spectra 2 H with I = 1 2 1 N with I = 1
(2)(2) = 3 peaks 1 N with I = 1 (1)(2) = 3 peaks For multiple sets of nuclei: # 𝑝𝑒𝑎𝑘𝑠= 2 𝑀 1 𝐼 𝑀 2 𝐼 𝑀 3 𝐼 3 +1 … Thus, there are (3)(3) = 9 total peaks
(2) = 3 peaks. 1 N with I = 1. (1)(2) = 3 peaks. For multiple sets of nuclei: # 𝑝𝑒𝑎𝑘𝑠= 2 𝑀 1 𝐼 𝑀 2 𝐼 𝑀 3 𝐼 3 +1 … Thus, there are (3)(3) = 9 total peaks.")
60
Practice ESR Spectra Acetonitrile radical
Superhyperfine splitting occurs to make a triplet of triplets. The electron is closer to the hydrogens most of the time, so that the N provides the triplet of triplet superhyperfine splitting effect. Acetonitrile radical SDBSWeb : (National Institute of Advanced Industrial Science and Technology, 3/24/2015)
")
61
Practice ESR Spectra 8 H, 2 sets of 4 equivalent nuclei
(4)(2) = 5 peaks Thus, there are (5)(5) = 25 total peaks •-
(2) = 5 peaks. Thus, there are (5)(5) = 25 total peaks. •-")
62
Practice ESR Spectra •- Naphthalene radical anion
SDBSWeb : (National Institute of Advanced Industrial Science and Technology, 3/24/2015)
")
63
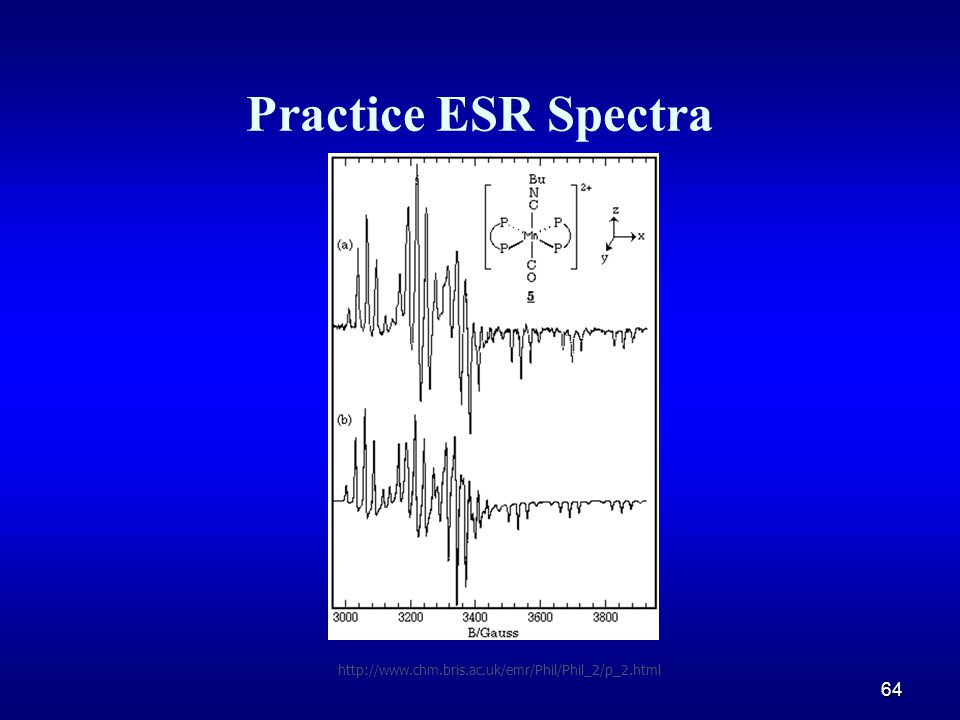
Practice ESR Spectra (a) Isotropic ESR spectrum of (Ph2C2)Co(CO)2P(OMe)3(1) in THF solution at 260 K (from reference 12); (b) Second-order "stick spectrum"; (c) First-order "stick spectrum".
 Isotropic ESR spectrum of (Ph2C2)Co(CO)2P(OMe)3(1) in THF solution at 260 K (from reference 12); (b) Second-order stick spectrum ; (c) First-order stick spectrum .")
64
Practice ESR Spectra (a) ESR spectrum of 5 in a CH2Cl2/THF glass (49); (b) Computer simulation
65
Practice ESR Spectra ESR spectrum of (Ph2C2)Co(CO)[P(OMe)3]2 (a) Experimental spectrum of THF solution at 290 K; (b and c) Computer-simulated spectra including (b) the mCoand mP linewidth dependence, and (c) the mCo linewidth dependence only.
Co(CO)[P(OMe)3]2 (a) Experimental spectrum of THF solution at 290 K; (b and c) Computer-simulated spectra including (b) the mCoand mP linewidth dependence, and (c) the mCo linewidth dependence only.")
66
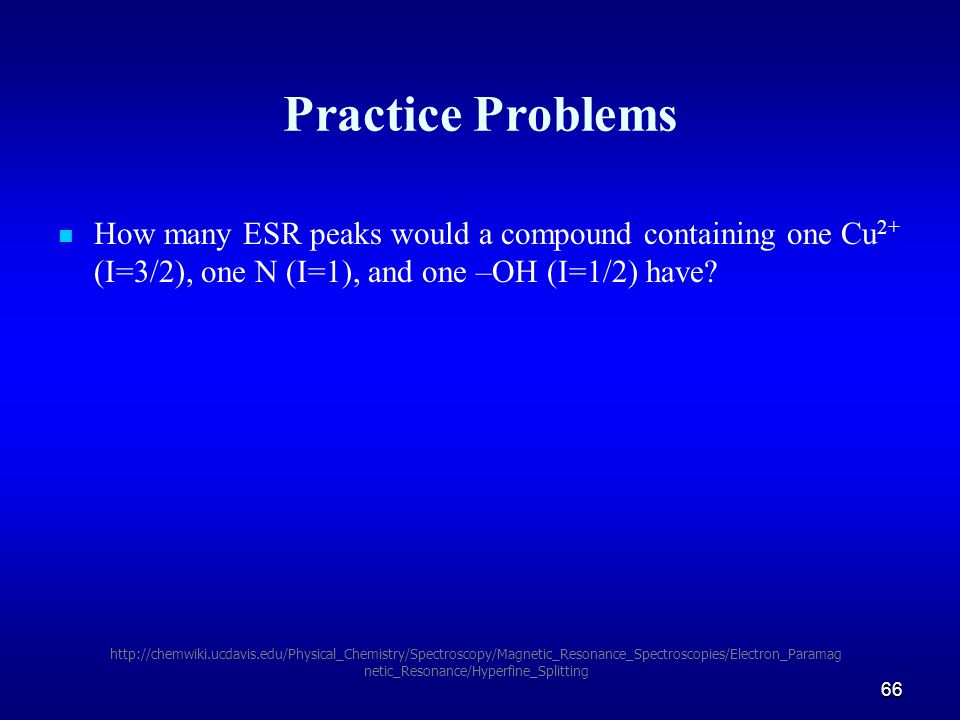
Practice Problems How many ESR peaks would a compound containing one Cu2+ (I=3/2), one N (I=1), and one –OH (I=1/2) have?
67
Practice Problems How many ESR peaks would a compound containing one Cu2+ (I=3/2), one N (I=1), and one –OH (I=1/2) have? ((2*1*3/2+1)(2*1*1+1)(2*1*1/2+1) = 24 peaks
(2*1*1+1)(2*1*1/2+1) = 24 peaks.")
68
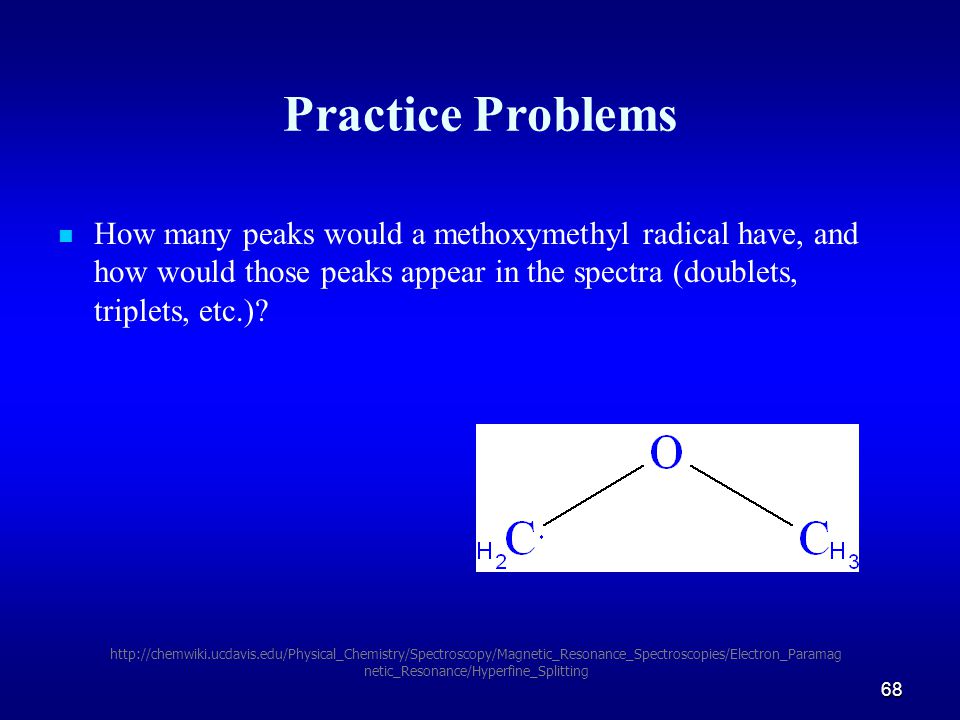
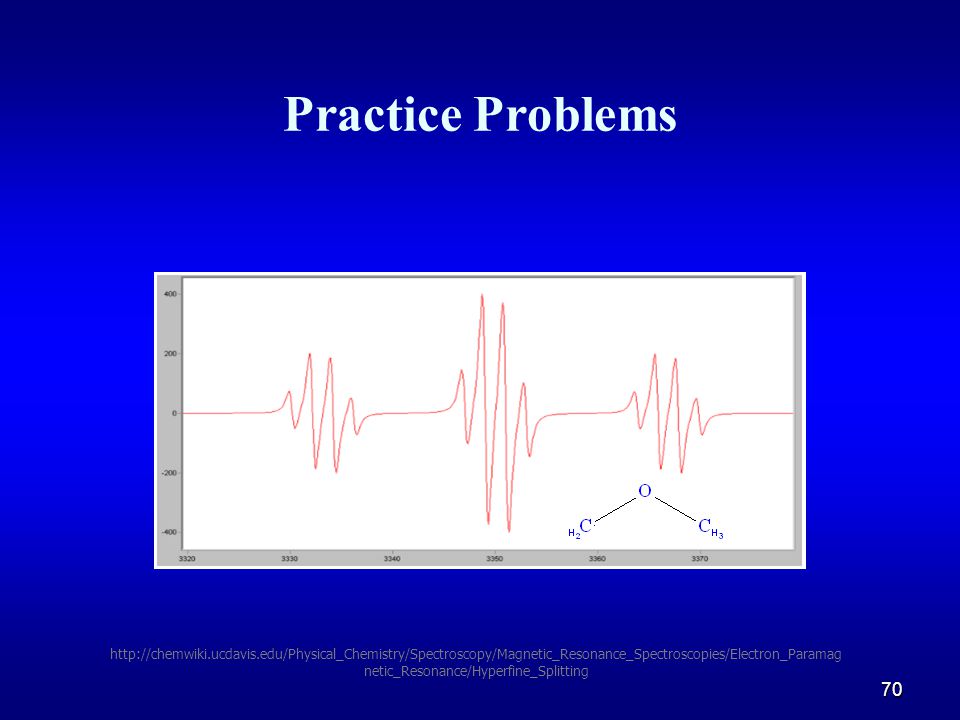
Practice Problems How many peaks would a methoxymethyl radical have, and how would those peaks appear in the spectra (doublets, triplets, etc.)?
69
Practice Problems How many peaks would a methoxymethyl radical have, and how would those peaks appear in the spectra (doublets, triplets, etc.)? 3 H and 2 H (2+1)(3+1)=12 peaks Triplet of quartets
(3+1)=12 peaks. Triplet of quartets.")
70
Practice Problems
71
Practice Problems What is the g-value corresponding to a resonance at 9000 MHz and 3700 G? 𝑔= ℎ𝑣 𝜇 𝐵 𝐵 = 𝑣(𝐺𝐻𝑧) 𝐵(𝑚𝑇) 1G = 0.1mT

72
Practice Problems What is the g-value corresponding to a resonance at 9000 MHz and 3700 G? 𝑔= ℎ𝑣 𝜇 𝐵 𝐵 = (𝐺𝐻𝑧) 370(𝑚𝑇) =1.738
 370(𝑚𝑇) =")
73
Questions?

Similar presentations


 Spectroscopy>")

 Ex) One unpaired electron: E E = h M s =>")


>")

 A photon generates both an electric and a magnetic field A current passing through a wire also generates both an electric and a magnetic.>")


 Spectroscopy>")

 for a detailed description.>")
