Download presentation
Presentation is loading. Please wait.

1
Introduction to GIS/GPS Mr. Canada World Geography Burris Laboratory School

2
KEY WORDS GIS GIS Data Spatial Data Accuracy vs. Precision Scale Projection GPS ArcGIS Online Table of Contents Layer(s) Feature(s)
 Feature(s).")
3
What is GIS? G eographic I nformation S ystem

4
GIS Explained In short: “ computerized mapping software ” GIS is a set of software and tools used to capture, store, manipulate, analyze, and display spatial data. In this class, we will explore capturing and displaying spatial data

5
Demographics

6
Environmental / Natural Disasters

7
Politics

8
Understanding GIS Data GIS represents the real world using three types of geometry : Points Lines Polygons / Areas OR cells Raster - graphic images

9
Brainstorm! What are some other examples of points, lines, and polygons?

10
What is Spatial Data? Data that has reference to a location on Earth

11
Spatial Data Components Projection : the method by which the curved 3-D surface of the earth is represented by X,Y coordinates on a 2-D flat map/screen Distortion is inevitable! Scale : the ratio of distance on a map to the equivalent distance on the ground Accuracy : how well data matches the real world Precision: reproducibility of data

12
High accuracy, low precision Low accuracy, high precision

13
Why GIS is Important GIS adds “space” to research dimensions Geographical significance & patterns Does location make any difference? i.e. Real estate – location, location, location.. Are there any patterns? i.e. Migration patterns? How did the disease spread? Geographical relationships Are A and B in this location related? i.e. Crime rate and average housing value Prediction & Information management How many people will be affected by flooding?

14
GPS Exercise Friday April 11 th and Monday April 14 th

15
What is GPS? G lobal P ositioning S ystem

16
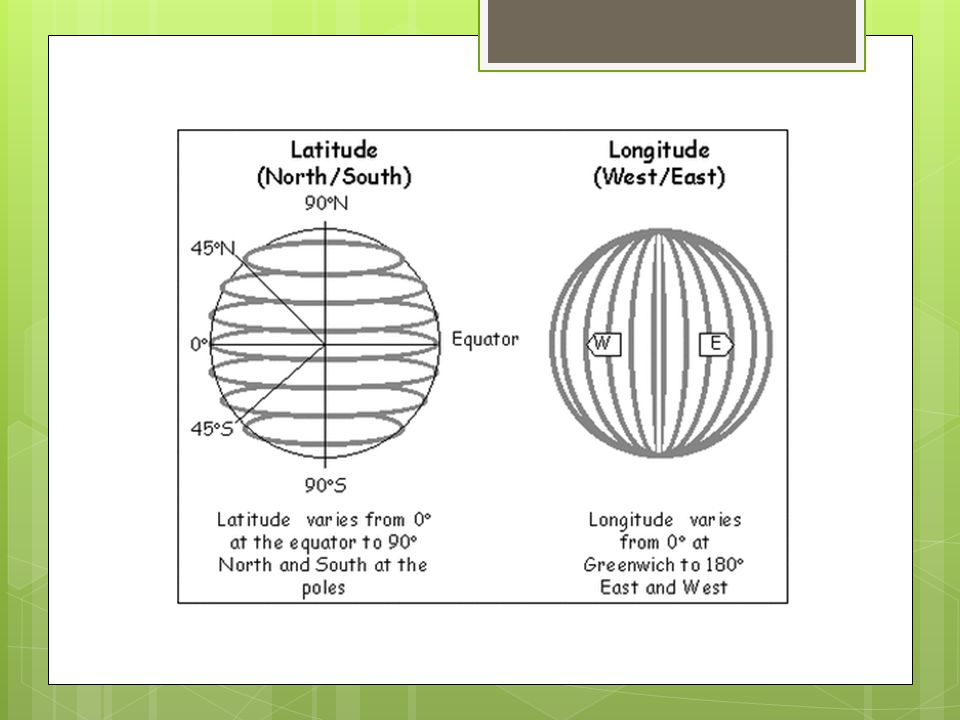
GPS Receivers Handheld devices using satellite signals to calculate location Latitude: distance North / South of the Equator 90 degrees = Poles 0 degree = Equator Longitude: distance East / West of the Prime Meridian 0 degree = Prime Meridian (Greenwich, UK) 180 degrees = International Date Line
 180 degrees = International Date Line")
18
How to Read Lat / Long Degrees, Minutes, Seconds 0 – 90 degrees North / South 0 – 180 degrees East / West 60 Minutes in a degree 60 Seconds in a minute 43°52'49'' N, 103°27'33'' W

20
Activity Description Identify locations on Ball State campus using Garmin GPS receivers, given only latitude and longitude points Coordinate points are predetermined! All locations will be south of Riverside Ave

22
Using Your Garmin “Hot” and “Cold” Watch your latitude and longitude points shift until you have reached your location

24
Directions 1. Turn on your receiver by holding down the power button on the right-hand side (you will hear a beep) 2. Use the Page button to navigate to the screen with “Speed” “Elevation” and “Location” “Location” is what you will be using *The main menu has other features! Navigate using the joystick!
 2. Use the Page button to navigate to the screen with Speed Elevation and Location Location is what you will be using *The main menu has other features. Navigate using the joystick!.")
25
Reminders We will be going outside THIS FRIDAY and NEXT MONDAY Dress accordingly for the weather Jacket if it’s cold Closed toe shoes Dates are subject to change Sign up for receivers!

26
Mapping Exercise Thursday April 17 th and Friday April 18 th

27
ArcGIS Online Web-based mapping program used to create maps, explore data, and share maps online

28
Contents of a Map Table of Contents : Area that organizes map data Layer : visual representation of a geographic dataset in any digital map environment Feature : A representation of a real-world object on a map “Place” on the map Attribute Table : A database or tabular file containing information about a set of geographic features

29
Activity Description Create a walking tour map of Ball State University in ArcGIS Online using the following criteria: Tour must begin and end at the Administration Building Major roadways may not be used, sidewalks only! Tour must be between 3 and 8 kilometers in length (hint: use the measure tool) Tour must include 3 of the featured point locations from our field day Map must be emailed to instructors to upload to class website
 Tour must include 3 of the featured point locations from our field day Map must be ed to instructors to upload to class website.")
30
Accessing ArcGIS Online BSU GIS log-on Access to all BSU GIS maps and data

31
Starting Your Map

32
Using Tools Show table Under prospective layer Measure Area, length, location Change symbols Under prospective layer

33
Saving Your Work Take a screenshot (Print Screen button) Open photo in Microsoft Paint Crop photo Save as Jpeg Attach and email Jpeg to: burrisgeography@gmail.com
 Open photo in Microsoft Paint Crop photo Save as Jpeg Attach and Jpeg to: ")
Similar presentations


? A GIS is a particular form of Information System applied to geographical.>")


 is a system designed to capture, store, manipulate, analyze, manage, and present all types of geographical.>")


 and links it with non-graphic.>")


