Download presentation
Presentation is loading. Please wait.

1
Dana Dignard RD CDE CWD Friends for Life Orlando Florida July 2010

2
Present healthy eating strategies Review Basic Carbohydrate Counting Discuss Advanced Carbohydrate Counting Review ways to improve portion estimation and carbohydrate counting when eating out Review label reading techniques How to use these tools in the REAL WORLD!

3
Children with diabetes have the same nutritional needs as children without diabetes

4
Less than 50% of participants met recommendations for fat, Vitamin E, fruit, vegetables and grains Authors felt that there was a critical need for improvement of dietary intake in youth with diabetes ** Journal of the American Dietetic Association (May 2006)
")
5
Most of the 128 participants had inadequate levels of vitamin D 24% sufficient 61%insufficient 15% deficiency ***The Journal of Pediatrics Jan 2009

7
Enjoy a variety of foods from each group every day Choose lower fat foods more often Choose whole grains and enriched products more often Choose dark green or orange vegetables and orange fruit more often Choose lower fat milk products more often Choose leaner meats, poultry and fish, as well as dried peas, beans and lentils more often

8
Grains, Beans and Starchy Vegetables Fruit Milk and Yogurt Products Sweets Non Starch Vegetables

9
Kids learn from their parents Offer healthy and convenient snacks Create colorful meals and snacks

11
More liberalized Meal Planning (Carb Counting), analog insulin, insulin pump therapy can allow for an INCREASE IN FOOD CHOICES, BUT…demands attention to PORTION SIZES ACCURATE CARB COUNTING
, analog insulin, insulin pump therapy can allow for an INCREASE IN FOOD CHOICES, BUT…demands attention to PORTION SIZES ACCURATE CARB COUNTING")
12
Carbohydrates raise blood glucose levels quicker and higher than Fat or Protein Within 1 to 2 hours most of the carbohydrate we eat has been converted into glucose Balancing Carbohydrate intake with insulin and exercise helps to keep blood glucose levels in your target range

13
In a recent Italian study published in May of this year it was shown that Counting Carbohydrate as part of your Diabetes Management Program can actually improve Quality of Life along with knowledge of Diabetes Management *Trento, Marina et al. Journal Endocrinol Invest May 3, 2010

14
Uses “Carb Choices” Carb Choices are based on exchanges 1 exchange/choice = 15 grams of carb 1 fruit = 1 starch = 1 milk = 1 other Vegetables are free when only 1 or 2 servings are eaten at a time This system is based on averages and not precise

15
Count exact carb grams in the food rather than exchanges or choices More precise than using exchanges Best way to match insulin doses to food Accuracy of insulin dose is influenced by the accuracy of your carbohydrate counting

16
This is the amount of insulin to cover the carbohydrate eaten at a meal or snack When set correctly the BG should not rise more than 2.2 - 4.4 mmol at the 2hr pc mark When adjusting do so by 1 to 2 grams at a time

17
Detailed food, BG and insulin dose records are helpful Accurate carbohydrate counting is essential BG testing ac and 2 hr and 4 hr pc meals There are three methods that can be used

18
Keep detailed BG, insulin & food records divide grams of carb consumed by insulin dose taken This helps to identify the differences in I:C ratios at different meals DISADVANTAGE: the I:C ratios on MDI will be different than on a pump

19
Insulin to Carb ratio is the amount of carbohydrate 1 unit of insulin will cover It is a precise way to calculate your insulin needs based on your carbohydrate intake I:C = 500 (480)* TDD *TDD is the Total Daily Insulin Dose E.g. I:C= 500 20 1 unit for every 25 grams of carb

20
Take the TDD – basal insulin= bolus insulin Divide the daily average carbohydrate intake by the bolus insulin to = I:C ratio E.g.. Becky’s TDD is 20 units – 10 units basal = 10 units bolus Average CHO intake of 220 g per day = 22 g 10 units

21
FOOD GRAM VS CHOICE 1 cup mashed potatoes 362 8 spears of asparagus 80 1 small dinner roll (1 oz.) 191 3 oz of chicken 00 1 small 8 oz pear 211 2 tsp margarine 00 __________________________________________________ 81 gm 60 gm Insulin dose using 1:15 (1:C ratio) 5.4 u4.0 u
 oz of chicken 00 1 small 8 oz pear tsp margarine 00 __________________________________________________ 81 gm 60 gm Insulin dose using 1:15 (1:C ratio) 5.4 u4.0 u")
23
2009 study found that only 23% of adolescents (ages 12-18yrs) estimated daily carbohydrates within 10 grams of the true amount *** Diabetes Spectrum Jan,1 2009 Vol 22,#1
 estimated daily carbohydrates within 10 grams of the true amount *** Diabetes Spectrum Jan, Vol 22,#1")
24
Read and use labels Software on pumps for carb information Ask for nutrition information at restaurants Look up information on-line before going (www.calorieking.com)www.calorieking.com Divide and Conquer: Order rice or pasta on side rather than mixed with other foods in casseroles

25
Use the Nutrition Facts Labels to help you make informed choices. Not all foods have labels. Exceptions: fresh fruit and vegetables, raw meat and poultry, foods prepared or processed at the store, foods that contain very few nutrients. Canada introduced a new system for providing nutrition information on food labels in 2003 As of Dec 2005, most companies are required to provide accurate food labels to consumers.

26
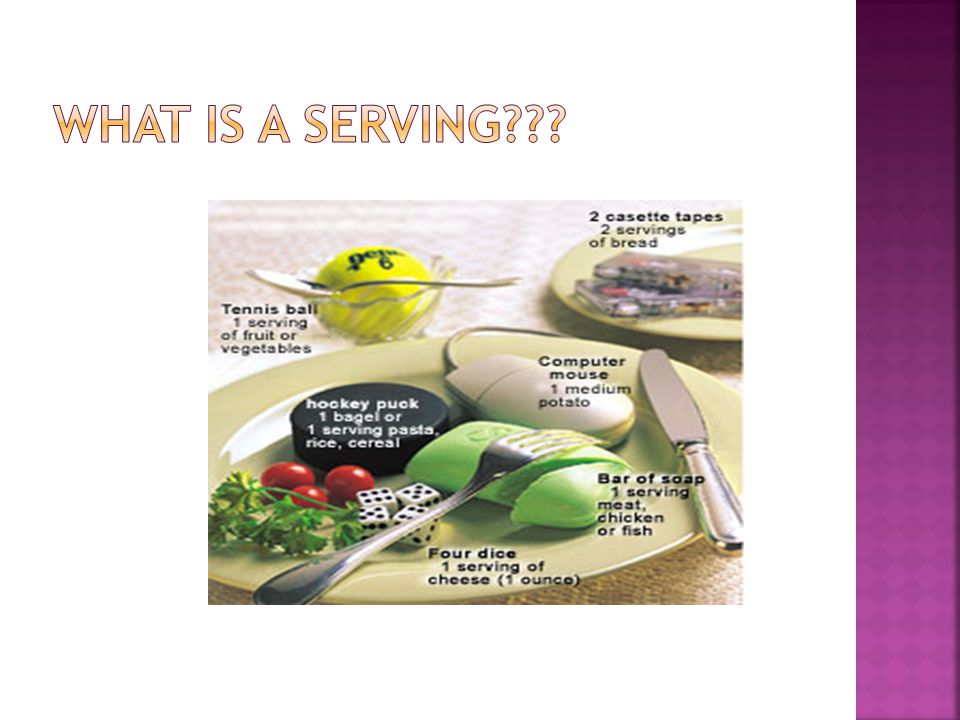
A SERVING is the amount of food you see listed on the Nutrition Facts Label or what is recommended for the different food groups on the Food Guide A PORTION is the amount of food you choose to put on your plate PORTIONS may actually contain several SERVINGS.

27
Optimal postprandial blood sugar control Weight management

28
Measuring Tools Measuring cups Measuring spoons Gram scales, Salter Scale Food Labels Exchange Lists, Internet, Books: Calorie King

30
Thumb tip= 1 tsp (mayo or margarine) Thumb= 1 Tbsp (salad dressing, cream cheese Two fingers lengthwise= 1 ounce (cheese or meat Palm of hand/deck of cards= 3 ounces (meat) Tight fist= ½ cup (noodles or rice) Cupped hand= 1 cup (vegetables or rice) Woman’s hand sizes
 Thumb= 1 Tbsp (salad dressing, cream cheese Two fingers lengthwise= 1 ounce (cheese or meat Palm of hand/deck of cards= 3 ounces (meat) Tight fist= ½ cup (noodles or rice) Cupped hand= 1 cup (vegetables or rice) Woman’s hand sizes")
31
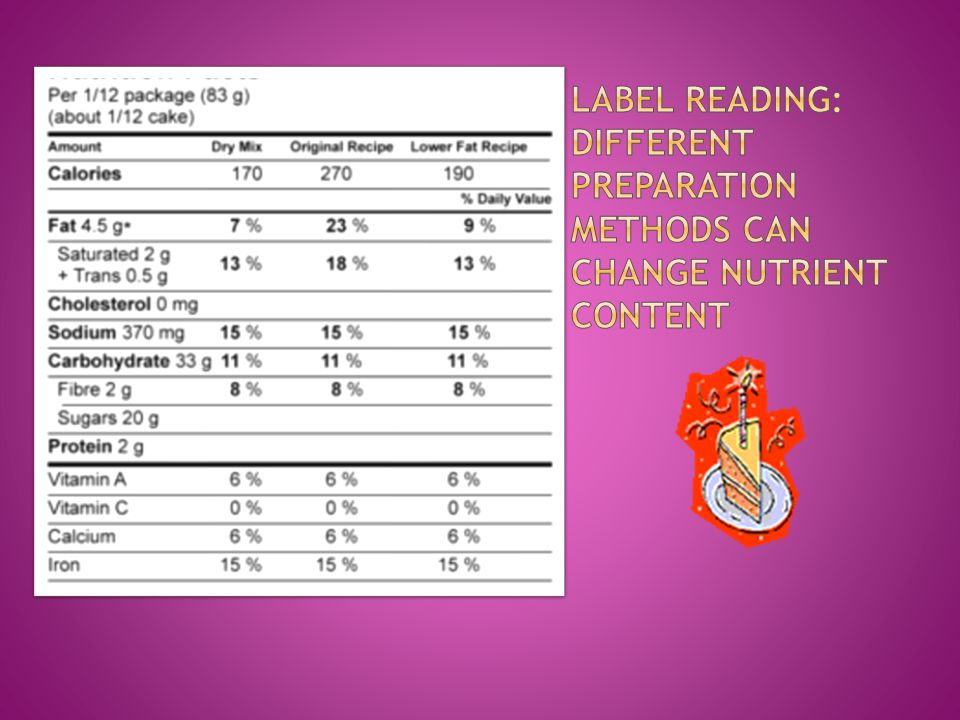
Look at the specific amount of food listed Compare this to the amount you plan on eating If the amounts are different, do the math to calculate the correct nutrition information

32
Although the gram weight is the same in both, the serving size is different.

34
o Look at the fat content. o Compare the listed fats (saturated and trans fats) with the remaining unlisted fats (polyunsaturated and monounsaturated fats) o A good goal is to have more than 50% of total fat coming from polyunsaturated and monounsaturated fats
 with the remaining unlisted fats (polyunsaturated and monounsaturated fats) o A good goal is to have more than 50% of total fat coming from polyunsaturated and monounsaturated fats.")
35
is a benchmark for evaluating the nutrient content of foods quickly and easily is based on recommendations for a healthy diet is used to determine whether there is a lot or a little of a nutrient in a specific amount of food

36
According to the Canadian Diabetes Association, fiber does NOT raise blood glucose and therefore should be subtracted from the total carbohydrate. According to the American Diabetes Association only half of the fiber grams should be subtracted once you get over 5 grams

37
SORBITOL, XYLITOL, MANNITOL, ISOMALT Often have an “ol” ending These sugars have less of an affect on the blood glucose results as they are not completely absorbed in the body Large amounts can create a laxative affect IF A FOOD ITEM CONTAINS 5GM OF SUGAR ALCOHOL THEN SUBTRACT HAVE OF THOSE GRAMS FROM THE TOTAL CARBOHYDRATE AND ONLY COUNT THE DIFFERENCE

38
ALCOHOL ITSELF DOES NOT CONTAIN CARBOHYDRATE HOWEVER SOME ALCOHOLIC BEVERAGES LIKE BEER AND COOLERS DO CONTAIN CARBOHYDRATE ALCOHOL CAN LOWER THE BLOOD SUGARS IT IS A GOOD IDEA TO ALWAYS EAT WHEN CONSUMING ALCOHOL ADA RECOMMENDS: NO MORE THAN 2 DRINKS PER DAY FOR MEN NO MORE THAN 1 DRINK PER DAY FOR WOMEN

39
IS A SYSTEM THAT RANKS CARBOHYDRATE CONTAINING FOODS BASED ON THEIR POTENTIAL TO IMPACT BLOOD GLUCOSE RESULTS Foods are given a rating between 1-100 Every food is compared to glucose with a rank of 100 The higher the rating the higher the potential rise in blood glucose

40
Once portion sizes and carbohydrate counts are known for food and beverages at home, then eating out is easier. Careful postprandial blood glucose monitoring will tell you if you estimated portions accurately, correct with additional insulin if needed.

41
Can help deliver the insulin to match the carbohydrate absorption more closely AND Help to improve glycemic control

42
1 hr 2 hr3hr Duration of insulin delivery Total Dosage 2 u 4 u 6 u

43
CAN BE USED WHEN A DETERMINED AMOUNT OF CARBOHYDRATE IS GOING TO BE CONSUMED OVER A CERTAIN AMOUNT OF TIME COCKTAIL PARTIES BUFFETS LOW GLYCEMIC INDEX FOODS YOU CAN CALCULATE THE TOTAL AMOUNT OF INSULIN AND DELIVER IT OVER A 3HOUR PERIOD FOR EXAMPLE

44
1 hr 2 hr 3 hr Duration of Delivery Total Dosage 2 u 4 u 6 u

45
Can be used to deal with the affect that Protein and Fat can have on blood glucose results

46
Effects on BG Delayed stomach emptying Decreased insulin sensitivity Increased insulin resistance May last for hours after eating Minimal fat actually converted to glucose (<10%) Individual’s response needs to be evaluated Wolpert H. Smart Pumping: A Practical Approach to Mastering the Insulin Pump. Virginia: ADA; 2002: 128. Funnell M., et al. Life with Diabetes: A Series of Teaching Outlines by the Michigan Diabetes Research and Training Center. Alexandria: American Diabetes Association; 2004.

47
May need to increase insulin for a high fat meal 1-2 units for a meal with 10-20 g fat Up to 4 units for a meal with greater than 20 g fat Varies based on patient’s total daily dose of insulin May need to use the extended bolus for a high fat meal to accommodate delayed absorption of CHO Start with a 50/50 bolus 50% given as a normal bolus 50% extended for 2 hours Adjust based on individual’s response Ryan-Turek T. Variable Bolus Features on Insulin Pumps and Practical Applications for Use. On The Cutting Edge. 2005; 26:4:16-18. Wolpert H. Smart Pumping: A Practical Approach to Mastering the Insulin Pump. Virginia: ADA; 2002: 134.

48
Many Canadians eat double the recommended amounts for protein Rate of digestion and conversion to glucose depends on state of insulinization and glycemic control BG effect difficult to predict Up to 50-60% can be converted to glucose Evidence suggests more glycemic impact in poorly controlled diabetes, less impact when patient is adequately insulinized and controlled Franz, M., ed. Diabetes Management Therapies: A Core Curriculum for Diabetes Education, 5h edition. Chicago: American Association of Diabetes Educators, 2001.

49
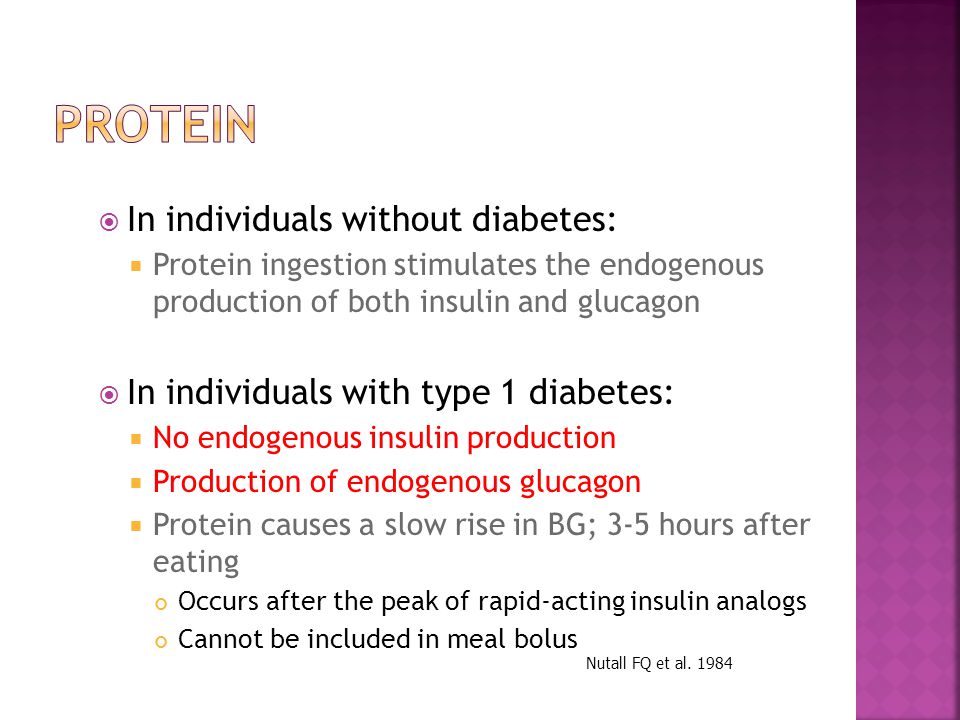
In individuals without diabetes: Protein ingestion stimulates the endogenous production of both insulin and glucagon In individuals with type 1 diabetes: No endogenous insulin production Production of endogenous glucagon Protein causes a slow rise in BG; 3-5 hours after eating Occurs after the peak of rapid-acting insulin analogs Cannot be included in meal bolus Nutall FQ et al. 1984
50
Small to moderate protein intake has little effect on BG Combo bolus is not needed Large protein intake (greater than 8 oz) BG may increase 4-12 hours later Combo bolus may be beneficial Duration and dosage based on individual’s response Consider temporary basal increase starting 3-4 hours after the meal Walsh J. Pumping Insulin, 4th Ed. San Diego: Torrey Pines Press; 2006:70.

51
How can we adjust the bolus to deal with these affects? COMBO BOLUS OPTION AN EXAMPLE: CAN DELIVER 50% OF THE TOTAL AMOUNT OF INSULIN AS A NORMAL BOLUS AND THE OTHER 50% OVER AN EXTENDED AMOUNT OF TIME

52
1 hr 2 hr 3 hr Duration of Delivery Total Dosage 2 u 4 u 6 u

53
THE PIZZA BOLUS *A 2005 STUDY INDICATES THAT THE BEST WAY TO KEEP BG’S IN TARGET RANGE AFTER PIZZA IS TO DELIVER THE INSULIN IN A 50/50 SPLIT SPREAD OUT OVER 8 HOURS!!!!!!!!! *Jones M.S., et al. Optimal Insulin Pump Dosing and Postprandial Glycemia following a Pizza Meal using Continuous Blood Glucose Monitoring System. Diabetes Technology and Therapeutics. 2005; 7(2): 233-240.
:")
54
Bolus given at least 20 minutes before the meal Why: after eating carbs blood sugar starts to rise within 5-10 minutes. Fast acting insulin starts to work to lower the blood sugar 15-20 minutes after it is given and only ½ of its glucose lowering action is seen 2 hrs later. Post meal blood sugars are better controlled when boluses are given 20 minutes prior to the meal.

55
Bolus after meals: unsure of how much is going to be eaten Young children, restaurant Habit Solution: Give ½ of what you expect to be eaten before the meal, finish the bolus/injection after the meal is finished Give before If you are using a pump give the bolus for each course of the meal

56
Various tools for diabetes meal planning can be helpful and effective when used as part of daily diabetes care: Canada’s Food Guide Labels, Portions sizes, serving sizes Books and resources Bolus recommendations Advanced pump features

57
Carbohydrate Counting is a flexible system of meal planning that allows you to accurately determine insulin doses and help predict the impact of carbohydrate on your blood glucose results It is still important however to make health food choices as much as possible (DIABETES OR NOT!)
")
58
YOU NEVER ACTUALLY GET THERE EDUCATED “GUESSTIMATES” ARE A REALITY BUT IT DOES IMPROVE CONSISTENCY IN INTAKE AND OVERALL GLYCEMIC CONTROL IT IS NOT WHAT YOU DO SOME OF THE TIME…BUT WHAT YOU DO MOST OF THE TIME THAT MAKES THE DIFFERENCE!!

59
2009 Calorie King, Calorie, Fat and Carbohydrate Counter; Calorie King Wellness Solutions The Ultimate Guide to Accurate Carb Counting, Gary Scheiner, MS, CDE The Diabetes Carbohydrate and Fat Gram Guide; Lea Ann Holzmeister Complete Guide to Carb Counting, Hope Warshaw, MMSc, RD, CDE, BC-ADM and Karmeen Kulkarni, MS, RD, CDE, BC-ADM

60
Questions? Comments? Suggestions?

Similar presentations