Download presentation
Presentation is loading. Please wait.

1
FEBRUARY, 2013 BY: ABDUL-RAUF A TRAINING WORKSHOP ON STATISTICAL AND PRESENTATIONAL SYSTEM SOFTWARE (SPSS) 18.0 WINDOWS
 18.0 WINDOWS")
2
Introduction Mathematics is the language of science, data analysis is the language of research As long as there is research, there will be the need to analyze data SPSS - Statistical and Presentational System Software SPSS 17 and 18 are called PASW (Predictive Analytics SoftWare) What is SPSS? A software package use for conducting statistical analysis, manipulating data, and generating tables and graphs. SeTRAC

3
Getting to know SPSS Option 1: Place your cursor on the SPSS icon and double click Option 2: Step 1: Click on Start Step 2: Move cursor to All Programmes Step 3: Click on SPSS executable file to open Step 4: Click on the option under ‘What would you like to do’? E.g Open existing data source Step 5: Click OK button SeTRAC

5
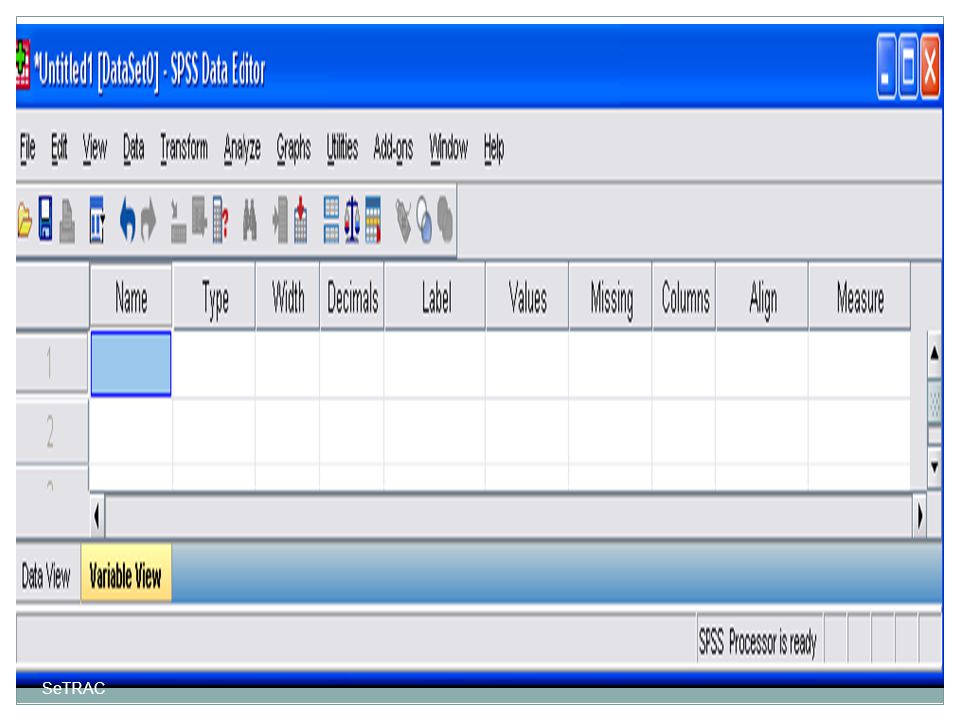
Features of SPSS The main window features include: Data Editor Data view and Variable view The Viewer The Pivot Table Editor Chart Editor SeTRAC

6
Entering data Step 1: Click on Data View Step 2: Click on the first cell (1 st C, 1 st R) Step 3: Type in the # e.g. if the variable is ID, then type in 1 Step 4: Move the cursor into the second cell and enter second piece of information for case # 1 Step 5: Move the cursor into next cell and enter very piece of information for case # 1 Step 6: Press the Home key to get back. Use the down arrow to move to the second row and enter data for case #2 SeTRAC

7
Modifying the data file To delete a case To insert a case between existing cases To delete a variable To insert a variable between existing variables To move an existing variable To sort the data file To split the data file To select cases SeTRAC

8
To insert a variable between existing variables Step 1: Position your cursor in a cell in the column (variable) to the right of where you would like the new variable to appear Step 2: Right click Step 3: Insert variable Step 4: Enter the data of the new variable SeTRAC
 to the right of where you would like the new variable to appear Step 2: Right click Step 3: Insert variable Step 4: Enter the data of the new variable SeTRAC")
9
To move an existing variable Step 1: Create a new empty variable column Step 2: Click on the variable name of the existing variable you wish to move Step 3: Click on the Edit menu and choose Cut Step 4: Highlight the new empty column that you created Step 5: Click on the Edit menu and choose Paste SeTRAC

10
Screening and cleaning the data Data screening process involves a # of steps: Step 1: Checking for errors Step 2: Finding the error in the data file Step 3: Correcting the error in the data file SeTRAC

11
Checking for errors Inspect the frequencies for Categorical variables Click on Analyze Click on Descriptive Statistics Click Frequencies Choose the variable you wish to check (e.g. sex) Move these into the Variables box Click on Continue Click on OK SeTRAC
 Move these into the Variables box Click on Continue Click on OK SeTRAC.")
12
Checking for errors cont. I nspect the frequencies for Continuous variables Click on Analyze Click on Descriptive Statistics Click Descriptives Choose the variable you wish to check (e.g. age) Move these into the Variables box Click on Continue Click on OK SeTRAC
 Move these into the Variables box Click on Continue Click on OK SeTRAC.")
13
Checking for errors cont. Step 1: Check your minimum, maximum and means values Step 2: Check the number of valid and missing cases Step 3: Check the frequencies fall into each category eg district, community, etc Step 4: Delete on your keypad SeTRAC

14
Finding the error in the data file METHOD 1 Step 1: Click on the variable name of the variable in which the error has occurred (e.g. a 3 for sex) Step 2: Click once to highlight the column Step 3: Click on Edit from the menu across the top of the screen Step 4: click on Find Step 5: In the Search for box, type in the incorrect value that you are looking for (e.g 3) Step 6: Click on Search Forward to continue SeTRAC
 Step 2: Click once to highlight the column Step 3: Click on Edit from the menu across the top of the screen Step 4: click on Find Step 5: In the Search for box, type in the incorrect value that you are looking for (e.g 3) Step 6: Click on Search Forward to continue SeTRAC.")
15
Finding the error in the data file METHOD 2 Step 1: Click on Analyze, Descriptive Stat. Explore Step 2: In the Display section click on Statistics Step 3: Click on e.g. sex and move to Dependent list Step 4: In the Label cases, choose ID Step 5: In the Statistics section choose Outliers Step 6: Click on Continue Step 7: In the Options section choose Exclude case pairwise Step 8: Click on Continue and then OK SeTRAC

16
Correcting the error in the data file Step 1: Check what value should have been entered for that person Step 2: Find the variable labelled ID Step 3: Move down to the case that has the ID # with the error Step 4: Move across the row until you come to the column of the variable with the error Step 5: Place the cursor in the cell, type in the correct value SeTRAC

17
Obtaining frequency for categorical variable Step 1: Click on Analyze, Descriptive Statistics, Frequency Step 2: Choose and highlight the categorical variables you are interested in Step 3: Move these into the Variables box Step 4: Click on the Statistics button Step 5: In the Dispersion section tick Minimum and Maximum Step 6: Click on Continue and OK SeTRAC

18
Obtaining descr. stat. for continuous variable Step 1: Click on Analyze, Descriptive Statistics, Descriptives Step 2: Click on all the continuous variables that you wish to obtain descriptive statistics for Step 3: Click on the arrow button to move them into the Variables box Step 4: Click on the Options button Step 5: Click on mean, standard deviation, minumum, maximum, skewness, kurtosis Step 6: Click on Continue, and OK SeTRAC

19
Cross tabulation Step 1: Click on Analyze, Descriptive Statistics, Cross tabs Step 2: Click on (sex) Step 3: Click on Row arrow button to move into Row(s) section Step 4: Click on (agegp3) Step 5: Click on Column arrow button to move into Column(s) Step 6: Click on Cells SeTRAC
 Step 3: Click on Row arrow button to move into Row(s) section Step 4: Click on (agegp3) Step 5: Click on Column arrow button to move into Column(s) Step 6: Click on Cells SeTRAC")
20
Crosstab cont. Step 7: Click on Expected, Total, Unstandardized Step 8: Click on Continue Step 9: Click on OK SeTRAC

21
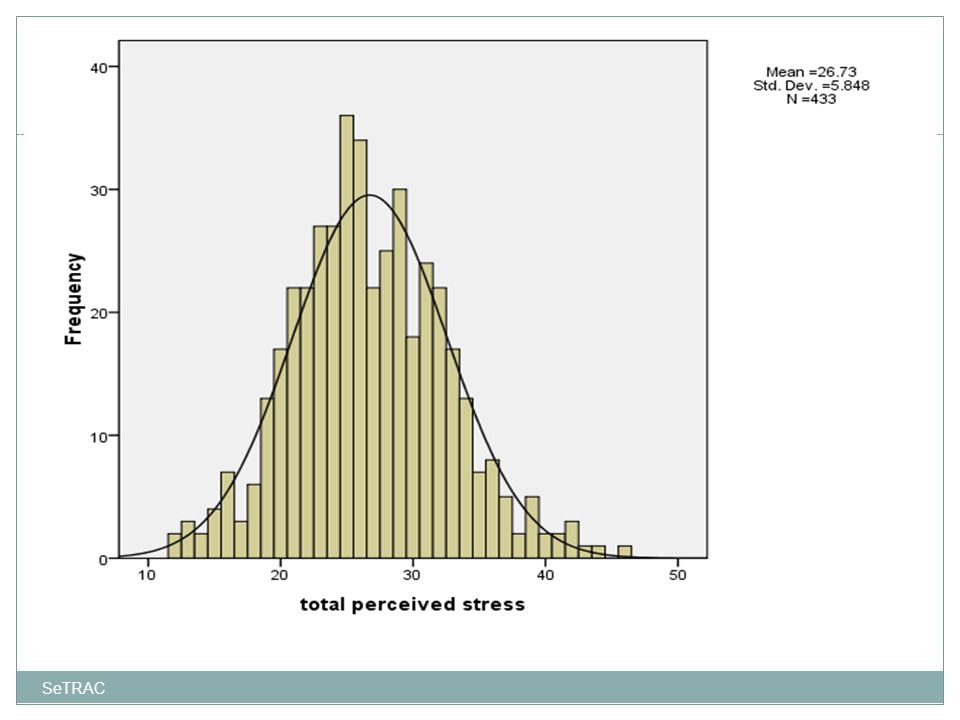
Creating graphs e.g. histogram Step 1: Click on Graphs, Histogram Step 2: Click on your continuous variable of interest (Total perceived stress) Step 3: Move it into the Variable box Step 4: Click on Display normal curve Step 5: Click on Title to type the desired title Step 6: Click on Continue and OK SeTRAC
 Step 3: Move it into the Variable box Step 4: Click on Display normal curve Step 5: Click on Title to type the desired title Step 6: Click on Continue and OK SeTRAC.")
23
Bar graph Step 1: Click on Graph, Bar Step 2: Click on Clustered Step 3: In the Data in chart are section, click on Summaries for groups of cases Step 4: Click on Define Step 5: In the Bars represent box click on Other statistics/summary function Step 6: Click on the continuous variable (Total perceived stress) Step 7: Click on categorical variable (agegp3) SeTRAC
 Step 7: Click on categorical variable (agegp3) SeTRAC")
24
Bar graph cont. Step 8: Click on the arrow button to move it into the Category axis box Step 9: Click on another categorical variable (sex) Step 10: Move it into the Define Clusters by box Step 11: Click on the Options button Step 12: Remove tick if any from Display groups defined by missing values Step 13: Click on OK SeTRAC
 Step 10: Move it into the Define Clusters by box Step 11: Click on the Options button Step 12: Remove tick if any from Display groups defined by missing values Step 13: Click on OK SeTRAC.")
26
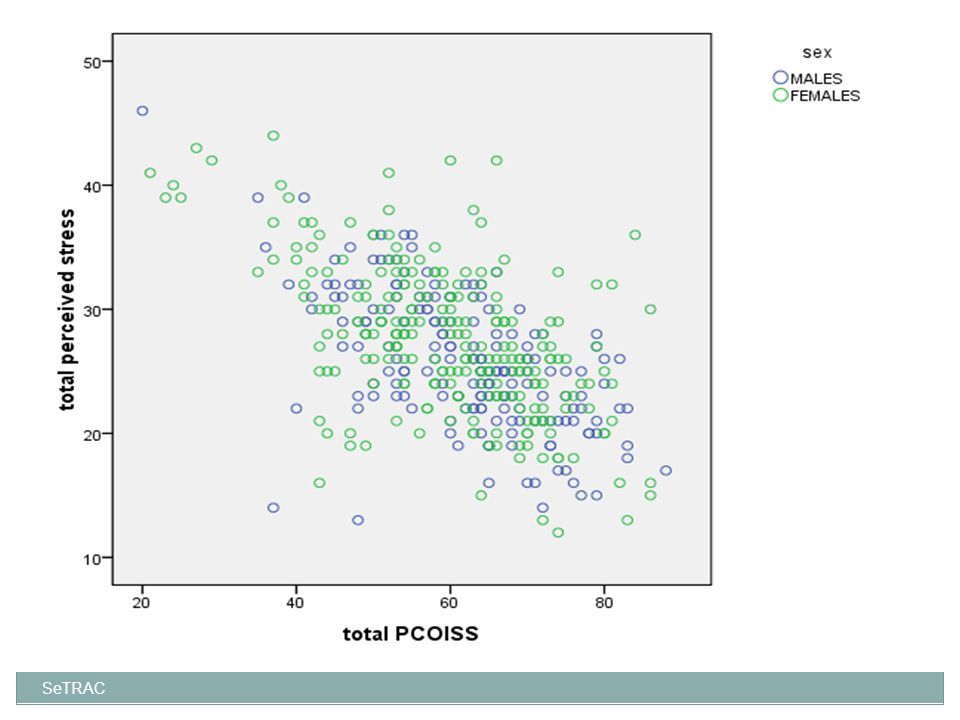
Creating a scatterplot Step 1: Click on Graphs, Scatter Step 2: Click on Simple, Define Step 3: Click on your dependent variable (Total perceived stress) Step 4: Click on the arrow to move it into the box labelled Y axis Step 5: Move your other variable into the box labelled X axis Step 6: Move categorical variables into the Set Markers by box Step 7: Click on Title, Continue and then OK SeTRAC
 Step 4: Click on the arrow to move it into the box labelled Y axis Step 5: Move your other variable into the box labelled X axis Step 6: Move categorical variables into the Set Markers by box Step 7: Click on Title, Continue and then OK SeTRAC")
28
Editing a chart/graph Step 1: Double click on what you wish to change Step 2: Click on the title or label you wish to change Step 3: Click once on the aspect of the chart/graph that you wish to change Step 4: Click on the button on the menu bar that corresponds to the aspect you wish to change SeTRAC

29
Non-parametric techniques There are many techniques of non- parametrics Chi-square for independence Mann-Whitney Test Wilcoxon Signed Rank Test Kruskal-Wallis Test Friedman Test Spearman Rank Order Correlation SeTRAC

30
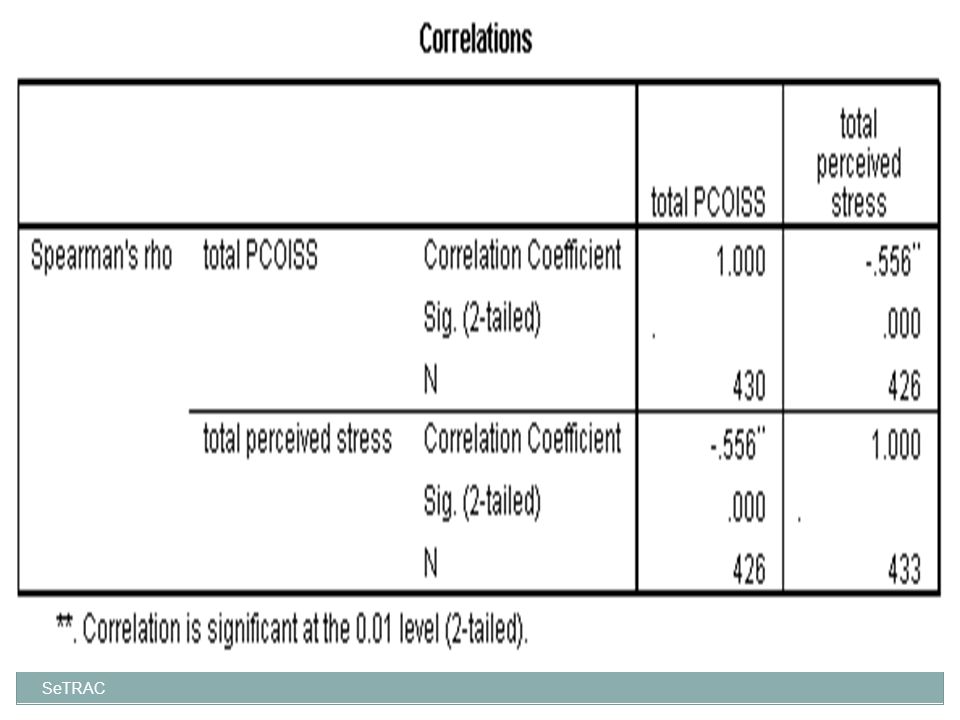
Procedure for Spearman’ Rank Order Cor. Step 1: Click on Analyze, Correlate, Bivariate Step 2: Click on your two variables (total PCOISS, total perceived stress) Step 3: Move them into the box marked Variables Step 4: In the section labelled Correlation Coefficients Step 5: Click on the option labelled Spearman Step 6: Click on OK SeTRAC
 Step 3: Move them into the box marked Variables Step 4: In the section labelled Correlation Coefficients Step 5: Click on the option labelled Spearman Step 6: Click on OK SeTRAC.")
32
THE END THANK YOU FOR YOUR ATTENTION SeTRAC

Similar presentations

. Is a spreadsheet application designed to take advantage of the windows graphical interface MICROSOFT EXCEL.>")

>")


 and dependant (Y) variables.>")

 Getting Started Guide.>")


 Commonly used statistical software.>")

