Download presentation
Presentation is loading. Please wait.

1
Coasts Processes and Forms

2
Understanding the Physical Geography of Coasts 1.Tides & Waves 2.Transport of Sand 3.Coastal Erosion 4.Coastal deposition and beaches 5.Sea level change & coasts 6.Your tropical vacation

3
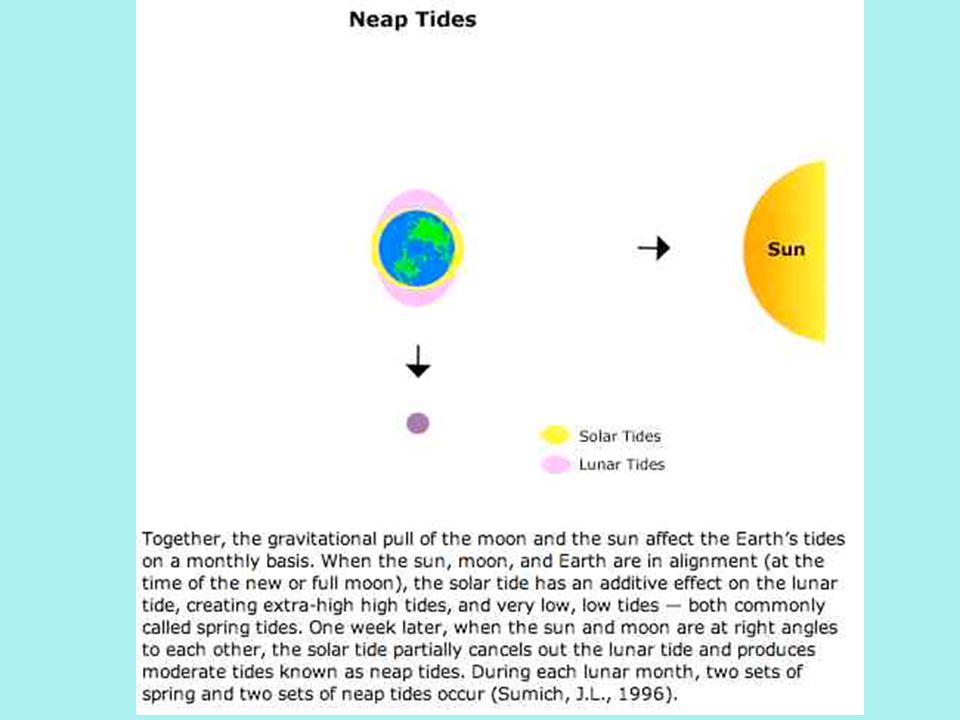
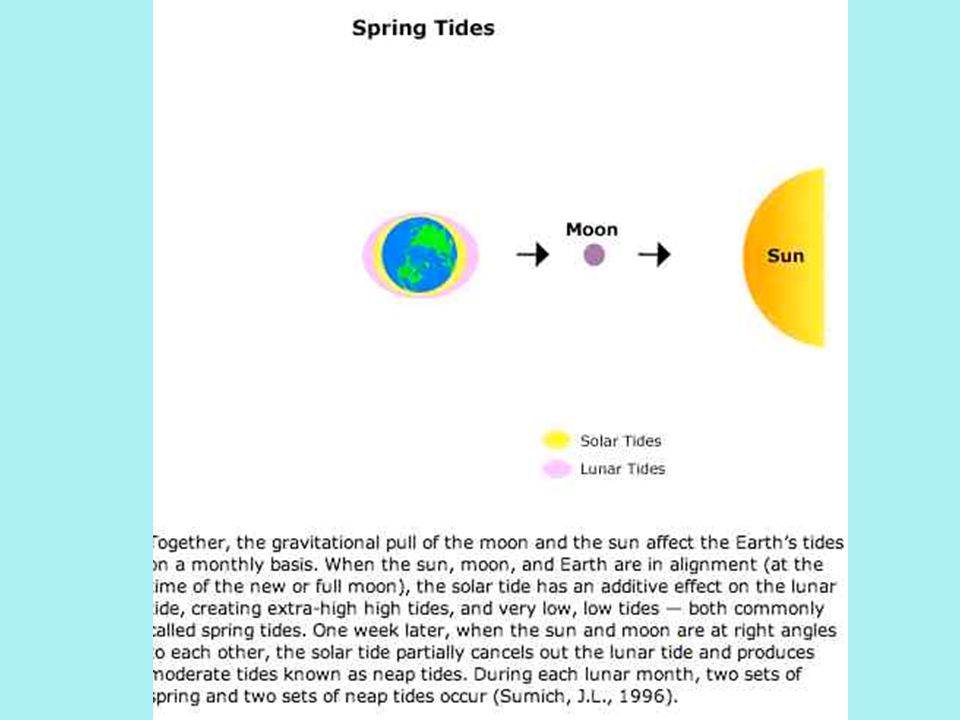
1. Tides and Waves

6
Classroom Resource Navy Animation about Tides

7
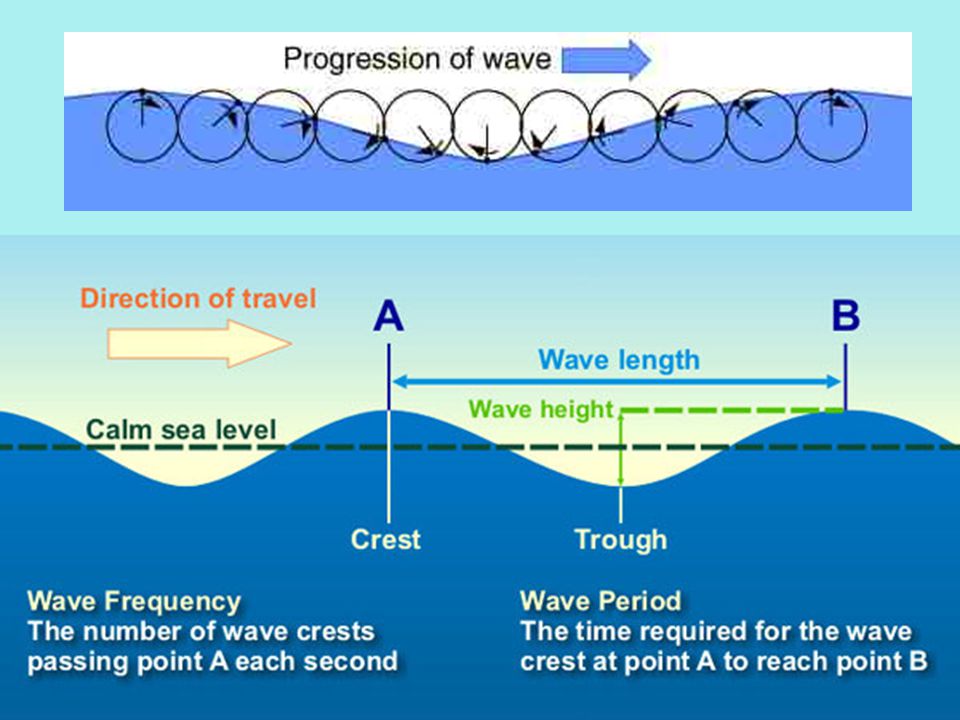
Waves generated by winds

8
Classroom Resources Introductory Movie Clip

10
Open Ocean

11
Classroom Resource

13
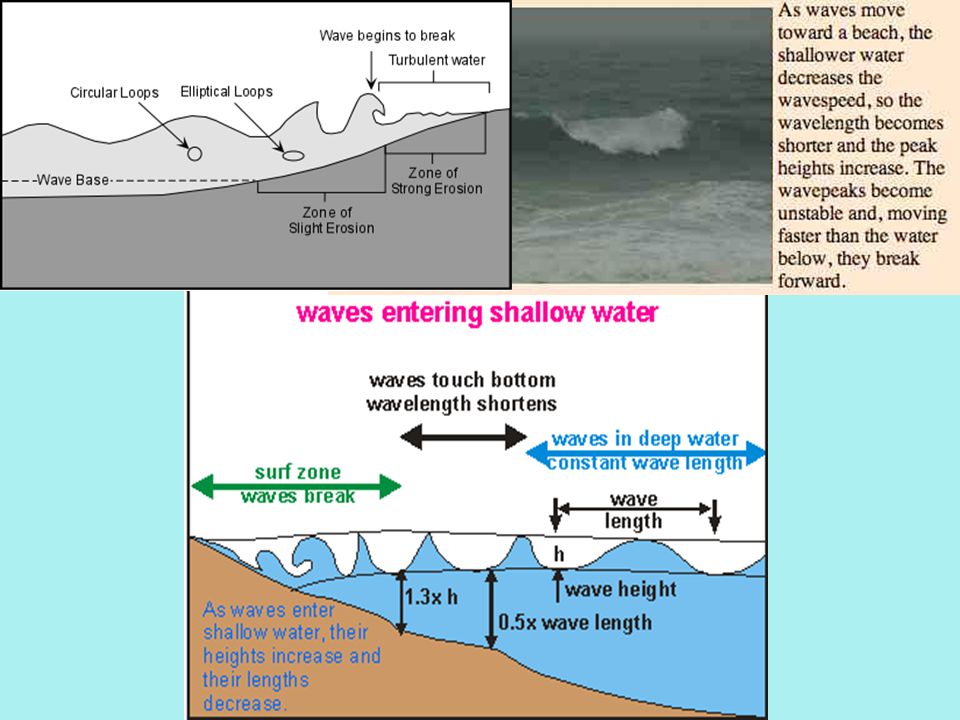
Types of Breakers

14
Wave Refraction (bending) Concentrates energy at headlands Spreads out (dilutes) in bays)
 Concentrates energy at headlands Spreads out (dilutes) in bays)")
15
Wave Refraction (bending)
")
16
More wave refraction Waves bend as they approach the shore (because they slow)
")
17
2. Transport of Sand

18
Classroom Resource

19
2 parts: beach drift & longshore current

20
Consequence of sand movement: Sand Spit

21
Classrom Resource

22
Consequence of sand movement: Baymouth Bar

23
Classroom Resource Animation about baymouth bar formation

24
Consequence of sand movement: Tombolo (island connected to land by sand spit) Point Sur, California
 Point Sur, California")
26
Classroom Resource Movie showing sand piling up behind Getty and Groin

27
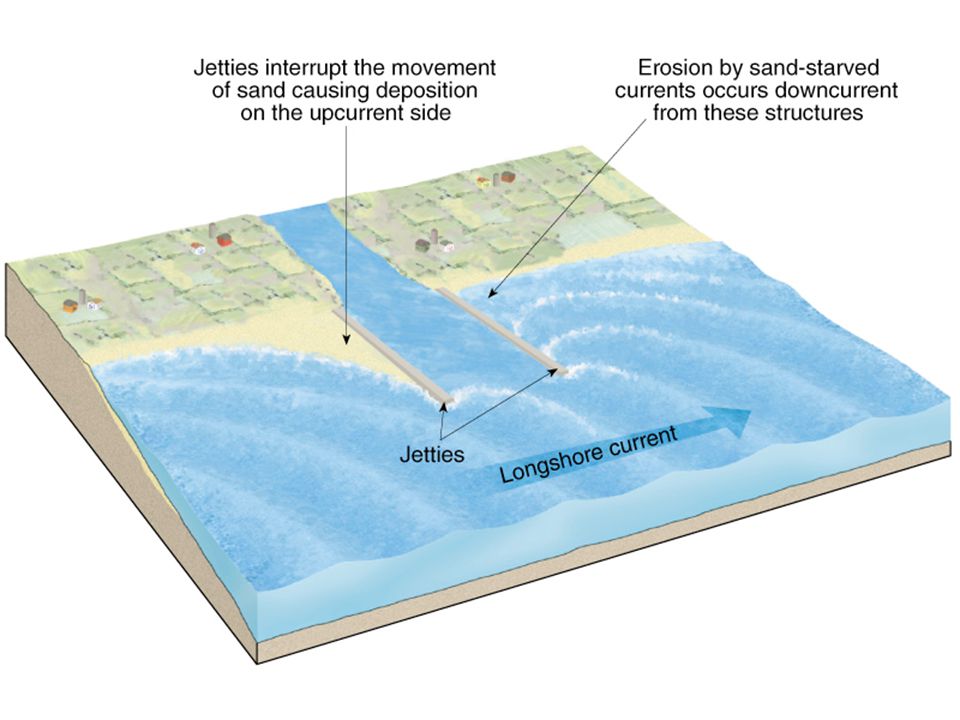
Consequence of sand movement: Sand backs up behind groins

28
Santa Barbara Dredge

29
Which way is the longshore current? Why no Columbia River Delta? Ocean waves and strong currents quickly redistribute the material that is being deposited so it allows for no sediment to build up and form a delta rather it redistributes it.

30
3. Coastal Erosion Most coastal erosion occurs during storms. Storms cause great damage, but often the rock or beach has been exposed to years of weathering and erosion by the wind so is already in a weakened state. The storm really just finishes it off.

31
These photos show a part of the coastline of the state of Louisiana, USA, that was affected by Hurricane Katrina The top image, taken in July 2001, shows narrow sandy beaches and adjacent overwash sandflats, low vegetated dunes, and backbarrier marshes broken by ponds and channels. The second image shows the same location on August 31, 2005, two days after Hurricane Katrina made landfall on the Louisiana and Mississippi coastline. Storm surge and large waves from Hurricane Katrina submerged the islands, stripped sand from the beaches, and eroded large sections of the marsh.

32
These photos show a beach on the west coast of the USA. The top photo shows a cliff face with a beach below and sea stack. A year later, after a series of winter storms, attributed to El Nino, the beach beneath the cliffs has all but disappeared. The natural ‘bank’ of sand has gone, leaving the cliff more exposed to erosion. October 1997 April 1998 Images from USGS

33
Higher than usual wave heights, and thus, greater wave energy Storms bring: Waves containing sand that has been churned up from the sea floor, causing them to be more erosive.

35
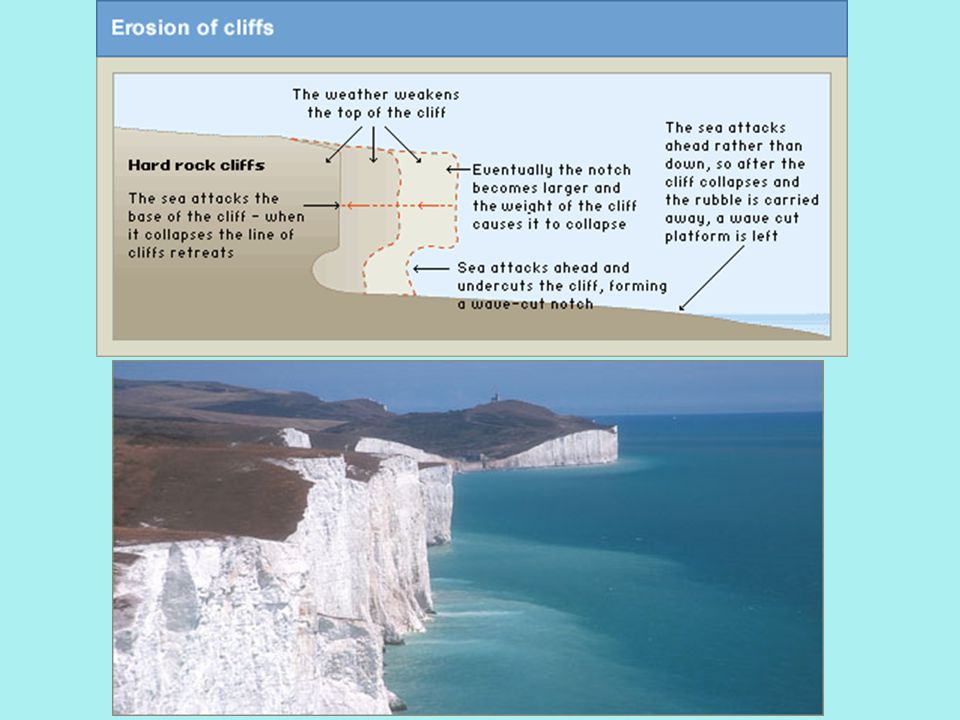
Wave cut platform

36
Wave cut notch

37
Sea Caves

38
Sea Stack Sea Arch

39
More Sea Stacks (used to be land) Old Man of Hoy, Scotland The Twelve Apostles, Australia Ha Long Bay, Vietnam
 Old Man of Hoy, Scotland The Twelve Apostles, Australia Ha Long Bay, Vietnam")
40
Coastal Erosion and People Over 80% of the world’s shorelines are retreating at a rate from centimeters to meters per year. Many governments, local authorities and individuals spend large amounts of money protecting their developments from being washed away by coastal erosion.

41
Image: R.K. Smith www.climatechange.govt.nz Note the fence out on the right

42
Image: Coastal Lands Program, Hawai’i If this was your house, what would you do?

43
Sometimes the sea just jumps over the wall! Images: Coastal Lands Program, Hawai’i Hard Stabilization Methods Groin

44
Shore protection (a revetment) by massive concrete armour units fronting a resort in Japan. (Photo: Jess Walker, courtesy of NIWA)
.")
45
Soft Stabilization A beach usually erodes because of a lack of sand to protect it. Thus, soft stabilization methods involve building up the supply of sand and protecting it. Examples include: Beach Nourishment: Trucking (or dredging in – piping) sand in from one beach to another Sand dune stabilization: Planting grasses and fencing the dunes
 sand in from one beach to another Sand dune stabilization: Planting grasses and fencing the dunes.")
46
Simple fence collecting sand

47
4. Deposition & Beaches

48
Why do some coastlines erode away? Why do some grow? In this case, beach erodes after hurricane High energy of the waves Storm surge raise in sea-level Location of the shoreline erode back

49
The Sand Supply Sand is food for beaches and gives shorelines protection from the waves. Being starved of sand can cause higher rates of erosion. The Dynamic Equilibrium is affected by… The Waves The erosive action of a wave is greatest when the wave is high. The angle at which they strike a beach and how much sand they are carrying can also influence the rate of erosion. The Sea Level In New Zealand the sea level is rising at approximately 15 cm/100yrs. Climate change may cause this to rise further. The location of the shoreline Shorelines move back and forth between storms and their location can either increase or decrease erosion rates

50
Animation in Classroom Resource Folder Even seasons alter sand equilibrium

51
Human Impact A poor understanding of how a shoreline works can actually cause human activity to accelerate the rate of erosion. Key factors often over-looked are: The supply of sand (cut off by paving over rivers) Altering natural shape of the coastline & altering sand- transporting currents Look at these groins. They are designed to trap sand, but in doing so, they are probably starving a beach further down the coast of sand.
 Altering natural shape of the coastline & altering sand- transporting currents Look at these groins. They are designed to trap sand, but in doing so, they are probably starving a beach further down the coast of sand..")
52
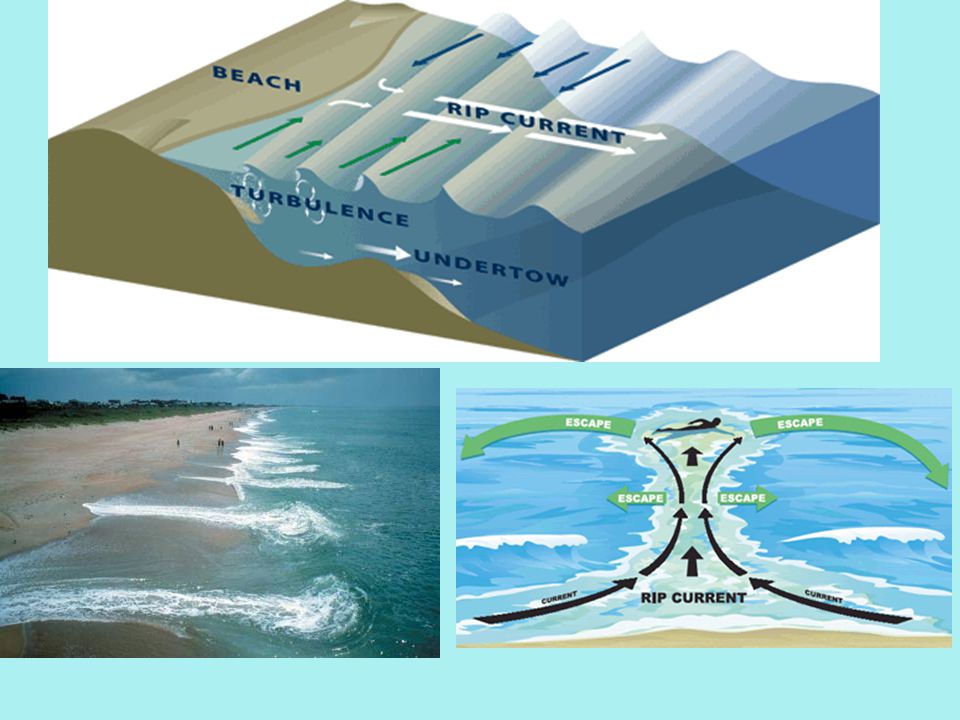
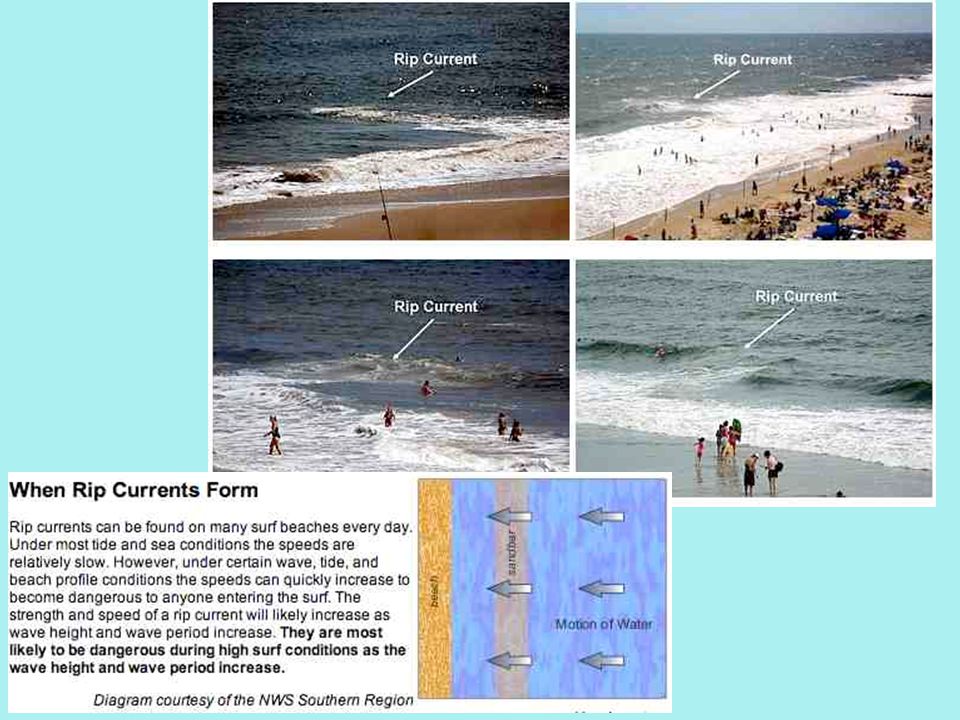
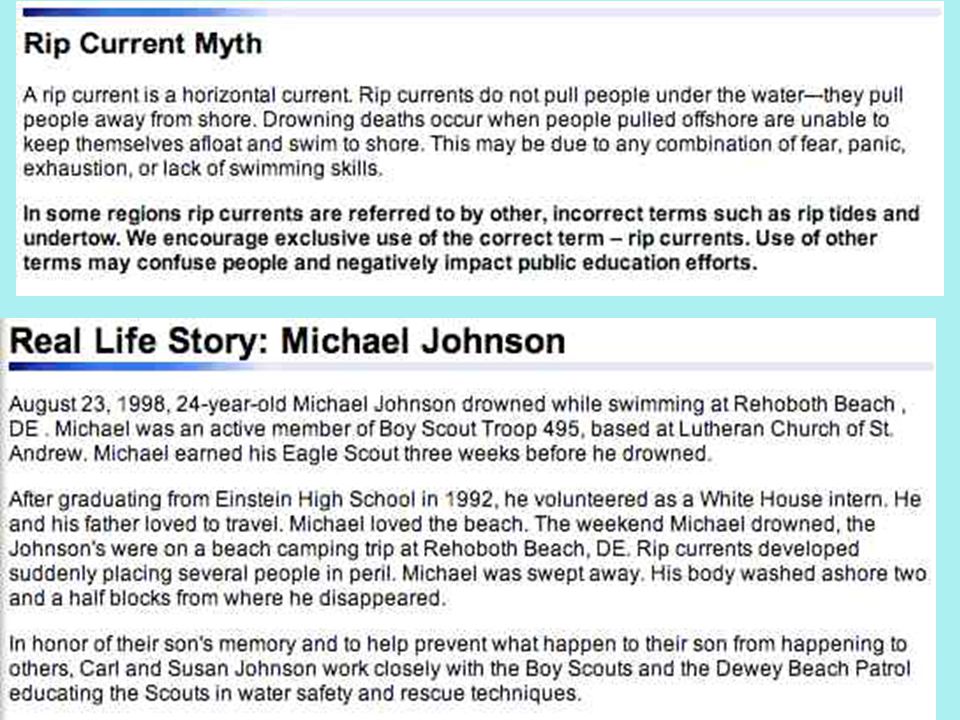
Must mention rip currents

54
Classroom Resource Animation

57
5. Coasts and Sea Level Change Former coastline in glacial time

58
Barrier Islands – former beach sand migrates with sea level rise

59
S. Padre Island, TX http://earth.jsc.nasa.gov

60
Classroom Resource Movie clip discussion Florida Barrier Islands

61
Barrier Islands – slowly move onshore Cape Hatteras

62
Coast Rising (and sea level goes up and down with glacial/interglacial times) Coast Stable, but sea level goes up and down (e.g. Atlantic seashore)
.")
63
RIA – drowned river valley

64
Coast drowned by sea level rise after last glaciation – river valleys invaded (ria) Chesapeake Bay Sydney, Australia
 Chesapeake Bay Sydney, Australia")
65
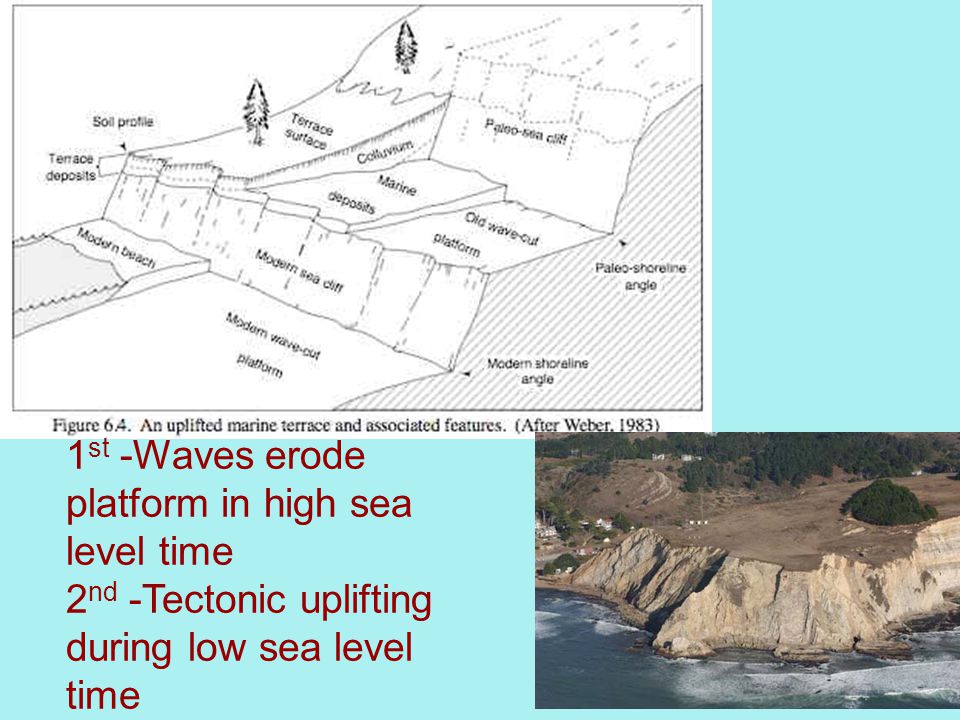
Coast rising up form Marine Terraces (ancient, uplifted wave-cut platforms) 1 st -Waves erode platform in high sea level time 2 nd -Tectonic uplifting during low sea level time
 1 st -Waves erode platform in high sea level time 2 nd -Tectonic uplifting during low sea level time")
67
California Coast (usually occupied by cities) Old Sea Stack
 Old Sea Stack")
68
6. Your tropical vacation

69
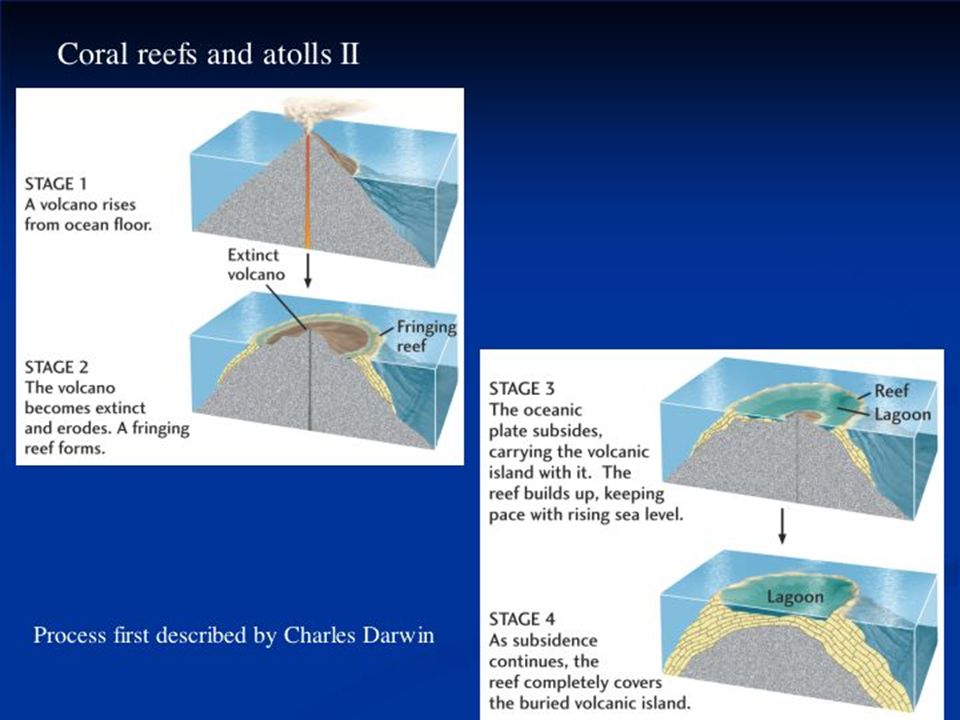
This NOAA animation shows the dynamic process of how a coral atoll forms. Corals (represented in tan and purple) begin to settle and grow around an oceanic island forming a fringing reef. It can take as long as 10,000 years for a fringing reef to form. Over the next 100,000 years, if conditions are favorable, the reef will continue to expand. As the reef expands, the interior island usually begins to subside and the fringing reef turns into a barrier reef. When the island completely subsides beneath the water leaving a ring of growing coral with an open lagoon in its center, it is called an atoll. The process of atoll formation may take as long as 30,000,000 years to occur. http://www.oceanservice.noaa.gov/education/kits/corals/media/supp_coral04a.html
 begin to settle and grow around an oceanic island forming a fringing reef. It can take as long as 10,000 years for a fringing reef to form. Over the next 100,000 years, if conditions are favorable, the reef will continue to expand. As the reef expands, the interior island usually begins to subside and the fringing reef turns into a barrier reef. When the island completely subsides beneath the water leaving a ring of growing coral with an open lagoon in its center, it is called an atoll. The process of atoll formation may take as long as 30,000,000 years to occur.")
70
Classroom Resource Alternative Animation Showing Atoll Formation (in classroom resource folder)
")
71
Fringing Reef Holand Island Grand Cayman Is.

73
Tureia, Coral AtollOeno, Fringing Reef

74
Bora Bora Atoll

75
Online Video

76
Online K-8 Lessons

77
Online Animations Longshore Drift and Depositional Landforms (Coasts) http://serc.carleton.edu/NAGTWorkshops/visualization/collections/longshore.ht ml Visualizations for Teaching Tides http://serc.carleton.edu/NAGTWorkshops/visualization/collections/tides.html Visualizations for Teaching Rocky Coastlines and Erosional Landforms http://serc.carleton.edu/NAGTWorkshops/visualization/collections/rocky_coastli nes.html Coastal Wave Mechanics http://serc.carleton.edu/NAGTWorkshops/visualization/collections/coastal_wav e_mechanics.html Coral Reefs and Atolls http://serc.carleton.edu/NAGTWorkshops/visualization/collections/coralreefsatol ls.html
 ml Visualizations for Teaching Tides Visualizations for Teaching Rocky Coastlines and Erosional Landforms nes.html Coastal Wave Mechanics e_mechanics.html Coral Reefs and Atolls ls.html")
78
Imagery seen in this presentation is courtesy of Ron Dorn and other ASU colleagues, students and colleagues in other academic departments, individual illustrations in scholarly journals such as Science and Nature, scholarly societies such as the Association of American Geographers, city,state governments, other countries government websites and U.S. government agencies such as NASA, USGS, NRCS, Library of Congress, U.S. Fish and Wildlife Service USAID and NOAA.c

Similar presentations


>")


