Download presentation
Presentation is loading. Please wait.

1
Ventilator Waveforms: Basic Interpretation and Analysis
Vivek Iyer MD, MPH Steven Holets, RRT CCRA Rolf Hubmayr, MD Edited for ATS by: Cameron Dezfulian, MD

2
Outline of this presentation
Goal: To provide an introduction to the concept of ventilator waveform analysis in an interactive fashion. Content: Outline of types of ventilatory waveforms. Introduction to respiratory mechanics and the ‘Equation Of Motion’ for the respiratory system Development of the concept of ventilator waveforms Illustrations and videos of waveforms to illustrate their practical applications and usefulness.

3
Types of Ventilator Waveforms: Scalars and Loops
Scalars are waveform representations of pressure, flow or volume on the y axis vs time on the x axis flow vs time scalar Inspiratory arm expiratory arm pressure vs time scalar volume vs time scalar

4
Types of Ventilator Waveforms: Scalars and Loops
Loops are representations of pressure vs volume or flow vs volume Expiratory arm Pressure Vs volume loop volume pressure Inspiratory arm Flow Vs volume loop Expiratory arm flow volume

5
Understanding the flow-time waveform
There are two components to the flow-time waveform The inspiratory arm: Active in nature The character is determined by the ventilatory flow settings. The expiratory arm: Passive in nature The character is determined mainly by elastic recoil of the patients lungs and airway resistance. Also affected by patient respiratory effort (if any) There are two commonly used types of flow patterns available on most ventilators The ‘square wave’ or ‘constant flow’ pattern The ‘ramp’ (decelerating) type pattern
 There are two commonly used types of flow patterns available on most ventilators. The ‘square wave’ or ‘constant flow’ pattern. The ‘ramp’ (decelerating) type pattern.")
6
The ‘square wave’ flow pattern
The inspiratory flow rate remains constant over the entire inspiration. Inspiratory arm flow The expiratory flow is passive and is determined by airways resistance and the elastic recoil of the lungs time Expiratory arm Inspiratory time = Tidal volume Flow rate

7
The ‘decelerating ramp’ flow pattern
The inspiratory flow rate decelerates as a function of time to reach zero flow at end inspiration time flow Inspiratory arm For a given tidal volume, the inspiratory time is higher in this type of flow pattern as compared to the square wave pattern Expiratory arm Inspiratory time = Tidal volume Flow rate

8
Now let us try to understand the following in the next few slides
A basic ventilator circuit diagram Airway pressures The equation of motion for the respiratory system The pressure-time waveform

9
Understanding the basic ventilator circuit diagram
Essentially the circuit diagram of a mechanically ventilated patient can be broken down into two parts….. The ventilator makes up the first part of the circuit. Its pump like action is depicted simplistically as a piston that moves in a reciprocating fashion during the respiratory cycle. The patient’s own respiratory system Makes up the 2nd part of the circuit. The diaphragm is also shown as a 2nd piston; causing air to be drawn into the lungs during contraction. ET Tube These two systems are connected by an endotracheal tube which we can consider as an extension of the patients airways. airways Diaphragm Chest wall

10
Understanding airway pressures
The respiratory system can be thought of as a mechanical system consisting of a resistive (airways) and elastic (lungs and chest wall) element in series Diaphragm ET Tube airways Chest wall PPL Pleural pressure Paw Airway pressure Palv Alveolar pressure Paw = Flow Resistance + Volume Compliance Lungs + Chest wall (elastic element) THUS Airways (resistive element) Airways (resistive element) Lungs + Chest wall (elastic element) The contribution of the elastic element (lungs + chest wall) depends on the degree of lung inflation and the underlying compliance of the lungs and the chest wall The contribution of airway resistance pressure depends on the rate of airflow and the underlying resistance (caliber) of the airways Flow resistance Volume compliance
 and elastic. (lungs and chest wall) element in series. Diaphragm. ET Tube. airways. Chest wall. PPL. Pleural pressure. Paw. Airway pressure. Palv. Alveolar pressure. Paw = Flow Resistance + Volume. Compliance. Lungs + Chest wall. (elastic element) THUS. Airways. (resistive element) Airways. (resistive element) Lungs + Chest wall. (elastic element) The contribution of the elastic element. (lungs + chest wall) depends on. the degree of lung inflation and. the underlying compliance of the. lungs and the chest wall. The contribution of airway resistance. pressure depends on the rate of airflow. and the underlying resistance (caliber) of the airways. Flow resistance. Volume. compliance.")
11
Understanding basic respiratory mechanics
Thus the equation of motion for the respiratory system is ventilator P applied (t) = Pres (t) + Pel (t) Elungs RET tube ET Tube Raw Ers airways Rairways Echest wall Thus to move air into the lungs at a given time (t), the ventilator has to generate a pressure (P applied) that is sufficient to overcome the pressure generated by the elastic (Pel (t)) and airway (Paw) resistances offered by the respiratory system at that time. The total ‘elastic’ resistance (Ers) offered by the respiratory system is equal to the sum of elastic resistances offered by the Lung E lungs and the chest wall E chest wall The total ‘airway’ resistance (Raw) in the mechanically ventilated patient is equal to the sum of the resistances offered by the endotracheal tube (R ET tube) and the patient’s airways ( R airways) Let us now understand how the respiratory systems’ inherent elastance and resistance to airflow determines the pressures generated within a mechanically ventilated system. Diaphragm
 = Pres (t) + Pel (t) Elungs. RET tube. ET Tube. Raw. Ers. airways. Rairways. Echest wall. Thus to move air into the lungs at a given time (t), the ventilator has to generate a pressure (P applied) that is sufficient to overcome the pressure generated. by the elastic (Pel (t)) and airway (Paw) resistances. offered by the respiratory system at that time. The total ‘elastic’ resistance (Ers) offered by the. respiratory system is equal to the sum of. elastic resistances offered by the. Lung E lungs and the. chest wall E chest wall. The total ‘airway’ resistance (Raw) in the mechanically ventilated patient. is equal to the sum of the resistances offered. by the endotracheal tube (R ET tube) and the patient’s airways ( R airways) Let us now understand how the respiratory systems’ inherent elastance and resistance to airflow. determines the pressures generated within a. mechanically ventilated system. Diaphragm.")
12
Understanding the pressure-time waveform
using a ‘square wave’ flow pattern Ppeak Pres pressure ventilator Pplat Pres RET tube time Pres Rairways After this, the pressure rises in a linear fashion to finally reach Ppeak. Again at end inspiration, air flow is zero and the pressure drops by an amount equal to Pres to reach the plateau pressure Pplat. The pressure returns to baseline during passive expiration At the beginning of the inspiratory cycle, the ventilator has to generate a pressure Pres to overcome the airway resistance. Note: No volume is delivered at this time. The pressure-time waveform is a reflection of the pressures generated within the airways during each phase of the ventilatory cycle. Diaphragm

13
Now let’s look at some different pressure-time waveforms using a ‘square wave’ flow pattern
Paw = Flow Resistance + Volume Compliance Scenario # 1 pressure Ppeak Normal values: Ppeak < 40 cm H2O Pplat < 30 cm H2O Pres < 10 cm H2O Pres Pplat Pres time flow ‘Square wave’ flow pattern time This is a normal pressure-time waveform With normal peak pressures ( Ppeak) ; plateau pressures (Pplat )and airway resistance pressures (Pres)
 ; plateau pressures (Pplat )and. airway resistance pressures (Pres)")
14
Waveform showing increased airways resistance
Paw = Flow Resistance + Volume + PEEP Compliance Scenario # 2 Normal Ppeak pressure e.g. ET tube blockage Pres Pplat Pres time flow ‘Square wave’ flow pattern time The increase in the peak airway pressure is driven entirely by an increase in the airways resistance pressure. Note the normal plateau pressure. This is an abnormal pressure-time waveform

15
Waveform showing increased airways resistance
‘Square wave’ flow pattern Ppeak Pplat Pres

16
Waveform showing high airway resistance due to high flow rates
Paw = Flow Resistance + Volume + PEEP Compliance Scenario # 3 Ppeak Normal pressure e.g. high flow rates Pres Pplat Pres time flow ‘Square wave’ flow pattern time Normal (low) flow rate This is an abnormal pressure-time waveform The increase in the peak airway pressure is driven entirely by an increase in the airways resistance pressure caused by excessive flow rates. Note the shortened inspiratory time and high flow
 flow rate. This is an abnormal pressure-time waveform. The increase in the peak airway pressure is driven. entirely by an increase in the airways resistance. pressure caused by excessive flow rates. Note the shortened inspiratory time and high flow.")
17
Waveform showing decreased lung compliance
Paw = Flow Resistance + Volume + PEEP Compliance Scenario # 4 e.g. ARDS Ppeak Normal pressure Pres Pplat Pres time flow ‘Square wave’ flow pattern time The increase in the peak airway pressure is driven entirely by the decrease in the lung compliance. Increased airways resistance is often also a part of this scenario. This is an abnormal pressure-time waveform

18
Waveform showing decreased lung compliance
‘Square wave’ flow pattern Ppeak Pplat Pres

19
Now lets look at the same pressure-time tracings using a ‘decelerating ramp’ flow pattern
Normal High Raw: (e.g. asthma) High PIP Normal PIP Normal Pplat Normal Pplat pressure High flow: (Note short Inspiratory time) High PIP Low CL: e.g. ARDS High PIP High Pplat Normal Pplat time
 High. PIP. Normal. PIP. Normal. Pplat. Normal. Pplat. pressure. High flow: (Note short. Inspiratory time) High. PIP. Low CL: e.g. ARDS. High. PIP. High. Pplat. Normal. Pplat. time.")
20
Now let us try to understand the practical aspects of ventilator waveform analysis in an interactive fashion.

21
Clinical applications of ventilator waveform analysis
Ventilator waveforms can be very useful in many different situations including: Diagnosing a ventilator that is ‘alarming’ Detecting obstructive flow patterns on the ventilator Detecting air trapping and dynamic hyperinflation Detecting lung overdistention Detecting respiratory circuit secretion build-up Detecting patient-ventilator interactions Dyssynchrony Double triggering Wasted efforts Flow starvation

22
Some ventilators with waveform displays
Puritan Bennett 840 Puritan Bennett 7200 Dräger Evita XL Siemens Servo 300A Bear 1000 series Respironics Esprit

23
Waveform selection on different ventilators
PB 840 Ventilator Select different waveforms Size adjustment Time scale Push to start waveforms

24
Waveform selection on different ventilators
Respironics Espirit ventilator Push to select waveforms

25
Waveform selection on different ventilators
Switch between waveforms Respironics Espirit ventilator Press to adjust size Switch between Loops and scalars

26
Variables that govern how a ventilator functions and interacts with the patient
Control variable ‘The Mode of Ventilation’ Pressure, flow, or volume controlled Limit Variable Volume, pressure or flow can be set to be constant or reach a maximum Triggering variable pressure, flow or volume sensing that initiates the vent cycle Cycle variable Pressure, volume, flow, or time that ends the inspiratory phase

27
So what waveforms should I be observing and analyzing?
Look at the waveforms that are varying based on the settings you have ordered

28
Mode of ventilation -> useful waveforms
Independent variables Dependent variables Waveforms that will be useful Waveforms that normally remain unchanged Volume Control/ Assist-Control Tidal volume, RR, Flow rate, PEEP, I/E ratio Paw Pressure-time:-> changes in Pip, Pplat Flow-time (expiratory): ->changes in compliance Pressure-volume loop:-> overdistension, optimal PEEP Volume-time Flow time (inspiratory) Flow-volume loop Pressure Control Paw, Inspiratory time (RR), PEEP and I/E ratio Vt, flow Volume-time and flow-time: -> changes in Vt and compliance Pressure-time Pressure support/ CPAP PS and PEEP Vt,and RR, flow, I/E Ratio Volume- time Flow- time (for Vt and VE) Vt=tidal volume; RR=respiratory rate; Paw=airway pressure; PEEP= positive end expiratory pressure; I/E ratio= inspiratory/expiratory time; VE= minute ventilation; Pip = Peak inspiratory pressure; Pplat = Plateau pressure
: ->changes in compliance. Pressure-volume loop:-> overdistension, optimal PEEP. Volume-time. Flow time (inspiratory) Flow-volume loop. Pressure Control. Paw, Inspiratory time (RR), PEEP and I/E ratio. Vt, flow. Volume-time and flow-time: -> changes in Vt and compliance. Pressure-time. Pressure support/ CPAP. PS and PEEP. Vt,and RR, flow, I/E Ratio. Volume- time. Flow- time. (for Vt and VE) Vt=tidal volume; RR=respiratory rate; Paw=airway pressure; PEEP= positive end expiratory pressure; I/E ratio= inspiratory/expiratory time; VE= minute ventilation; Pip = Peak inspiratory pressure; Pplat = Plateau pressure.")
29
Waveforms to observe during volume assist control ventilation
Pressure-time waveform: Affected by patient effort and changes in resistance and compliance Flow-time waveform: Expiratory flow is not fixed, waveform is dependent on elastic recoil pressure of respiratory system/patient effort Therefore this scalar is nearly always of interest

30
Waveforms to observe during pressure targeted ventilation: PCV
Pressure-time waveform usually will not change Flow-time and volume-time waveform will be affected by changes in compliance, resistance and the patient’s respiratory muscle strength (independent variables)
")
31
Now let us begin riding the ‘waves’ by looking at a few ventilator waveforms!

32
Basic ventilator waveforms
Mode of ventilation: Assist/control – square wave flow Airway pressures: dependent on lung compliance, tidal volume and flow (dependent variable) Tidal volumes, respiratory rate: ventilator controlled Flow pattern: ventilator controlled (square wave pattern) Inspiratory time: ventilator controlled Waveforms shown: flow-time and pressure-time
 Tidal volumes, respiratory rate: ventilator controlled. Flow pattern: ventilator controlled (square wave pattern) Inspiratory time: ventilator controlled. Waveforms shown: flow-time and pressure-time.")
33
Square wave volume assist/control mode
Any abnormalities? : No PEARL: always look at both inspiratory and expiratory arms of the flow-time waveform. Make it a habit!

34
Basic ventilator waveforms
Mode of ventilation: Assist/control – decelerating flow pattern Airway pressures: dependent on lung compliance, tidal volume and flow (dependent variable) Tidal volumes, respiratory rate: ventilator controlled Flow pattern: ventilator controlled (decelerating wave pattern) Inspiratory time: ventilator controlled Waveforms shown: flow-time and pressure-time
 Tidal volumes, respiratory rate: ventilator controlled. Flow pattern: ventilator controlled (decelerating wave pattern) Inspiratory time: ventilator controlled. Waveforms shown: flow-time and pressure-time.")
35
Decelerating flow volume assist/control mode
Any abnormalities? : No PEARL: At similar flow rates, the inspiratory time is shorter (and peak pressures higher) for the square wave flow as compared to the decelerating flow pattern.
 for the square wave flow as compared to the decelerating flow pattern.")
36
Basic ventilator waveforms
Mode of ventilation: CPAP + PS Airway pressures: patient controlled (indirectly through control of volume and flow) Flow pattern: patient controlled Inspiratory time, respiratory rate: patient controlled Waveforms shown: flow-time and volume-time
 Flow pattern: patient controlled. Inspiratory time, respiratory rate: patient controlled. Waveforms shown: flow-time and volume-time.")
37
CPAP with Pressure Support
Any abnormalities?: No PEARL: notice how each breath differs in flow pattern and tidal volume.

38
Basic ventilator waveforms
Mode of ventilation: pressure control ventilation (PCV) Airway pressures: ventilator controlled Respiratory rate: ventilator controlled Tidal Volumes: dependent variable (lung compliance) Flow rates: ventilator controlled (decelerating in this instance) Waveforms shown: flow-time and volume-time
 Airway pressures: ventilator controlled. Respiratory rate: ventilator controlled. Tidal Volumes: dependent variable (lung compliance) Flow rates: ventilator controlled (decelerating in this instance) Waveforms shown: flow-time and volume-time.")
39
Pressure Assist/Control – Decelerating Flow
Any abnormalities? : No PEARL: tidal volumes and flow rates are determined by lung compliance. Increasing inspiratory time beyond a certain point will only decrease expiratory time, without any increases in tidal volumes achieved.

40
Let us now shift gears and see how waveforms can help us recognize some common ventilator related problems!

42
Let us briefly revisit the flow-time waveform
As previously noted, the flow-time waveform has both an inspiratory and an expiratory arm. The expiratory arm is passive in nature and its character is determined by: the elastic recoil of the lungs the airways resistance and any respiratory muscle effort made by the patient during expiration (due to patient-ventilator interaction/dys=synchrony) The expiratory arm can be thought of in some ways as passive bedside spirometry. It should always be looked at as part of any waveform analysis and can be diagnostic of various conditions like COPD, auto-PEEP, wasted efforts, overdistention etc.
 The expiratory arm can be thought of in some ways as passive bedside spirometry. It should always be looked at as part of any waveform analysis and can be diagnostic of various conditions like COPD, auto-PEEP, wasted efforts, overdistention etc.")
43
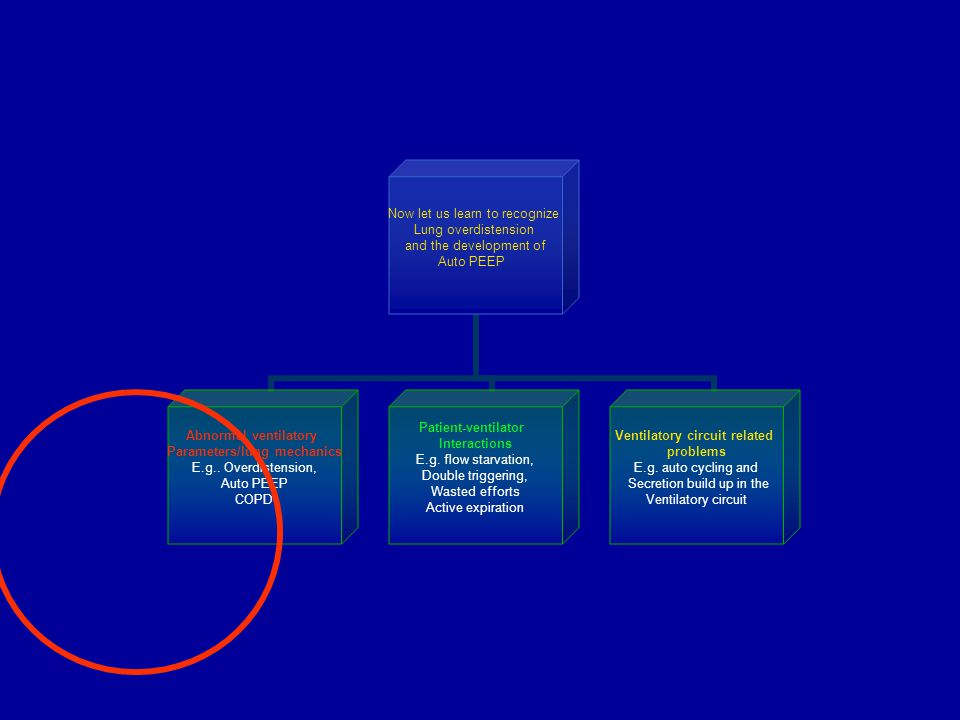
Recognizing Lung Overdistension

44
Recognizing lung overdistension
Suspect this when: There are high peak and plateau Pressures… Accompanied by high expiratory Flow rates The pressure-time waveform Shows an abrupt increase in Pressure. PEARL: Think of right mainstem intubation, low lung compliance (e.g. ARDS), excessive tidal volumes etc
, excessive tidal volumes etc.")
45
The pressure-volume loop can tell us a lot about lung physiology!
Compliance (C) is markedly reduced in the injured lung on the right as compared to the normal lung on the left Normal lung Upper inflection point (UIP) above this pressure, additional alveolar recruitment requires disproportionate increases in applied airway pressure ARDS Lower inflection point (LIP) Can be thought of as the minimum baseline pressure (PEEP) needed for optimal alveolar recruitment
 is markedly reduced in the. injured lung on the right as. compared. to the normal lung. on the left. Normal. lung. Upper inflection point (UIP) above this pressure, additional alveolar recruitment. requires disproportionate. increases. in applied airway pressure. ARDS. Lower inflection point (LIP) Can be thought of as the. minimum. baseline pressure (PEEP) needed for optimal. alveolar recruitment.")
46
Observe a pressure-volume loop illustrating the concept of overdistension
Peak Inspiratory pressure Upper Inflection point Lower Inflection point

47
Lung overdistension based on pressure-volume loops

48
Recognizing Auto-PEEP

49
Detecting Auto-PEEP Recognize Auto-PEEP when Expiratory flow continues
and fails to return to the baseline prior to the new inspiratory cycle

50
The development of auto- PEEP over several breaths in a simulation
Notice how the expiratory flow fails to return to the baseline causing progressive air trapping Also notice how the progressive air trapping causes a gradual increase in airway pressures due to decreasing compliance

51
Development of auto-PEEP
Notice how the expiratory flow fails to return to the baseline causing progressive air trapping Click here to watch video Also notice how the progressive air trapping causes a gradual increase in airway pressures because of decreasing compliance

52
Understanding how flow rates affect I/E ratios and the development of auto PEEP
Decreasing the flow rate Increase the inspiratory time and consequently decrease the expiratory time (decreased I/E ratio) Thus allowing only incomplete emptying of the lung and the development of air trapping and auto-PEEP Lluis Blanch MD, PhD et al: Respiratory Care Jan 2005 Vol 50 No 1
 Thus allowing only incomplete emptying. of the lung and the development. of air trapping and auto-PEEP. Lluis Blanch MD, PhD et al: Respiratory Care Jan 2005 Vol 50 No 1.")
53
Understanding how inspiratory time affect I/E ratios and the development of auto-PEEP
In a similar fashion, an increase in inspiratory time can also cause a decrease in the I: E ratio and favor the development of auto-PEEP by not allowing enough time for complete lung emptying between breaths. Watch in the next video how auto-PEEP develops in a patient on Pressure control ventilation at a RR of 20, just by increasing the inspiratory time from 0.85 sec to 1.0 sec (no auto-PEEP develops) and then to 1.5 sec (development of auto PEEP)
 and then to 1.5 sec (development of auto PEEP)")
54
Ventilator settings before and after the development of auto-PEEP
Mode of ventilation: PCV ( pressure control ventilation) Waveforms depicted: flow-time and pressure-time Pressure support: 15cm/H2O with PEEP of 5 cm/H2O Respiratory rate: 20 bpm Ventilator settings Initial Subsequently Final settings Inspiratory time 0.85 sec 1.0 sec 1.5 sec Expiratory time 2.15 sec 2.0 sec I : E ratio 1 : 2.5 1: 2 1: 1 Auto PEEP No Yes
 Waveforms depicted: flow-time and pressure-time. Pressure support: 15cm/H2O with PEEP of 5 cm/H2O. Respiratory rate: 20 bpm. Ventilator. settings. Initial. Subsequently. Final settings. Inspiratory time sec. 1.0 sec. 1.5 sec. Expiratory time sec. 2.0 sec. I : E ratio. 1 : : 2. 1: 1. Auto PEEP. No. Yes.")
55
Development of auto-PEEP with inadequate expiratory time
Click here to watch video

56
Recognizing Expiratory Flow Limitation (e.g. COPD, asthma)
")
57
Recognizing prolonged expiration (air trapping)
Recognize Airway obstruction when Expiratory flow quickly tapers off and then enters a prolonged low-flow state without returning to baseline (auto- PEEP) This is classic for the flow limitation and decreased lung elastance characteristic of COPD or status asthmaticus
 This is classic for the flow. limitation and decreased lung. elastance characteristic of COPD. or status asthmaticus.")
59
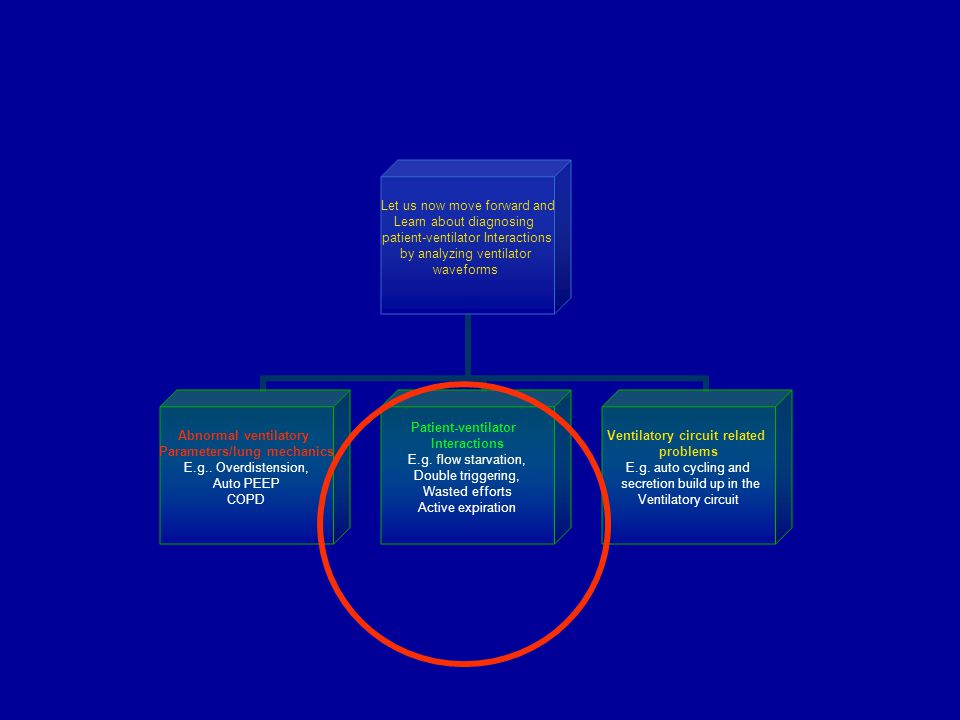
Recognizing: Wasted efforts Double triggering Flow starvation Active expiration

60
Recognizing ineffective/wasted patient effort
Patient inspiratory effort fails to trigger vent cycle resulting in a wasted effort Results in fatigue, tachycardia, Increased metabolic needs, Fever etc

61
Recognizing double triggering
High peak airway pressures and double the inspiratory volume Continued patient inspiratory efforts through the end of a delivered breath cause the ventilator to cycle again and deliver a 2nd breath on top of the first breath that has still not been completely exhaled. This results in high lung volumes and pressures. Consider switching mode, increasing sedation, or neuromuscular paralysis as appropriate

62
Another example of double triggering

63
Recognizing flow starvation
Look at the pressure-time waveform If you see this kind of scooping or distortion instead of a smooth rise in the pressure curve…. Diagnose flow starvation in the setting of patient discomfort, fatigue, dyspnea etc on the vent

64
Recognizing active expiration
Look at the flow-time & pressure-time Waveform In this situation, the patient is making active expiratory efforts during the inspiratory phase of the ventilator delivered breath cycle Notice how the expiratory flow and the pressure rise dramatically as a result of the opposing forces at work

66
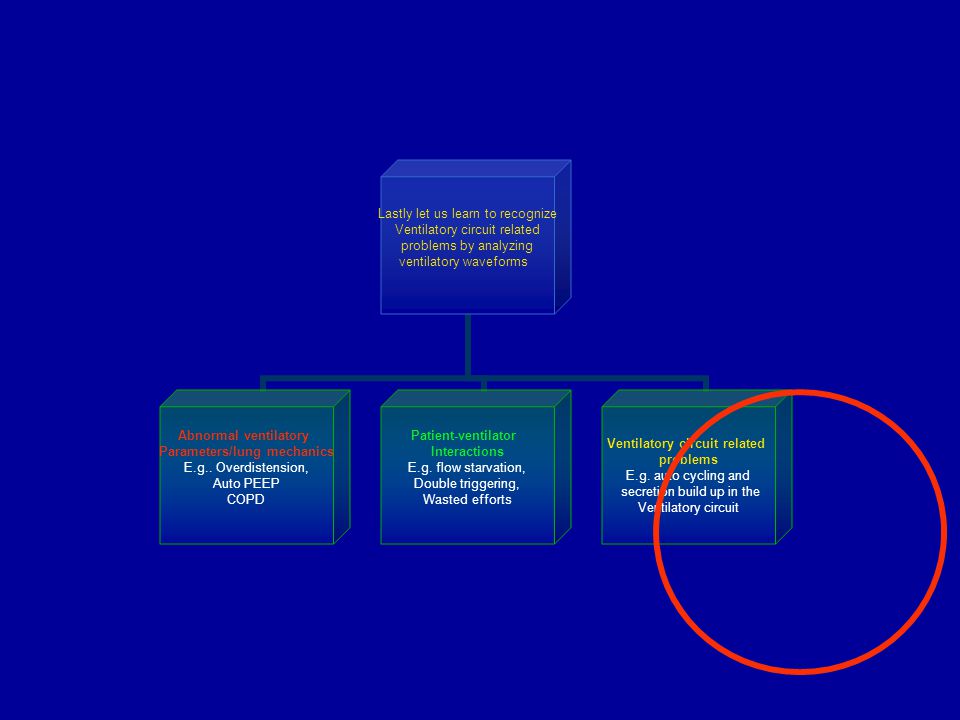
Recognizing Airway Secretions & Ventilator Auto-Cycling

67
Recognizing airway or tubing secretions
Normal flow-volume loop Flow volume loop showing a ‘saw tooth’ pattern typical of retained secretions

68
Characteristic scalars due to secretion build up in the tubing circuit

69
Recognizing ventilator auto-cycling
Think about auto-cycling when the respiratory rate increases suddenly without any patient input and if the exhaled tidal volume and minute ventilation suddenly decrease. Typically occurs because of a leak anywhere in the system starting from the ventilator right up to the patients lungs e.g. leaks in the circuit, ET tube cuff leak, lungs (pneumothorax) May also result from condensate in the circuit The exhaled tidal volume will be lower than the set parameters and this may set off a ventilator alarm for low exhaled tidal volume, low minute ventilation, circuit disconnect or rapid respiratory rate.
 May also result from condensate in the circuit. The exhaled tidal volume will be lower than the set parameters and this may set off a ventilator alarm for low exhaled tidal volume, low minute ventilation, circuit disconnect or rapid respiratory rate.")
70
Waveform video showing the ventilator ‘auto cycling’
Click here to watch video

71
Take home points Ventilator waveform analysis is a very integral and important component in the management of a mechanically ventilated patient. Develop a habit of looking at the right waveform for the given mode that the patient is being ventilated on. Always look at the inspiratory and expiratory components of the flow-time waveform. Don’t hesitate to change the scale or speed of the waveform to aid in your interpretation.

72
Additional links Follow these links for more waveform videos:
Auto-PEEP Autocycling Excessive airway secretions: Flow starvation

Similar presentations