Download presentation
Presentation is loading. Please wait.

16
Fig-1: The sympathetic ganglia associated with spinal nerves T1 through L2 are connected to the nerve by two arms, the rami communicantes albicans and gresium Fig-2: There are no rami albicans above T1 and below L2. The gray rami send connections to all 31 nerves. Fig-3: The sympathetic outflow. The preganglionic neurons originate in the intermediolateral horn of the spinal cord, between T1 and L2

30
pressione Frequenza di scarica 100 Pressione continua Pressione pulsatile soglia saturazione Dinamica dei barocettori: scarica del nervo di Hering

31
pressione Frequenza di scarica 100 Dinamica dei barocettori: adattamento 120

35
Figure 1. Ultrastructure of the carotid body. (A) Reproduction of the original drawing of Fernando de Castro published in De Castro (1926), part of the Fernando de Castro Archives. Different glomeruli are shown close to the carotid artery (A). Incoming sympathetic nerve from the superior cervical ganglion (E) is a minor contribution to the innervation of the carotid body. The same can be said about the vagus nerve (LX) in the vicinity of the carotid body. By contrast, the most relevant contingent of afferents comes from the intercarotid (sinus) nerve branch of the glossopharyngeal nerve (IX). A sympathetic microganglion can be seen within the latter nerve (cg). Adapted, with permission, from (191) by de Castro.
 Reproduction of the original drawing of Fernando de Castro published in De Castro (1926), part of the Fernando de Castro Archives. Different glomeruli are shown close to the carotid artery (A). Incoming sympathetic nerve from the superior cervical ganglion (E) is a minor contribution to the innervation of the carotid body. The same can be said about the vagus nerve (LX) in the vicinity of the carotid body. By contrast, the most relevant contingent of afferents comes from the intercarotid (sinus) nerve branch of the glossopharyngeal nerve (IX). A sympathetic microganglion can be seen within the latter nerve (cg). Adapted, with permission, from (191) by de Castro..")
36
Figure 5. Relationship between arterial and microvascular Po 2 and consequence upon chemodischarge response curves. (A) Relationship between Pao 2 and carotid body microvascular (CBM) Po 2. O 2 pressure in inspired gas was lowered in steps. At each step, Pao 2, chemosensory nerve activity and phosphorescence images were measured ca. 3 min after end tidal gas values stabilized. Average CBM Po 2 was calculated for central region of O 2 pressure map of carotid body and this is plotted against measured Pao 2. Top: data from six cats are presented. Each cat has a different symbol. Below: data from all six cats are fitted to single curve (line of identity also shown). (B) Relationship between Po 2 (arterial and CBM) and chemosensory nerve activity. Measured values of chemosensory nerve activity in four different cats are plotted against Pao 2 (open circles) and CBM Po 2 (filled circles). imp/s, impulses per second. Modified, with permission, from (502) Lahiri et al.
 Relationship between Pao 2 and carotid body microvascular (CBM) Po 2. O 2 pressure in inspired gas was lowered in steps. At each step, Pao 2, chemosensory nerve activity and phosphorescence images were measured ca. 3 min after end tidal gas values stabilized. Average CBM Po 2 was calculated for central region of O 2 pressure map of carotid body and this is plotted against measured Pao 2. Top: data from six cats are presented. Each cat has a different symbol. Below: data from all six cats are fitted to single curve (line of identity also shown). (B) Relationship between Po 2 (arterial and CBM) and chemosensory nerve activity. Measured values of chemosensory nerve activity in four different cats are plotted against Pao 2 (open circles) and CBM Po 2 (filled circles). imp/s, impulses per second. Modified, with permission, from (502) Lahiri et al..")
42
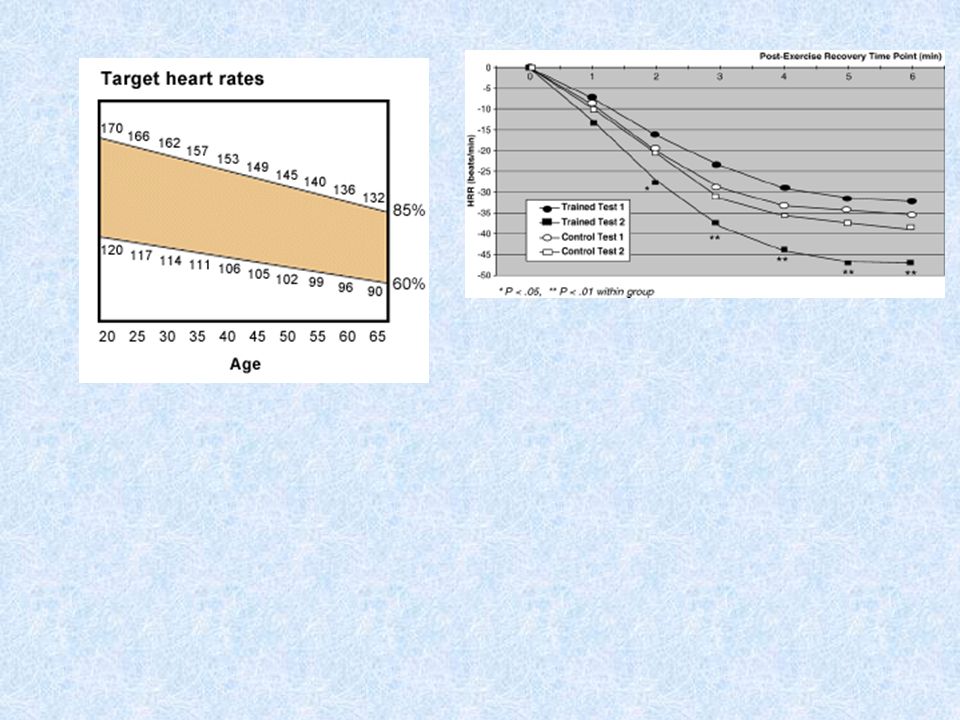
To determine your rate of recovery, use the following formula: Recovery heart rate = (exercise heart rate - recovery heart rate after 1 minute) / 10 Recovery Rate Number Condition Less than 2 = Poor 2 to 2.9 = Fair 3 to 3.9 = Good 4 to 5.9 = Excellent Above 6 = Outstanding
 / 10 Recovery Rate Number Condition Less than 2 = Poor 2 to 2.9 = Fair 3 to 3.9 = Good 4 to 5.9 = Excellent Above 6 = Outstanding")
Similar presentations


 Lec 8 & 9. Differences between Somatic & Autonomic Nervous system.>")


 2. visceral motor neurons (2) A) preganglionic B) postganglionic 3. autonomic ganglion.>")


 The ANS consists of motor neurons that: –Innervate smooth and cardiac muscle and.>")


>")


