Download presentation
Presentation is loading. Please wait.

1
Orientation Training for West Virginia Schools and School Systems
Office of Education Performance Audits

2
Accreditation/Accountability
Opening Comments Session Introduction Accreditation/Accountability Dr. Gus Penix Director, OEPA

3
Materials and Procedures
a copy of today’s agenda a copy of Policy 2322 a copy of today’s Power Point, and an Orientation Training Booklet Procedures Large Group Discussion and Questions Agenda Timelines

4
TODAY’S PURPOSE The purpose of today’s presentation is to introduce you to: the newly adopted Policy 2320, the new accreditation process, and the School Monitoring Report.

5
Historical Perspective of Policy 2320
Section 2: Historical Perspective of Policy 2320 Dr. Donna Davis Deputy Director, OEPA

6
Background WV Constitution charges the WVBE with the general supervision of public schools; this policy provides for this. The policy is impacted by Resolution of the landmark case of Pauley vs. Bailey and led to “A Process for Improving Education,” the blueprint for WV’s standards-based accountability system. This blueprint led to adoption of WV Code §18-2E-5 by the WV Legislature. In 2013, SB 359 gave the WVBE authority to redefine sections of §18-2E-5 that impact school accreditation and accountability. The new Policy (which repeals and replaces the former) is a result of the Governor’s leadership, direction from the WVBE Committee on Accountability, and input Stakeholders
 is a result of the Governor’s leadership, direction from the WVBE Committee on Accountability, and input Stakeholders.")
7
Standards-Based Accountability System
Accreditation

8
Overview of Policy Sections
Rationale for Aligning Accountability and Accreditation Overview of Policy Sections Gus Penix Director, OEPA

9
NEW ACCREDITATION SYSTEM
The WVBE approved a new policy for accrediting WV’s schools and approving school systems, Policy 2320. The new policy is the result of changes to WV Code §18-2E-5 in SB359. These Code changes provided opportunity to align the accountability system (what’s expected of schools) with the accreditation system (how schools are rated). This alignment placed a statewide emphasis on the improvement of student achievement in ALL schools.
 with. the accreditation system (how schools are rated). This alignment placed a statewide emphasis on the improvement of student achievement in ALL schools.")
10
Characteristics of the New Policy
There are six major characteristics of the new policy: (1) improving student performance, (2) clearly communicating the level of school quality, (3) focusing on all schools, (4) purpose – quality and self-improvement, (5) emphasizing local control and accountability, and (6) differentiating supports, consequences, and rewards.
 improving student performance, (2) clearly communicating the level of school quality, (3) focusing on all schools, (4) purpose – quality and self-improvement, (5) emphasizing local control and accountability, and (6) differentiating supports, consequences, and rewards.")
11
WVBE BELIEFS All students deserve quality educational programs.
WV’s national rankings have declined. Those rankings must change. Every school has a responsibility to improve. The WVBE is committed to fulfilling its constitutional responsibilities in providing a quality education for all students through a system that monitors student performance outcomes and continuous improvement in schools.

12
Old and New Accreditation
RATIONALE – Eliminate Multiple Rating Systems: Old - Schools received two different ratings. New - Schools receive one rating. RATIONALE – Create a System that Promotes Student Performance: OLD - Focused school accreditation ratings on self-reported compliance. NEW – Focuses on student performance measures.

13
Old and New Accreditation
RATIONALE – Use Language that is Easily Understood to Communicate School Quality: OLD - Language was not easily understood. NEW - Language is clearly understood. RATIONALE – Focus on Improvement of All Schools: OLD - Only low performing schools received reviews. NEW - All schools receive a cyclical review every four years.

14
“What gets measured gets done.” “What gets monitored gets done well.”
WVBE EXPECTATIONS Improve student performance. Align accountability and accreditation systems. Incentivize school improvement in all schools. Hold schools accountable for creating quality school and classroom conditions. Create a clear public reporting system. Create a unified school recognition program to recognize growth and performance. Enhance local control. Address requirements of §18-2E-5 to create a thorough and efficient system of public education. “What gets measured gets done.” “What gets monitored gets done well.”

15
Policy 2320 Sections Section 4 – Glossary
Section 7 – School System Approval Section 10 – Rewards and Recognitions Section 11 – Needs analysis, Capacity Building and Efficiencies. Section 12 – Communication of Performance Grades and Approval Levels Section 13 – Operation of the OEPA Section 14 – General Appeals Procedures Section 15 – Severability

16
Section 3: Premises and Purposes Bill Niday Consultant, OEPA

17
Section 3: Premises and Purposes
All children can learn. The primary measure of an effective school is the quality and equity of student outcomes. The level of quality and equity must be public knowledge. The school is the unit of change. The capacity for excellence resides in every school.

18
Premises and Purposes Purposes
Establishing standards and performance measures Holding schools and school systems accountable Implementing a system of public notification Evaluating educational progress Ensuring equity of opportunity

19
Premises and Purposes Purposes
Providing a mechanism for continuous improvement Defining a system of supports and consequences Creating a recognition and reward process Aiding the Governor, Legislature, and WVBE in decision-making

20
WV Accountability System Associate Superintendent, WVDE
Section 5: WV Accountability System Robert Hull Associate Superintendent, WVDE

21
Policy 2320, A Process for Improving Education: Performance Based Accreditation System
In January 2014, as part of his State-of-the-State Address, Governor Tomblin asked the WV Board of Education to establish a simple A-F School Grading System. The WVBOE, working with the WVDE and WVOEPA, developed a system that unites school accountability and school and district accreditation into a single process. Policy 2320 was placed for public comment on April 9, 2014 and approved on May 14, 2014 to become effective July 1, 2014. Schools will receive their first A-F grade for the school year based on the data from the assessment.

22
Policy 2320, A Process for Improving Education: Performance Based Accreditation System
The WVDE will compile the data and assign each school a grade based upon the criteria set by the WVBOE. The OEPA will review the results of the school audits to verify the grades can be assigned without modification and report them to the WVBOE. The WVBOE will accept and officially release the school grades. High performing schools will be recognized and low performing schools will receive supports and assistance.

23
Measuring What We Value in West Virginia
Policy 2320, A Process for Improving Education: Performance Based Accreditation System Measuring What We Value in West Virginia All students learning All students showing significant improvement rather than just incremental improvement All students exhibiting growth at a rate that moves them to proficiency over time All students performing at their highest levels Accelerating the growth of those lowest performing students

24
Policy 2320, A Process for Improving Education: Performance Based Accreditation System
Grading Components Achievement: Includes student proficiency in mathematics and reading/language arts. Student growth: Includes how much students are growing (observed) and how much students are on track to be proficient (adequate). Performance of Lowest 25%: Includes the accelerated improvement of the lowest 25% of students in each school. Graduation rates for high schools: High schools will be awarded points based on each school’s four-year and five-year adjusted cohort graduation rates.
 and how much students are on track to be proficient (adequate). Performance of Lowest 25%: Includes the accelerated improvement of the lowest 25% of students in each school. Graduation rates for high schools: High schools will be awarded points based on each school’s four-year and five-year adjusted cohort graduation rates.")
25
Policy 2320, A Process for Improving Education: Performance Based Accreditation System
Grade Designations A = distinctive student proficiency B = commendable student proficiency C = acceptable student proficiency D = unacceptable student proficiency F = lowest student proficiency

26
Elementary/Middle Schools
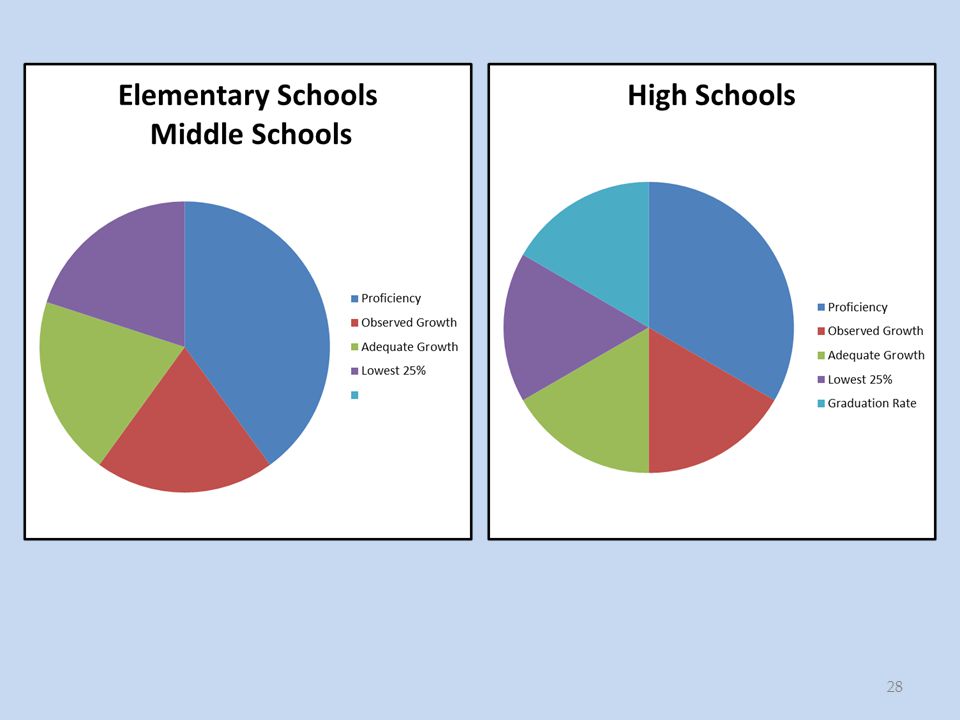
Policy 2320, A Process for Improving Education: Performance Based Accreditation System Elementary/Middle Schools High Schools Math Proficiency 200 points Reading Proficiency Math Observed Growth 100 points Reading Observed Growth Math Adequate Growth Reading Adequate Growth Accelerated Performance of the Lowest 25% in Math Accelerated Performance of the Lowest 25% in Reading 4-Year Graduation Rate 5-Year Graduation Rate Total Points 1000 points 1200 points

27
Policy 2320, A Process for Improving Education: Performance Based Accreditation System
Letter Grade Description Elementary/ Middle School Score on the WVAS High School Score on the WVAS A Distinctive proficiency B Commendable proficiency C Acceptable proficiency D Unacceptable proficiency F Lowest proficiency <400 <480 *Please note these score bands are for illustrative purposes only. A formal standard setting process will be conducted to establish the initial cut scores. Cut scores will be reviewed annually and revised as necessary. Grade Assignment

29
Results: Math Not Proficient (53%) Proficient (47%)
27% are Catching Up 64% are Keeping Up 73% are Falling Behind 36% are

30
Results: RLA Not Proficient (50%) Proficient (50%) 32% are Catching Up
70% are Keeping Up 68% are Falling Behind 30% are

32
Policy 2320, A Process for Improving Education: Performance Based Accreditation System
Proficiency Rates 200 points based on % proficient in Math 200 points based on % proficient in E/LA Observed Growth 100 points based on % of students exhibiting at least typical growth in Math 100 points based on % of students exhibiting at least typical growth in E/LA Adequate Growth 100 points based on % of students meeting or exceeding growth target in Math 100 points based on % of students meeting or exceeding growth target in E/LA Lowest 25%: bottom quartile of students in the school 100 points based on the % of students in the bottom 25% exhibiting high growth in Math 100 points based on the % of students in the bottom 25% exhibiting high growth in E/LA Graduation Rates for High School 100 points based on % of students graduating in the 4-year cohort 100 points based on % of students graduating in the 5-year cohort

33
Sample Scenarios Elementary Schools

34
Elementary Schools School 1 – Blooming Rose Elementary School
Overall high performing school Overall high growth school School 2 – Trailing Vine Elementary School Moderately performing school Moderate observed growth Low adequate growth Lower performing lowest 25% School 3 – Briar Patch Elementary Schools Overall low performing school Overall low growth school

35
Blooming Rose Elementary School
Overall high performing school Overall high growth school Component % Points Possible Points Earned % Proficiency in Math 75% 200 150 % Proficiency in E/LA 72% 144 Observed Growth in Math (% typical or higher) 56% 100 56 Observed Growth in E/LA (% typical or higher) 55% 55 Adequate Growth in Math (% meeting or exceeding target) 65% 65 Adequate Growth in E/LA (% meeting or exceeding target) 67% 67 Accelerated Growth of Lowest 25% in Math (% high growth) 59% 59 Accelerated Growth of Lowest 25% in E/LA (% high growth) 62% 62 TOTAL 1000 658
 56% Observed Growth in E/LA (% typical or higher) 55% 55. Adequate Growth in Math (% meeting or exceeding target) 65% 65. Adequate Growth in E/LA (% meeting or exceeding target) 67% 67. Accelerated Growth of Lowest 25% in Math (% high growth) 59% 59. Accelerated Growth of Lowest 25% in E/LA (% high growth) 62% 62. TOTAL")
36
Trailing Vine Elementary School
Moderately performing school Moderate observed growth Low adequate growth Lower performing bottom 25% Component % Points Possible Points Earned % Proficiency in Math 48% 200 96 % Proficiency in E/LA 55% 110 Observed Growth in Math (% typical or higher) 45% 100 45 Observed Growth in E/LA (% typical or higher) 49% 49 Adequate Growth in Math (% meeting or exceeding target) 40% 40 Adequate Growth in E/LA (% meeting or exceeding target) 42% 42 Accelerated Growth of Lowest 25% in Math (% high growth) 41% 41 Accelerated Growth of Lowest 25% in E/LA (% high growth) 48 TOTAL 1000 471
 45% Observed Growth in E/LA (% typical or higher) 49% 49. Adequate Growth in Math (% meeting or exceeding target) 40% 40. Adequate Growth in E/LA (% meeting or exceeding target) 42% 42. Accelerated Growth of Lowest 25% in Math (% high growth) 41% 41. Accelerated Growth of Lowest 25% in E/LA (% high growth) 48. TOTAL")
37
Briar Patch Elementary School
Overall low performing school Overall low growth school Component % Points Possible Points Earned % Proficiency in Math 35% 200 70 % Proficiency in E/LA 37% 74 Observed Growth in Math (% typical or higher) 40% 100 40 Observed Growth in E/LA (% typical or higher) 44% 44 Adequate Growth in Math (% meeting or exceeding target) 35 Adequate Growth in E/LA (% meeting or exceeding target) 37 Accelerated Growth of Lowest 25% in Math (% high growth) 25% 25 Accelerated Growth of Lowest 25% in E/LA (% high growth) 22% 22 TOTAL 1000 347
 40% Observed Growth in E/LA (% typical or higher) 44% 44. Adequate Growth in Math (% meeting or exceeding target) 35. Adequate Growth in E/LA (% meeting or exceeding target) 37. Accelerated Growth of Lowest 25% in Math (% high growth) 25% 25. Accelerated Growth of Lowest 25% in E/LA (% high growth) 22% 22. TOTAL")
38
Sample Scenarios MIDDLE Schools

39
Middle Schools Hickory Middle School Walnut Middle School
Overall high performing school Overall high growth school Walnut Middle School Moderately performing school Moderate observed growth Low adequate growth Lower performing bottom 25% Oak Middle School Overall low performing school Overall low growth school

40
Hickory Middle School Overall high performing school
Overall high growth school Component % Points Possible Points Earned % Proficiency in Math 70% 200 140 % Proficiency in E/LA 72% 144 Observed Growth in Math (% typical or higher) 62% 100 62 Observed Growth in E/LA (% typical or higher) 65% 65 Adequate Growth in Math (% meeting or exceeding target) 57% 57 Adequate Growth in E/LA (% meeting or exceeding target) 60% 60 Accelerated Growth of Lowest 25% in Math (% high growth) Accelerated Growth of Lowest 25% in E/LA (% high growth) 61% 61 TOTAL 1000 654
 62% Observed Growth in E/LA (% typical or higher) 65% 65. Adequate Growth in Math (% meeting or exceeding target) 57% 57. Adequate Growth in E/LA (% meeting or exceeding target) 60% 60. Accelerated Growth of Lowest 25% in Math (% high growth) Accelerated Growth of Lowest 25% in E/LA (% high growth) 61% 61. TOTAL")
41
Walnut Middle School Moderately performing school
Moderate observed growth Moderate adequate growth Lower performing bottom 25% Component % Points Possible Points Earned % Proficiency in Math 55% 200 110 % Proficiency in E/LA 48% 96 Observed Growth in Math (% typical or higher) 46% 100 46 Observed Growth in E/LA (% typical or higher) 50% 50 Adequate Growth in Math (% meeting or exceeding target) Adequate Growth in E/LA (% meeting or exceeding target) Accelerated Growth of Lowest 25% in Math (% high growth) 39% 39 Accelerated Growth of Lowest 25% in E/LA (% high growth) 42% 42 TOTAL 1000 479
 46% Observed Growth in E/LA (% typical or higher) 50% 50. Adequate Growth in Math (% meeting or exceeding target) Adequate Growth in E/LA (% meeting or exceeding target) Accelerated Growth of Lowest 25% in Math (% high growth) 39% 39. Accelerated Growth of Lowest 25% in E/LA (% high growth) 42% 42. TOTAL")
42
Oak Middle School Overall low performing school
Overall low growth school Component % Points Possible Points Earned % Proficiency in Math 36% 200 72 % Proficiency in E/LA 39% 78 Observed Growth in Math (% typical or higher) 45% 100 45 Observed Growth in E/LA (% typical or higher) 42% 42 Adequate Growth in Math (% meeting or exceeding target) 25% 25 Adequate Growth in E/LA (% meeting or exceeding target) 27% 27 Accelerated Growth of Lowest 25% in Math (% high growth) 19% 19 Accelerated Growth of Lowest 25% in E/LA (% high growth) 22% 22 TOTAL 1000 330
 45% Observed Growth in E/LA (% typical or higher) 42% 42. Adequate Growth in Math (% meeting or exceeding target) 25% 25. Adequate Growth in E/LA (% meeting or exceeding target) 27% 27. Accelerated Growth of Lowest 25% in Math (% high growth) 19% 19. Accelerated Growth of Lowest 25% in E/LA (% high growth) 22% 22. TOTAL")
43
Sample Scenarios High Schools

44
High Schools Evergreen High School Hemlock High School
Overall high performing school Overall high growth school High graduation rates Hemlock High School Moderately performing school Moderately high observed growth Low adequate growth Lower performing bottom 25% Moderate graduation rates Redwood High School Overall low performing school Overall low growth school Low graduation rates

45
Evergreen High School Overall high performing school
Overall high growth school High graduation rates Component % Points Possible Points Earned % Proficiency in Math 70% 200 140 % Proficiency in E/LA 72% 144 Observed Growth in Math (% typical or higher) 62% 100 62 Observed Growth in E/LA (% typical or higher) 65% 65 Adequate Growth in Math (% meeting or exceeding target) 57% 57 Adequate Growth in E/LA (% meeting or exceeding target) 60% 60 Accelerated Growth of Lowest 25% in Math (% high growth) Accelerated Growth of Lowest 25% in E/LA (% high growth) 61% 61 4-Year Adjusted Cohort Graduation Rate 88% 88 5-Year Adjusted Cohort Graduation Rate 92% 92 TOTAL 1200 834
 62% Observed Growth in E/LA (% typical or higher) 65% 65. Adequate Growth in Math (% meeting or exceeding target) 57% 57. Adequate Growth in E/LA (% meeting or exceeding target) 60% 60. Accelerated Growth of Lowest 25% in Math (% high growth) Accelerated Growth of Lowest 25% in E/LA (% high growth) 61% Year Adjusted Cohort Graduation Rate. 88% Year Adjusted Cohort Graduation Rate. 92% 92. TOTAL")
46
Hemlock High School Component % Points Possible Points Earned
Moderately performing school Lower performing bottom 25% Moderately high observed growth Moderate graduation rates Low adequate growth Component % Points Possible Points Earned % Proficiency in Math 55% 200 110 % Proficiency in E/LA 50% 100 Observed Growth in Math (% typical or higher) 62% 62 Observed Growth in E/LA (% typical or higher) 65% 65 Adequate Growth in Math (% meeting or exceeding target) 36% 36 Adequate Growth in E/LA (% meeting or exceeding target) 33% 33 Accelerated Growth of Lowest 25% in Math (% high growth) 30% 30 Accelerated Growth of Lowest 25% in E/LA (% high growth) 4-Year Adjusted Cohort Graduation Rate 79% 79 5-Year Adjusted Cohort Graduation Rate 83% 83 TOTAL 1200 628
 62% 62. Observed Growth in E/LA (% typical or higher) 65% 65. Adequate Growth in Math (% meeting or exceeding target) 36% 36. Adequate Growth in E/LA (% meeting or exceeding target) 33% 33. Accelerated Growth of Lowest 25% in Math (% high growth) 30% 30. Accelerated Growth of Lowest 25% in E/LA (% high growth) 4-Year Adjusted Cohort Graduation Rate. 79% Year Adjusted Cohort Graduation Rate. 83% 83. TOTAL")
47
Redwood High School Overall low performing school
Overall low growth school Low graduation rates Component % Points Possible Points Earned % Proficiency in Math 35% 200 70 % Proficiency in E/LA 33% 66 Observed Growth in Math (% typical or higher) 100 35 Observed Growth in E/LA (% typical or higher) 39% 39 Adequate Growth in Math (% meeting or exceeding target) 27% 27 Adequate Growth in E/LA (% meeting or exceeding target) 25% 25 Accelerated Growth of Lowest 25% in Math (% high growth) 20% 20 Accelerated Growth of Lowest 25% in E/LA (% high growth) 21% 21 4-Year Adjusted Cohort Graduation Rate 74% 74 5-Year Adjusted Cohort Graduation Rate 79% 79 TOTAL 1200 456
 Observed Growth in E/LA (% typical or higher) 39% 39. Adequate Growth in Math (% meeting or exceeding target) 27% 27. Adequate Growth in E/LA (% meeting or exceeding target) 25% 25. Accelerated Growth of Lowest 25% in Math (% high growth) 20% 20. Accelerated Growth of Lowest 25% in E/LA (% high growth) 21% Year Adjusted Cohort Graduation Rate. 74% Year Adjusted Cohort Graduation Rate. 79% 79. TOTAL")
48
Points of Clarity Requires an amendment to the ESEA Flexibility Request Based on initial conversations, USDOE appears amenable to the concepts presented but negotiations could result in minor metric changes based on the review of impact data Accountability includes all tested grades 3-11 Cell size is 10 Only impacts observed growth (average of sub groups) and lowest 25% calculations; all other calculations are based on the “all” group Will report all subgroups for public transparency and for services delivered via the strategic plan.
 and lowest 25% calculations; all other calculations are based on the all group. Will report all subgroups for public transparency and for services delivered via the strategic plan.")
49
Points of Clarity Priority and Focus status remains a federal requirement but will not impact school grades Priority Schools Still at the 5th percentile of Title I schools Based on total index rather than just proficiency (should have little effect because of proficiency being so heavily embedded in the index) Focus Schools Two definitions in USDOE guidance Schools with the greatest achievement gaps (used in current system) Lowest performing subgroups (used in amendment) Finalized once impact data are available to ensure representation of appropriate students Supports required for both as we currently have in place Those currently identified will remain for the initial 3 year period
 Focus Schools. Two definitions in USDOE guidance. Schools with the greatest achievement gaps (used in current system) Lowest performing subgroups (used in amendment) Finalized once impact data are available to ensure representation of appropriate students. Supports required for both as we currently have in place. Those currently identified will remain for the initial 3 year period.")
52
WV Accountability System
Questions/Discussion

53
BREAK TIME!

54
Section 6: School Accreditation Debbie Ashwell Coordinator, OEPA

55
Accreditation System Verifying A-F.
Assessing and reporting Policy 2322, adherence to policy and Code, reporting best practices, efficiencies, and resource, facility, and capacity building needs. Identifying and reporting classroom conditions and non-compliances that may impact student learning/well-being, effective/efficient operation of the school.

56
Accreditation System System of self-study
Method for promoting continuous improvement Basis for determining rewards, supports, technical assistance, and intervention

57
Measures and Levels A-F system (Section 5)
Student outcomes are the primary measures of school effectiveness. School performance rating Calculated by the WVDE; Verified by the OEPA through accreditation process; Approved by the WVBE; and Communicated to schools, school systems, and communities.

58
Principles and Processes
Operating Principles Review Processes Conditions Affecting Grade Verification Circumstances for Modifying Grades

59
Operating Principles Focus on Student Performance – create school and classroom conditions reflected in Policy 2322. Transparency and Clarity – communicated in advance and reviewed and validated through annual and cyclical reviews. Vehicle for Local Decision-Making – school uses available tools to reach consensus on improvement priorities.

60
Review Processes Annual and cyclical reviews are designed to:
verify the school’s annual performance grade; provide feedback for local school improvement efforts; verify compliance with core policy and Code; document best practices; and identify efficiencies, resource, facility, and capacity building needs.

61
Annual Reviews School Monitoring Report as self-assessment
School quality defined in Policy 2322 Compliance with policy and Code Best practices School resource and capacity building needs School Monitoring Report Developed with staff input Reviewed by Faculty Senate and LSIC Approved by principal and superintendent Submitted to the OEPA by timeline

62
Cyclical Reviews On-site review At least every 4 years
Assures all schools are accountable common set of high quality standards core policy and Code compliance continuous improvement External Team managed by OEPA

63
Cyclical Reviews Team responsibilities:
Determine accuracy of School Monitoring Report. Review School Strategic Plan. Examine school practices (Policy 2322) and provide feedback on strengths and needs. Document best practices. Identify resource, facility, efficiency, and capacity building needs impeding improvement.
 and provide feedback on strengths and needs. Document best practices. Identify resource, facility, efficiency, and capacity building needs impeding improvement.")
64
Conditions Affecting Grade Verification
1. Unreliability of performance measures Administering student assessments Recording dropout and other related graduation data 2. School conditions that significantly impair student academic success and well-being Pervasive and/or serious in nature 3. Significant policy and Code violations

65
Circumstances for Modifying Grades
Performance grade is a misrepresentation of overall quality (rare circumstances as defined on previous slide). Unreliable performance measures = grade of F Conditions that significantly impair academic success and well-being = grade of F Significant policy and Code violations = reduced grade, no higher than C
. Unreliable performance measures = grade of F. Conditions that significantly impair academic success and well-being = grade of F. Significant policy and Code violations = reduced grade, no higher than C.")
66
School Responsibilities for Accreditation
Develop knowledge of Policy 2322 Complete School Monitoring Report Develop Strategic Plan Implement Strategic Plan Participate in On-Site Review Process

67
Participate in On-Site Review Process
Prepare for review Staff orientation Documents (School Monitoring Report, etc.) Participate in review Interviews, observations, review evidence provided Participate in exit conference Team summary of visit Address review findings contained in report
 Participate in review. Interviews, observations, review evidence provided. Participate in exit conference. Team summary of visit. Address review findings contained in report.")
68
County Board of Education Responsibilities for School Accreditation
Implementation Develop understanding of accreditation processes Establish local direction Monitor school responsibilities Completion of School Monitoring Report Review and verify accuracy of School Monitoring Report. School strategic planning process considers annual feedback. Ensure audit review findings are addressed.

69
County Board of Education Responsibilities for School Accreditation
Establish supports and expectations that impact student performance Principal is instructional leader and all schools are student-centered and learning-focused Structures for school self-assessment and goal setting leading to improved performance School-based PD for unique needs of staff and students Differentiated support based on performance grade and school need

70
OEPA Responsibilities for School Accreditation
Tools – prepare for the accreditation process School Monitoring Report Orientation materials Information – support documents Informational brochures Local/regional PD Regular electronic updates Guidance on processes and procedures

71
OEPA Responsibilities for School Accreditation
Feedback – to schools on annual and cyclical review processes including: Strengths and weaknesses related to Policy 2322 Compliance with policy and Code Recognition of best practices Assessment of resource, facility, efficiency, and capacity building needs Communication of recommendations and/or findings Identification of circumstances that could modify school’s performance grade

72
Continuous Improvement and Strategic Planning
Section 9: Continuous Improvement and Strategic Planning Charlene Coburn Coordinator, OEPA

73
School System Continuous Improvement
Model quality improvement processes expected of schools. Clear beliefs about teaching and learning that guide decisions Focused mission Goals derived from organized process of data analysis

74
Ultimately, the school system’s improvement process must determine how school system leadership, resources, services, supports, and policies can be best utilized to improve the school and classroom learning conditions that impact student performance.

75
School System Continuous Improvement
Requirements: Analysis of accountability data Support for schools earning a D or F performance rating Support for schools with accreditation findings

76
School System Strategic Planning
Development Process 1. Analysis of accountability data (WVAS) 2. Strategies to provide targeted support and technical assistance for schools with a D or F performance grade 3. Support for schools with findings and directives from the WVBE resulting from an accreditation review 4. Strategies for improving overall performance of all schools
 2. Strategies to provide targeted support and technical assistance for schools with a D or F performance grade. 3. Support for schools with findings and directives from the WVBE resulting from an accreditation review. 4. Strategies for improving overall performance of all schools.")
77
Contents of School System Strategic Plan
The contents of the plan are determined by the school system under the direction of the county superintendent. At a minimum, the plan includes the following: Core beliefs Mission Goals Measurement evidence Action steps Professional development Technical assistance

78
Revisions and Approval
Revisions of the plan are made annually as new data and information indicate and when directed by the WVBE as outlined in Policy 2320. The school system Strategic Plan is approved through formal action of the county board of education. Submitted to WVDE for review and presented to the WVBE for approval.

79
School Continuous Improvement
The improvement process is facilitated by the principal but involves teachers, staff, and stakeholders in decision-making and leadership roles. The principal makes improvement a focus by developing staff collective knowledge of needs and by developing an understanding of and commitment to the school’s improvement priorities.

80
School Continuous Improvement
It is recommended that each school use information and data provided by the school system, RESA, the WVDE, and/or other entities to complete the self-study. Ultimately, the self-study must assist staff in determining the root causes of student performance deficits and help determine changes needed in school and classroom practice.

81
School Continuous Improvement
Designated team or committee to orchestrate the school’s improvement efforts Process of using data and information to determine needs On-going professional development and research on how to best improve school and classroom processes and strategies

82
School Continuous Improvement
At a minimum, every school MUST utilize: School Monitoring Report, and Summary of employee evaluation data to guide improvement efforts.

83
School Strategic Planning Development Process
The school electronic strategic improvement plan is the culmination of : School’s self-study of student performance School’s self-study of school and classroom learning conditions

84
School Strategic Planning Development Process
The plan is developed under the direction of the principal with collective involvement and input from the staff and the LSIC. The plan must includes the following: Core beliefs Mission Goals Measurement evidence Action steps Professional development needs

85
School Strategic Planning Development Process
The action steps are based on examination of best practices and innovative approaches to improve student performance and address student needs. All members of the school staff are responsible for implementing the plan. The principal is responsible for monitoring the implementation of the plan. The plan is updated and revised as data and information dictate based on the tenets of continuous improvement. Annual updates to the plan must consider the OEPA School Monitoring Report when the report identifies deficits in quality or compliance.

86
School System Responsibilities
Ensure each school is led by a principal knowledgeable of continuous improvement processes and capable of leading effective improvement efforts. Build capacity by supporting effective improvement teams. Assist schools in creating schedules and allocating time for staff to work on school improvement efforts.

87
School System Responsibilities
Establish direction and expectations through school system goal-setting grounded in analysis of student performance data. Review and approve school Strategic Plans. Differentiate school system supports and assistance according to the school needs in order for each school to meet a C or higher level of student performance. Verify to the WVDE that all school plans have been submitted, reviewed, and approved by the county superintendent or designee.

88
WVBE Responsibilities
The West Virginia Board of Education is responsible for creating processes to support and monitor continuous improvement through the following entities:

89
WVDE Responsibilities
Creating and distributing the electronic template, as approved by WVBE, through which the school and school system Strategic Plan is recorded Establishing timelines for the submission of the school and school system Strategic Plans Monitoring school system plan submissions to assure plans include the core components Third bullet: as outlined in WVBE Policy and W.Va. Code.

90
WVDE Responsibilities
Providing leadership and technical assistance on effective continuous improvement and strategic planning processes Providing data, tools, and resources that support effective continuous improvement and strategic planning Providing input and feedback on the contents of school system Strategic Plans for those school systems that have not achieved Full Approval status Third bullet: or any other school system where WVDE believes appropriate

91
OEPA Responsibilities
The Office of Education Performance Audits is responsible for monitoring and reporting the submission of school and school system plan revisions when such revisions result from WVBE directives and accreditation findings.

92
WVDE, RESAs, and West Virginia Center for Professional Development
These agencies are responsible for responding to regional, statewide, school, and school system professional development needs as identified in the school and school system Strategic Plans and from reports compiled as result of the OEPA accreditation reviews.

93
School and School System Supports and Consequences
Section 8: School and School System Supports and Consequences Allen Brock Coordinator, OEPA

94
Schools with a D Performance Grade
A school with a D Performance Grade must receive assistance from the county superintendent: Must find the problem, determine the improvements necessary, modify the Five-Year Plan, and evaluate the results.

95
Schools with Two Consecutive D Performance Grades
School must determine if more time with the existing support will improve the school If no improvements, external support must be sought.

96
Schools with Three Consecutive D Performance Grades
A school that receives THREE consecutive D Performance Grades: A summary of actions must be submitted to the WVBE The WVBE will do one of the following: Extend the timeline if improvements are made, Declare extraordinary circumstances and intervene Take other actions as necessary

97
Schools with an F Performance Grade
Must receive immediate intervention by the LEA LEA must determine if the school/LEA have the capacity to improve the conditions at the school

98
Schools with Two Consecutive F Performance Grades
A summary of actions must be submitted to the WVBE The WVBE will determine one of the following: Extend timeline if improvements have been made, Declare extraordinary circumstances and intervene, Take other appropriate actions.

99
School Extraordinary Circumstances
Extraordinary Circumstances include, but not limited to: physical or other abuse of students; inappropriate suspensions and/or expulsions; misappropriation of funds; misuse of public funds; falsification of reports and/or failure to submit required reports; violation of W. Va. Code and WVBE policies that impact the provision of an appropriate educational program; unhealthy or unsafe conditions for students and/or employees; or failure to provide a high quality and equal educational opportunity for students which are directly attributed to deficiencies in leadership, school and classroom learning conditions, and the school’s resources in facilities, personnel, curriculum, and/or equipment and materials.

100
WVBE Intervention The WVBE may intervene under extraordinary circumstances and Appoint monitors to aid the principal Direct the county to target resources to aid the school Remove the principal Implement other actions as necessary

101
County System Nonapproval Status
County Nonapproval Status Six conditions that may cause a county to receive Nonapproval Status, as outlined in Section 8.3.b. Extraordinary Circumstances for County Systems: Pervasive and consistent poor performance Conditions that threaten the health, safety, educational quality of students, or fiscal solvency within the school system

102
Conditions of Extraordinary Circumstances for County Systems
County Extraordinary Circumstances Include, but not limited to: misappropriation of funds; misuse of public funds; falsification of reports and/or failure to submit required reports; violation of W. Va. Code or West Virginia Board of Education policies that impact the provision of an appropriate educational program; unhealthy or unsafe conditions; failure to provide a high quality and equal educational opportunity for students; and/or deficiencies in leadership.

103
Addressing Deficits When a county board has more than a casual deficit, a plan must be submitted to the WVDE. Nonapproval status can be given if the county 1) fails to gain approval of the plan in a timely manner, or 2) the county board fails to follow the approved plan.
 fails to gain approval of the plan in a timely manner, or 2) the county board fails to follow the approved plan.")
104
WVBE Intervention When Nonapproval Status is given, a state of emergency is declared by the WVBE. If corrections are not made within six months, the WVBE will intervene. The authority of the county superintendent and board may be limited, and the position of superintendent may be declared vacant.

105
Immediate County Intervention
Immediate Intervention by the WVBE may occur if: Delay of the intervention is not in the best interest of students, or The county system had been under state control within 5 years and the conditions reappear.

106
School Accreditation and Continuous Improvement and Strategic Planning
Questions/Discussion

107
Overview of the School Monitoring Report
And Overview of Implementation Process and Schedule Gus Penix Director, OEPA

109
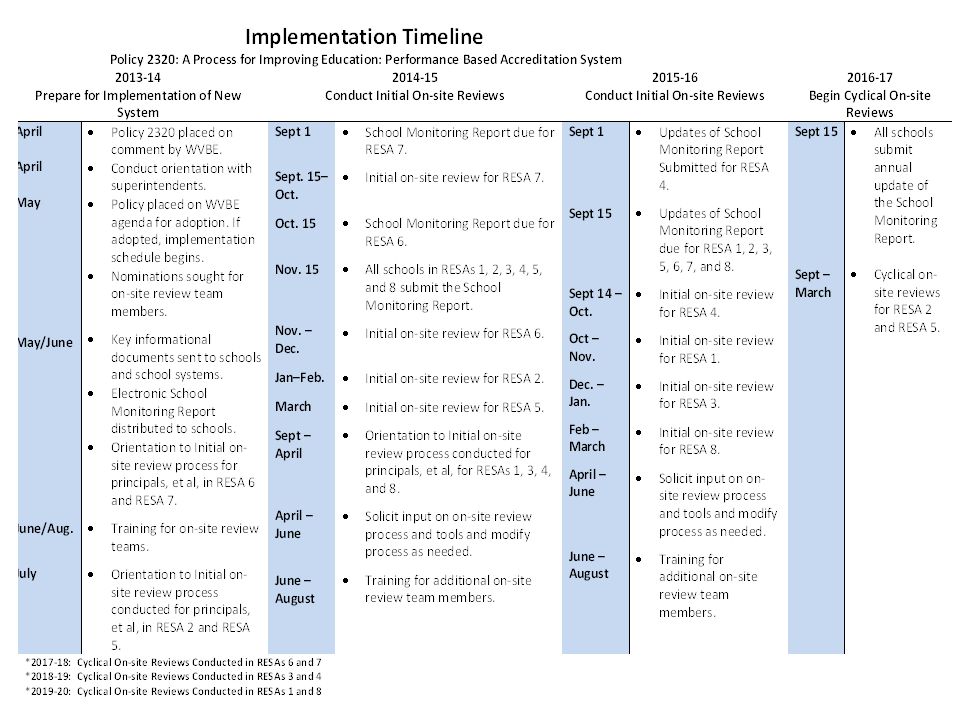
INITIAL Audits of All Schools
2014 County Days 2015 15-Sep Monongalia 3 Preston 2 5-Jan REPORT WRITING 22-Sep Randolph Barbour 12-Jan Cabell 4 29-Sep Doddridge 1 Harrison 19-Jan Lincoln Mason 6-Oct Gilmer Upshur 26-Jan Logan 13-Oct Lewis Taylor 2-Feb Mingo 20-Oct Tucker Marion 9-Feb Wayne 27-Oct 16-Feb 3-Nov 23-Feb 10-Nov Brooke Hancock 2-Mar Calhoun 1.5 Wirt 17-Nov Marshall 9-Mar Jackson 24-Nov THANKSGIVING BREAK 16-Mar Pleasants Roane 1-Dec Ohio 23-Mar Ritchie Tyler 8-Dec Wetzel 30-Mar Wood 15-Dec 6-Apr EASTER BREAK 22-Dec CHRISTMAS BREAK 13-Apr 29-Dec 20-Apr 2016 14-Sep Braxton Fayette 4-Jan 21-Sep Pocahontas Greenbrier 11-Jan Kanawha 5 28-Sep Webster Nicholas 18-Jan 5-Oct 25-Jan 12-Oct 1-Feb 19-Oct Mercer 8-Feb 26-Oct McDowell Summers 15-Feb 2-Nov Raleigh 22-Feb Berkeley 9-Nov Wyoming Monroe 29-Feb Grant Hardy Hampshire 16-Nov 7-Mar Mineral Pendleton 23-Nov 14-Mar Jefferson 30-Nov 21-Mar Morgan 7-Dec Clay Boone 28-Mar 14-Dec Putnam 4-Apr 21-Dec CHRISTMAS BREAK' 11-Apr 28-Dec

110
OEPA AUDIT SCHEDULES 2014-2020 2014-2015 2015-2016 2016-2017 2017-2018
RESA 2 RESA 1 RESA 6 RESA 3 RESA 5 RESA 7 RESA 4 RESA 8 X

111
LUNCH TIME!

112
Preparing for the Initial Audit Resources and Supports
Dr. Michelle Samples Coordinator, OEPA

113
Completing the School Monitoring Report
Important considerations for principals Method for completion Challenges of completion Areas included on the School Monitoring Report Role of the School Monitoring Report in the accreditation process

114
Preparing for the Initial Audit
Share the Strategic Plan and the School Monitoring Report with staff and others. Be prepared to discuss how the school is addressing Standards for High Quality Schools (Policy 2322), school improvement efforts, identified improvement needs and strengths, and compliance with identified policies and Code. Submit required documents promptly to the OEPA as noted in the Notification Letter.
, school improvement efforts, identified improvement needs and strengths, and. compliance with identified policies and Code. Submit required documents promptly to the OEPA as noted in the Notification Letter.")
115
Preparing for the Initial Audit
Ensure all other documents are available as noted in the Notification Letter (Facilities Checklist). Inform staff of the auditing format: Classroom observations Interviews (staff, students, and parents) Lesson plan reviews Provide a meeting space for the audit Team. Wireless Internet Password (if available).
. Inform staff of the auditing format: Classroom observations. Interviews (staff, students, and parents) Lesson plan reviews. Provide a meeting space for the audit Team. Wireless Internet Password (if available).")
116
Orientation Booklet Section
Frequently Asked Questions (Pages 26-28)
")
117
NEXT STEPS Date for electronic submission of the School Monitoring Report for RESA 5 is November 15, 2014. Date for completion of School Facilities Checklist (paper format) for RESA 5 is November 15, 2014. Dates for on-site reviews for RESA 5 are: Calhoun 3/2/15 (1.5) Wirt (1.5) Jackson 3/9/15 (3) Pleasants 3/16/15 (2) Roane (2) Ritchie 3/23/15 (2) Tyler (2) Wood 3/30/15 (4) Date for first four-year cyclical review for RESA 5 is school year
 for RESA 5 is November 15, Dates for on-site reviews for RESA 5 are: Calhoun 3/2/15 (1.5) Wirt (1.5) Jackson 3/9/15 (3) Pleasants 3/16/15 (2) Roane (2) Ritchie 3/23/15 (2) Tyler (2) Wood 3/30/15 (4) Date for first four-year cyclical review for RESA 5 is school year")
118
RECAP of Policy 2320 Themes All students in WV schools deserve a quality educational program defined in the WV Constitution as thorough and efficient. It is the responsibility of all school systems and individual schools, regardless of performance level, to have viable structures and processes for improving the quality and equity of student outcomes. The WVBE believes that every WV school has the obligation to improve and to create school and classroom conditions that lead to student success. As specified in WV Code §18-2E-5, continuous improvement shall be addressed as part of the accreditation processes. The annual and cyclical accreditation processes are designed and implemented to support local decision-making on how to change school and classroom conditions in ways that improve student performance and well-being.

119
RECAP of Policy 2320 Themes By using the School Monitoring Report, school faculties, and LSICs have a valuable method for reflecting on current practices, reaching consensus on improvement priorities, guiding the contents of the school strategic plan, and addressing non-compliances with policy and Code. Each school will self-assess where you are based on the high quality standards and the OEPA responsibility is, through review processes, to guide the school to continuous improvement. In a word search of the new Policy 2320 the word improvement appears 81% of the time as compared to 19% for compliance. Thus, 80% of the focus of the new accreditation approach is about school quality as outlined in Policy 2322 Standards for High Quality Schools and 20% of the focus is on compliance. At the direction of the WVBE, the new accreditation process is framed in the context of helping West Virginia’s schools continuously improve.

120
RECAP of Policy 2320 Themes Know – Feel – Do
KNOW – the tenets of the new accreditation policy. FEEL – encouraged that the process is about improving your school. DO – take actions that will prepare your school for the on-site review process and put in place practices that focus on continuous improvement for your school.

121
RECAP of Policy 2320 Themes The OEPA Website contains all materials used in the presentation today. It is suggested you print off copies of the School Monitoring Report and the School Facilities Evaluation Checklist form and begin working on those documents.

122
Suggested Strategies for Policy 2320 Implementation
Bill Niday Consultant, OEPA

123
Session Evaluation and
Questions Session Evaluation and Closure

Similar presentations


![[Imagine School at North Port] Oral Exit Report Quality Assurance Review Team School Accreditation.](/1/271987/big_thumb.jpg "[Imagine School at North Port] Oral Exit Report Quality Assurance Review Team School Accreditation.>")


 and>")


 7/3/20151.>")


 Report.>")

