Download presentation
Presentation is loading. Please wait.

1
ShakeAlert Testing Procedure Discussion Philip Maechling 26 March 2010 1

2
SCEC has the opportunity to define a testing approach for the CISN ShakeAlert System. –Testing approach should be consistent with USGS interests in the ShakeAlert System. –CTC effort should provide a longitudinal study of ShakeAlert Capabilities –Science-oriented testing focus (rather than engineering focus) is more consistent CSEP model –CTC effort provides SCEC with an opportunity to demonstrate the general capabilities of CSEP infrastructure other problems. 2 ShakeAlert Testing
 is more consistent CSEP model –CTC effort provides SCEC with an opportunity to demonstrate the general capabilities of CSEP infrastructure other problems. 2 ShakeAlert Testing.")
3
CTC plan must be implemented within funded level of effort approximately 12 hours per month. –SCEC should establish scientific framework for ShakeAlert Testing –Initial testing approach should be simple –Initial testing should provide value to USGS and ShakeAlert developers –Initial Testing should communicate value of EEW testing to SCEC community and CISN 3 Scale of SCEC CTC Activity

4
Bridging the gap between science and engineering: avenues for collaborative research Christine Goulet, PhD Sr Geotechnical Engineer, URS Lecturer, UCLA christine_goulet@urscorp.com 2009 Annual Meeting: Palm Springs, CA

5
5 Conclusion Collaboration is an outcome-driven process (mission, vision, etc.) We can benefit from collaboration if we commit to Spend time and effort in the process Keep an open mind Keep a eye on the goal Benefit for engineers A better understanding and integration of seismological phenomena = better design Benefit for scientists The application and dissemination of their results into the built world = greater impact
 We can benefit from collaboration if we commit to Spend time and effort in the process Keep an open mind Keep a eye on the goal Benefit for engineers A better understanding and integration of seismological phenomena = better design Benefit for scientists The application and dissemination of their results into the built world = greater impact")
6
6 On collaboration Collaboration is a process through which people work together, pooling their ressources to achieve a shared desired result or outcome. The collaboration process: Involves a catalyst (common interest, reaction to an event) Provides a broader insight into a problem and its potential solutions Allows a knowledge transfer by which each participant’s specialty benefits the group (knowledge optimization) Gives access to new problems and ideas Successful collaboration requires: Effective communication A clearly defined goal or vision Collaboration is an outcome-driven process
 Provides a broader insight into a problem and its potential solutions Allows a knowledge transfer by which each participant’s specialty benefits the group (knowledge optimization) Gives access to new problems and ideas Successful collaboration requires: Effective communication A clearly defined goal or vision Collaboration is an outcome-driven process.")
7
7 On communication To communicate is human… …it does not mean we’re naturally good at it. Key elements for a better communication: Sharing a common language Saying what you mean Developing improved active listening skills Using feedback techniques (“What I understood is… Is this correct?”) Keeping an open mind
 Keeping an open mind.")
8
8 A shared vision? Scientists Engineers Interest Goal/ desired outcome Earthquakes Understanding Design a product Group

9
9 Interface(s) Source effects Fault mechanism, magnitude and location Recurrence models Travel paths Site effects Wave propagation to the surface Basin effects Topographic effects Directivity Structural response Including foundation Loss analysis Geologists & Seismologist s Seismologists & Engineers Geotechnical Engineers & Seismologists Geotechnical & Structural Engineers Engineers, loss modelers
 Source effects Fault mechanism, magnitude and location Recurrence models Travel paths Site effects Wave propagation to the surface Basin effects Topographic effects Directivity Structural response Including foundation Loss analysis Geologists & Seismologist s Seismologists & Engineers Geotechnical Engineers & Seismologists Geotechnical & Structural Engineers Engineers, loss modelers")
10
Establish Testing Emphasis with USGS and CISN Development Groups 10

11
ShakeAlert Forecast Evaluation Problems: –Scientific publications provide insufficient information for independent evaluation –Data to evaluate forecast experiments are often improperly specified –Active researchers are constantly tweaking their codes and procedures, which become moving targets –Difficult to find resources to conduct and evaluate long term forecasts –Standards are lacking for testing forecasts against reference observations 11 Problems in Assessing Forecasts

12
SCEC Annual Meeting, Palm Springs, Sept. 14-16, 2009 Warner Marzocchi INGV, Istituto Nazionale di Geofisica e Vulcanologia, Rome, Italy In collaboration with: Anna Maria Lombardi (INGV), Gordon Woo (RMS), Thomas van Stiphout (ETH), Stefan Wiemer (ETH) Long- and short-term operational earthquake forecasting in Italy: the case of the April 6, 2009, L'Aquila earthquake
, Gordon Woo (RMS), Thomas van Stiphout (ETH), Stefan Wiemer (ETH) Long- and short-term operational earthquake forecasting in Italy: the case of the April 6, 2009, L Aquila earthquake.")
13
Design of Testing Experiment 13

14
The EEW tests we implement should be valid for CISN and any other EEW implementation including commercial systems and community contribution-based systems. 14 Additional Goal for Testing

15
Many CSEP testing principles are applicable to CISN EEW Testing. The following definitions need to be made to evaluate forecasts: –Exact definition of testing area –Exact definition of a forecast –Exact definition of input data used in forecasts –Exact definition of reference observation data –Measures of success for forecasts 15 Design of an Experiment

16
Design of EEW Science Testing introduces elements that CSEP has not had to consider –Must decide whether to test both forecast and “alerts” –Different algorithms produce different forecasts Some (e.g. On-site) produce site-specific information (PGA), event magnitude, but no origin time or distance to event Some (e.g. Vs) produces full event parametric information. Some (e.g. Elarms) produce site specific ground motion estimates on a regular grid. Some produce single values (On-site) Some produce time-series with updates (Vs,Elarms) 16 Design of an Experiment
 produce site-specific information (PGA), event magnitude, but no origin time or distance to event Some (e.g. Vs) produces full event parametric information. Some (e.g. Elarms) produce site specific ground motion estimates on a regular grid. Some produce single values (On-site) Some produce time-series with updates (Vs,Elarms) 16 Design of an Experiment.")
17
Design of EEW Science Testing introduces elements that CSEP has not had to consider –More difficult to determine information used in forecast especially with Bayesian approach is fully implemented –More difficult to determine what data is used in forecast at any time. –Time-basis of forecast (forecast term e.g. 60 second …1 second) varies by event –Greater interest in summary of performance on an event by event basis. Should support push-based distribution of results after significant events. 17 Design of an Experiment
 varies by event –Greater interest in summary of performance on an event by event basis. Should support push-based distribution of results after significant events. 17 Design of an Experiment.")
18
Example of stations that could contribute to forecasts. 18 Design of an Experiment

19
SCEC Annual Meeting, Palm Springs, Sept. 14-16, 2009 The 1-day forecasts (the palette represents the rate of M 4+) Daily forecasts released at 8:00 AM (no overlaps)
 Daily forecasts released at 8:00 AM (no overlaps).")
20
SCEC Annual Meeting, Palm Springs, Sept. 14-16, 2009 Testing the forecasts (using M 2.5+ events) N-testSpatial test
 N-testSpatial test.")
21
21 2. GMPE prediction, distance-scaling term Image: J. Stewart, L. Star 110100 R rup (km) 0.001 0.01 0.1 1 S a ( g ) CB (2008) PGA Original SA, T=1s Original SA, T=10s Original Strike-slip EQ V S30 =540m/s
 S a ( g ) CB (2008) PGA Original SA, T=1s Original SA, T=10s Original Strike-slip EQ V S30 =540m/s.")
22
Propose Time Dependent tests as forecasts before origin (or peak ground motion at site) –Could produce a peak ground motion map at origin time and later. Forecasts produce ground motion maps and any regions that have not received peak ground motion contribute to the forecast. Series of forecast maps for each algorithm as they produce them. Any regions in any maps that have not experienced their time of PGV is credited. Map regions will fall over time eventually reaching zero forecasts to be evaluated for the event. –For next test maybe we can ignore whether sites receive a warning. –Plot the forecast by time like slide 15 with improvement in forecast with shorter forecast times. 22 Design of an Experiment

23
23 First test is to reproduce the ShakeMap

24
24 Design of an Experiment Map of reporting stations used in Shakemap

25
Propose Time Dependent tests as forecasts before origin (or peak ground motion at site) –Introduce the use of first provided estimate as important measure. –Introduce use of announcers as a new system that provides forecasts. Announcers would be easy to add and easy to remove. –Which side of the interface is the probability set? They provide forecasts and probabilities, or do we set tests at probability level and let them figure out whether it meets the specified level. 25 Design of an Experiment

26
SCEC Annual Meeting, Palm Springs, Sept. 14-16, 2009 Point to bring home on short-term forecasts We perform daily aftershock forecasts in real-time. From the test on the first months, the forecast seems well calibrated, describing correctly the space-time evolution of the aftershock sequence. The same model (retrospectively) detected an increase in probability before the main event; the (daily) probability did not reach a value of 1%.
 detected an increase in probability before the main event; the (daily) probability did not reach a value of 1%..")
27
SCEC Annual Meeting, Palm Springs, Sept. 14-16, 2009 The Challenge is for scientists to articulate uncertainty without losing credibility and to give public officials the information they need for decision-making Scientists Public officials this requires to bridge the gap between scientific output (probability) and the boolean logic (YES-NO) of decision-makers Introducing the problem
 and the boolean logic (YES-NO) of decision-makers Introducing the problem.")
28
Design of EEW Science Testing introduces elements that CSEP has not had to consider –CISN seems to be distinguishing event module (produces event parameters) and user module which produces site-specific ground motion estimates –User modules are likely to vary by tolerance for false alarms and by conversion from location/magnitude to site-specific ground motion estimates. –I recommend we make it easy to add new forecast sources, and remove old ones so that we can support experimentation on forecasters by CISN. 28 Design of an Experiment

29
New Waveform Processing Library AlgorithmCodeMemory buffers Import fromDelays On-site algorithmcompactinternalMulticast Network or Earthworm < 0.01 seconds Virtual Seismologist compactinternalWaveform Data Area (WDA) 3-5 seconds ElarmS4 modules + ElarmS program sharedWaveform Data Area (WDA) 3-5 seconds + delays caused by writing/ reading to shared memory buffers Development of a new Waveform Processing Library (based on the same idea already used by the On-site algorithm): The old framework used GCDA (Generic Continuous Data Area) to store waveforms which slowed down the read/write access to the waveforms and overall processing thread. To avoid that problem the new version will use internal memory buffers and work in a single process multi-threaded environment.

30
Decision Module (DM) The Decision Module is expected to - receive short, independent messages from the three Event Detectors - be running on different machines than the Event Detectors. The passing of messages between the three Event Detectors to the DM as well as the broadcast of the outputs of the DM to users will likely be based on Apache ActiveMQ (public-subscribe messaging system; asynchronous message passing and persistent message storage). Preliminary API is almost finished challenging: association & up-dates of messages up-date DM event, if possible; if misfit is too large, disassociate all messages of the event and create a new DM event (similar to Binder) requires that the On-site algorithm provides eventIDs (done)
. Preliminary API is almost finished challenging: association & up-dates of messages up-date DM event, if possible; if misfit is too large, disassociate all messages of the event and create a new DM event (similar to Binder) requires that the On-site algorithm provides eventIDs (done).")
31
- most probable … M w … location … origin time … ground motion and uncertainties - probability of false trigger, i.e. no earthquake - CANCEL message if needed Bayesian approach up-dated with time Decision Module (Bayesian) τ c -P d On-site Algorithm Virtual Seismologist (VS) ElarmS Single sensorSensor network Task 1: increase reliability CISN Shake Alert
 τ c -P d On-site Algorithm Virtual Seismologist (VS) ElarmS Single sensorSensor network Task 1: increase reliability CISN Shake Alert.")
32
USER Module - Single site warning - Map view CISN EEW Testing Center Test users Task 1: increase reliability Task 2: demonstrate & enhance predicted and observed ground motions available warning time probability of false alarm … feed-back Decision Module (Bayesian) CISN Shake Alert τ c -P d On-site Algorithm Virtual Seismologist (VS) ElarmS Single sensorSensor network
 CISN Shake Alert τ c -P d On-site Algorithm Virtual Seismologist (VS) ElarmS Single sensorSensor network")
33
Methodology development slide courtesy of Holly Brown

34
Presented 23 June 2009 at Joint Meeting of MeteoAlarm and the WIS CAP Implementation Workshop on Identifiers by Eliot Christian Identifiers and the Common Alerting Protocol (CAP) World Meteorological Organization (WMO) Observing and Information Systems Department WMO Information System (WIS)
 World Meteorological Organization (WMO) Observing and Information Systems Department WMO Information System (WIS)")
35
June 23, 2009Common Alerting Protocol (CAP) 35 Outline What is CAP? Why and How would MeteoAlarm use CAP? What are the issues with Identifiers?

36
June 23, 2009Common Alerting Protocol (CAP) 36 What is CAP? The Common Alerting Protocol (CAP) is a standard message format designed for All-Media, All-Hazard, communications: over any and all media (television, radio, telephone, fax, highway signs, e-mail, Web sites, RSS "Blogs",...) about any and all kinds of hazard (Weather, Fires, Earthquakes, Volcanoes, Landslides, Child Abductions, Disease Outbreaks, Air Quality Warnings, Beach Closings, Transportation Problems, Power Outages,...) to anyone: the public at large; designated groups (civic authority, responders, etc.); specific people
 is a standard message format designed for All-Media, All-Hazard, communications: over any and all media (television, radio, telephone, fax, highway signs, , Web sites, RSS Blogs ,...) about any and all kinds of hazard (Weather, Fires, Earthquakes, Volcanoes, Landslides, Child Abductions, Disease Outbreaks, Air Quality Warnings, Beach Closings, Transportation Problems, Power Outages,...) to anyone: the public at large; designated groups (civic authority, responders, etc.); specific people.")
37
June 23, 2009Common Alerting Protocol (CAP) 37 Structure of a CAP Alert CAP Alert messages contain: Text values for human readers, e.g., "headline", "description", "instruction", "area description", etc. Coded values useful for filtering, routing, and automated translation to human languages

38
June 23, 2009Common Alerting Protocol (CAP) 38 Filtering and Routing Criteria Date/Time Geographic Area (polygon, circle, geographic codes) Status (Actual, Exercise, System, Test) Scope (Public, Restricted, Private) Type (Alert, Update, Cancel, Ack, Error)
 38 Filtering and Routing Criteria Date/Time Geographic Area (polygon, circle, geographic codes) Status (Actual, Exercise, System, Test) Scope (Public, Restricted, Private) Type (Alert, Update, Cancel, Ack, Error)")
39
June 23, 2009Common Alerting Protocol (CAP) 39 Filtering and Routing Criteria Event Categories (Geo, Met, Safety, Security, Rescue, Fire, Health, Env, Transport, Infra, Other) Urgency: Timeframe for responsive action (Immediate, Expected, Future, Past, Unknown) Severity: Level of threat to life or property (Extreme, Severe, Moderate, Minor, Unknown) Certainty: Probability of occurrence (Very Likely, Likely, Possible, Unlikely, Unknown)
 39 Filtering and Routing Criteria Event Categories (Geo, Met, Safety, Security, Rescue, Fire, Health, Env, Transport, Infra, Other) Urgency: Timeframe for responsive action (Immediate, Expected, Future, Past, Unknown) Severity: Level of threat to life or property (Extreme, Severe, Moderate, Minor, Unknown) Certainty: Probability of occurrence (Very Likely, Likely, Possible, Unlikely, Unknown)")
40
June 23, 2009Common Alerting Protocol (CAP) 40 Typical CAP-based Alerting System
 40 Typical CAP-based Alerting System")
41
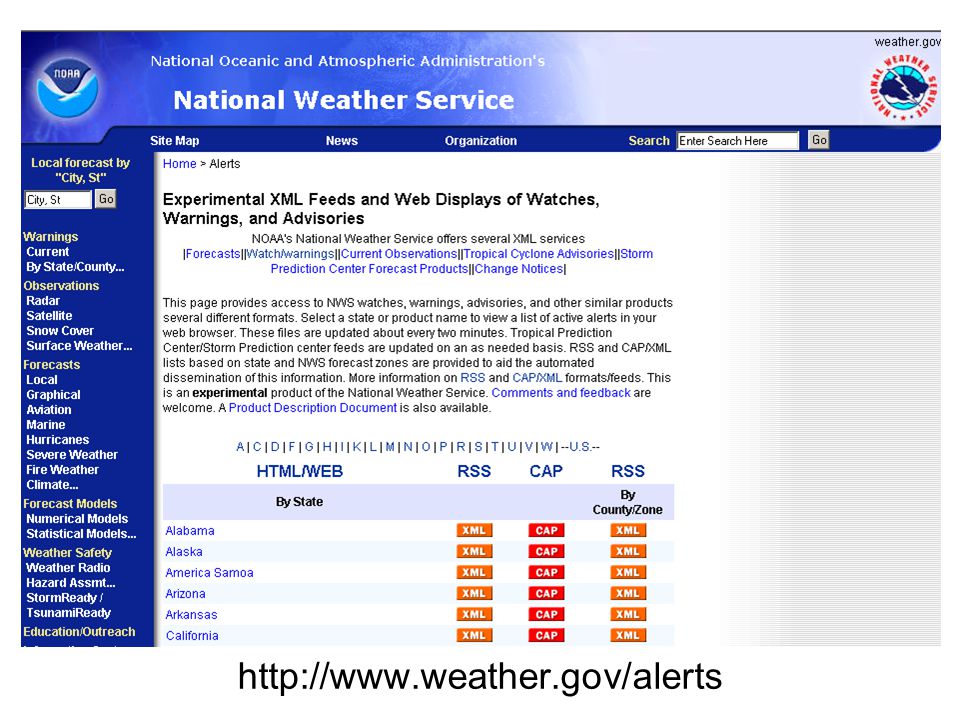
http://www.weather.gov/alerts
42
Existing proposals for EEW Testing Agreements 42

43
We propose that initial CTC testing supports science groups first, engineering second. –Accuracy and timeliness of event-oriented parameters (location, magnitude) –Accuracy and timeliness of ground motion forecasts (pgv, psa, intensity) for both site-specific and grid-based site specific forecasts 43 Design of an Experiment
 –Accuracy and timeliness of ground motion forecasts (pgv, psa, intensity) for both site-specific and grid-based site specific forecasts 43 Design of an Experiment.")
44
Many CSEP testing principles are applicable to CISN EEW Testing. The following definitions need to be made to evaluate forecasts: –Exact definition of testing area –Exact definition of a forecast –Exact definition of input data used in forecasts –Exact definition of reference observation data –Measures of success for forecasts 44 Design of an Experiment

45
Are the 3 CSEP regions valid for EEW ? Region Under Test Catalog Event Region Buffer to avoid catalog issues 45 Design of an Experiment

46
Many CSEP testing principles are applicable to CISN EEW Testing. The following definitions need to be made to evaluate forecasts: –Exact definition of testing area –Exact definition of a forecast –Exact definition of input data used in forecasts –Exact definition of reference observation data –Measures of success for forecasts 46 Design of an Experiment

47
Caltech Tauc-Pd RT/AL: For each triggered station ≤ Dist-max, send one alert of: –M-est with Talert and Talgorithm –PGV-est with Talert and Talgorithm For each M ≥ M-min, send one alert of: –Number of reporting and non-reporting stations ≤ Dist-max as a function of Talert and Talgorithm UC Berkeley ElarmS RT and ETH VS: For each triggered event, send one alert of: –M-est as a function of Talert –Loc-est as a function of Talert –PGA-est at each station ≤ Dist-max without S-wave arrival as a function of Talert –PGV-est at each station ≤ Dist-max without S-wave arrival as a function of Talert Number of reporting and non- reporting stations ≤ Dist-max as a function of Talert 47 Design of an Experiment

48
Many CSEP testing principles are applicable to CISN EEW Testing. The following definitions need to be made to evaluate forecasts: –Exact definition of testing area –Exact definition of a forecast –Exact definition of input data used in forecasts –Exact definition of reference observation data –Measures of success for forecasts 48 Design of an Experiment

49
Input to forecasts are based on CISN real-time data –If system performance (e.g. missed events) are to be evaluated, CTC will need station-list in use at any time –Existing CISN often has problems keeping track of which stations are being used in forecasts 49 Design of an Experiment
 are to be evaluated, CTC will need station-list in use at any time –Existing CISN often has problems keeping track of which stations are being used in forecasts 49 Design of an Experiment.")
50
Many CSEP testing principles are applicable to CISN EEW Testing. The following definitions need to be made to evaluate forecasts: –Exact definition of testing area –Exact definition of a forecast –Exact definition of input data used in forecasts –Exact definition of reference observation data –Measures of success for forecasts 50 Design of an Experiment

51
Two authorized data sources have been integrated into the current CTC: –ANSS Catalog Earthquake Catalog –ShakeMap Shake_RssReader Event-based Observed Ground Motions delivered in Stationlist.xml files 51 Design of an Experiment

53
Summary Reports for each M ≥ M-min: Key documents is 3 March 2008 document which specifies six types of tests. –Summary 1: Magnitude –Summary 2: Location –Summary 3: Ground Motion –Summary 4: System Performance –Summary 5: False Triggers –Summary 6: Missed Triggers 53 Proposed Performance Measures

54
Design of Testing Experiment 54

55
Use CSEP Forecast Groups to Test different EEW information. –Event Parameters Magnitude Location –Site-specific Parameters: Site specific ground motion intensity 55 Design of an Experiment

56
Forecast Groups for different EEW Forecasting Systems. –Event Parameters Magnitude Location –Site-specific Parameters: Site specific ground motion intensity 56 Design of an Experiment Forecast Group Forecast ProducerExample Forecasters Forecast Parameters T1P-wave detectorCommercial AlarmPeak Site Intensity T2On-SiteCommercial Alarm, On-Site Magnitude, Peak Site Intensity T3Event Parameter System Network SystemLocation, Magnitude T4Event Parameter System with User Module Network System feeding User Modules Location, Magnitude, Grid- based Peak Site Intensities

57
Summary Reports for each M ≥ M-min: Key documents is 3 March 2008 document which specifies six types of tests. –Summary 1: Magnitude –Summary 2: Location –Summary 3: Ground Motion –Summary 4: System Performance –Summary 5: False Triggers –Summary 6: Missed Triggers 57 Proposed Performance Measures

58
Summary 1.1: Magnitude X-Y Diagram Measure of Goodness: Data points fall on diagonal line Relevant: T2,T3,T4 Drawbacks: Timeliness element not represented Which in series of magnitude estimates should be used in plot. 58 Experiment Design

59
Summary 1.2: Initial magnitude error by magnitude Measure of Goodness: Data points fall on horizontal line Relevant: T2,T3,T4 Drawbacks: Timeliness element not represented 59 Experiment Design

60
Summary 1.3: Magnitude accuracy by update Measure of Goodness: Data points fall on horizontal line Relevant: T3,T4 Drawbacks: Timeliness element not represented 60 Experiment Design

61
Summary Reports for each M ≥ M-min: Key documents is 3 March 2008 document which specifies six types of tests. –Summary 1: Magnitude –Summary 2: Location –Summary 3: Ground Motion –Summary 4: System Performance –Summary 5: False Triggers –Summary 6: Missed Triggers 61 Proposed Performance Measures

62
62 Experiment Design Summary 2.1: Cumulative Location Errors Measure of Goodness: Data points fall on vertical zero line Relevant: T3, T4 Drawbacks: Does not consider magnitude accuracy or timeliness

63
Summary 2.2: Magnitude and Location error by time after origin Measure of Goodness: Data points fall on horizontal zero line Relevant: T3, T4 Drawbacks: Event-specific not cumulative 63 Experiment Design

64
Summary Reports for each M ≥ M-min: Key documents is 3 March 2008 document which specifies six types of tests. –Summary 1: Magnitude –Summary 2: Location –Summary 3: Ground Motion –Summary 4: System Performance –Summary 5: False Triggers –Summary 6: Missed Triggers 64 Proposed Performance Measures

65
65 Experiment Design Summary 3.1 : Intensity Map Comparisons Measure of Goodness: Forecast map matches observed map Relevant: T4 Drawbacks: Not a quantitative results

66
Summary 3.2: Intensity X-Y Diagram Measure of Goodness: Data points fall on diagonal line Relevant: T1,T2,T4 Drawbacks: Timeliness element not represented Which in series of intensity estimate should be used in plots T3. 66 Experiment Design

67
Summary 3.3: Intensity Ratio by Magnitude Measure of Goodness: Data points fall on horizontal line Relevant: T1,T2,T4 Drawbacks: Timeliness element not represented Which intensity estimate in series should be used in plot. 67 Experiment Design

68
Summary 3.3: Predicted to Observed Intensity Ratio by Distance and Magnitude Measure of Goodness: Data points fall on horizontal line Relevant: T1,T2,T4 Drawbacks: Timeliness element not represented Which intensity estimate in series should be used in plot. 68

69
Summary 3.3: Evaluate Conversion from PGV to Intensity Group has proposed to evaluate algorithms by comparing intensities and they provide a formula for conversion to Intensity. 69

70
Summary 3.4: Evaluate Conversion from PGV to Intensity Group has proposed to evaluate algorithms by comparing intensities and they provide a formula for conversion to Intensity. 70

71
71 Experiment Design Summary 3.5: Statistical Error Distribution for Magnitude and Intensity Measure of Goodness: No missed events or false alarms in testing area Relevant: T4 Drawbacks:

72
72 Experiment Design Summary 3.6: Mean-time to first location or intensity estimate (small blue plot) Measure of Goodness: Peak of measures at zero Relevant: T1,T2,T3,T4 Drawbacks: Cumulative and does not involve accuracy of estimates
 Measure of Goodness: Peak of measures at zero Relevant: T1,T2,T3,T4 Drawbacks: Cumulative and does not involve accuracy of estimates")
73
Summary Reports for each M ≥ M-min: Key documents is 3 March 2008 document which specifies six types of tests. –Summary 1: Magnitude –Summary 2: Location –Summary 3: Ground Motion –Summary 4: System Performance –Summary 5: False Triggers –Summary 6: Missed Triggers 73 Proposed Performance Measures

74
74 Experiment Design No examples for System Performance Summary defined as Summary 4.1: Ratio of reporting versus non-reporting stations:

75
Summary Reports for each M ≥ M-min: Key documents is 3 March 2008 document which specifies six types of tests. –Summary 1: Magnitude –Summary 2: Location –Summary 3: Ground Motion –Summary 4: System Performance –Summary 5: False Triggers –Summary 6: Missed Triggers 75 Proposed Performance Measures

76
76 Experiment Design Summary 5.1: Missed event and False Alarm Map Measure of Goodness: No missed events or false alarms in testing area Relevant: T3, T4 Drawbacks: Must develop definitions for missed events and false alarms, Does not reflect timeliness

77
77 Experiment Design Summary 5.2: Missed event and False Alarm Map Measure of Goodness: No missed events or false alarms in testing area Relevant: T3, T4 Drawbacks: Must develop definitions for missed events and false alarms, Does not reflect timeliness

78
Summary Reports for each M ≥ M-min: Key documents is 3 March 2008 document which specifies six types of tests. –Summary 1: Magnitude –Summary 2: Location –Summary 3: Ground Motion –Summary 4: System Performance –Summary 5: False Triggers –Summary 6: Missed Triggers 78 Proposed Performance Measures

79
79 Experiment Design Summary 6.1: Missed Event map Measure of Goodness: No missed events in testing region Relevant: T3, T4 Drawbacks: Must define missed event. Does not indicate timeliness

80
End 80

81
SCEC: An NSF + USGS Research Center Application of the CSEP Testing Approach to Earthquake Early Warning and other Seismological Forecasts Philip Maechling Information Technology Architect Southern California Earthquake Center (SCEC) 24 September 2009
 24 September 2009")
82
Premise: EEW In California Is Imminent

83
EEW in Use in Japan - JMA Issued Ground Motion Alerts

84
EEW in Use in Japan – Emerging commercial market for ground motion alarms

85
Testing of Earthquake Forecast and Earthquake Early Warning is often Retrospective without Comparison to other Approaches

86
Can we Apply the CSEP Testing Approach to other Seismological Forecasts? CISN and SCEC recently received funding from USGS to develop and evaluate prototype network-based EEW: CISN Earthquake Early Warning (EEW) Testing Center which evaluates the system and seismological performance of the CISN real-time earthquake monitoring system. Discussions at SCEC Annual Meeting about Needed Test Center: Ground Motion Modeling Testing Center which verifies and validates 3D wave propagation simulations by comparing observational data against synthetic seismograms.
 Testing Center which evaluates the system and seismological performance of the CISN real-time earthquake monitoring system. Discussions at SCEC Annual Meeting about Needed Test Center: Ground Motion Modeling Testing Center which verifies and validates 3D wave propagation simulations by comparing observational data against synthetic seismograms..")
90
Testing Center System Requirements The goals of both an EEW and Earthquake Forecast Testing Center Goals (as outlined by Schorlemmer and Gerstenberger (2007)) describe what is needed to build trust in results: Controlled Environment Transparency Comparability Reproducibility
) describe what is needed to build trust in results: Controlled Environment Transparency Comparability Reproducibility")
93
Applying CSEP Style Testing To Other Seismological Forecasts CSEP collaboration has worked to define how short term earthquake forecast models can produce comparable results. –Define standard problems –Define standard forecast definition –Define standard regions under test –Define standard evaluation criteria –Testing performed independent of forecast developers CSEP testing approach helps to build acceptance and trust in forecast evaluations through its independent and transparent testing approach. We believe that other seismological forecasting groups can benefit from CSEP testing approach including: (a) Earthquake Early Warning (EEW) forecasts of final magnitude or peak ground intensity. (b) Computer modeling of 3D earthquake wave propagation which produces synthetic seismograms.
 Earthquake Early Warning (EEW) forecasts of final magnitude or peak ground intensity. (b) Computer modeling of 3D earthquake wave propagation which produces synthetic seismograms..")
94
SCEC3 Organization SCEC Director Board of Directors Planning PlanningCommittee External Advisory Council CEO Program Earthquake Geology Tectonic Geodesy Seismology Fault & Rupture Mechanics Earthquake Forecasting & Predictability LithosphericArchitecture & Dynamics Crustal Deformation Modeling Unified Structural Representation Seismic Hazard & Risk Analysis Public Outreach K-12 & Informal Education PetaShake PetaSHA-1 PetaSHA-2 Special Projects DisciplinaryCommittees Focus Groups CEO Activities U SE IT/SURE Intern Programs BroadbandPlatform CenterAdministrationInformationArchitect KnowledgeTransfer Ground Motion Prediction Earthquake Early Warning CSEP ACCESS Forum

95
PetaShake PetaSHA-1 PetaSHA-2 BroadbandPlatform Earthquake Early Warning CSEP California Integrated Seismic Network (CISN) Earthquake Early Warning Evaluation Funded by USGS NEHRP –$120K over 3 years (ending 2012) Science thrust areas: –CISN Development of a single integrated Real-time Earthquake Alerting system –Evaluation of system performance Computer science objectives –Unified CISN EEW system –Independent testing and analysis
 Earthquake Early Warning Evaluation Funded by USGS NEHRP –$120K over 3 years (ending 2012) Science thrust areas: –CISN Development of a single integrated Real-time Earthquake Alerting system –Evaluation of system performance Computer science objectives –Unified CISN EEW system –Independent testing and analysis")
96
Testing of EEW and STEF use Similar Science Techniques Comparison between algorithms encourages scientists to produce a results in a common and comparable format: CSEP: –e.g. RELM testing region defined for testing –CSEP Standard Grid and forecast statement –Standard evaluation test (N,L,R tests) EEW: –PGA or PGV converted to Intensity for comparison –Defined evaluation tests (CISN EEW document March 2008)
 EEW: –PGA or PGV converted to Intensity for comparison –Defined evaluation tests (CISN EEW document March 2008).")
97
Earthquake Catalog Earthquake Catalog Retrieve Data Filter Catalog Filtered Earthquake Catalog Earthquake Forecast Evaluation of Earthquake Predictions Earthquake Catalog Forecast EQs Evaluate Forecast Evaluation of CSEP Forecasts CSEP Collaboratory

98
Earthquake Catalog Retrieve Data Filter Catalog Filtered Earthquake Catalog CISN EEW Performance Summary Processing CISN EEW Testing Center and Web Site ANSS Earthquake Catalog UCB/ElarmSNI EEW Data Source CIT/OnSite EEW Data Source Load Reports EEW Trigger Reports EEW Trigger Reports Observed ANSS Data CISN EEW Trigger Data Produce Web Summaries

99
CSEP Evaluation of two one day forecasts STEP and ETA using R (log likelihood ratio) Test
 Test")
100
EEW Testing Center Provides On-going Performance Evaluation

101
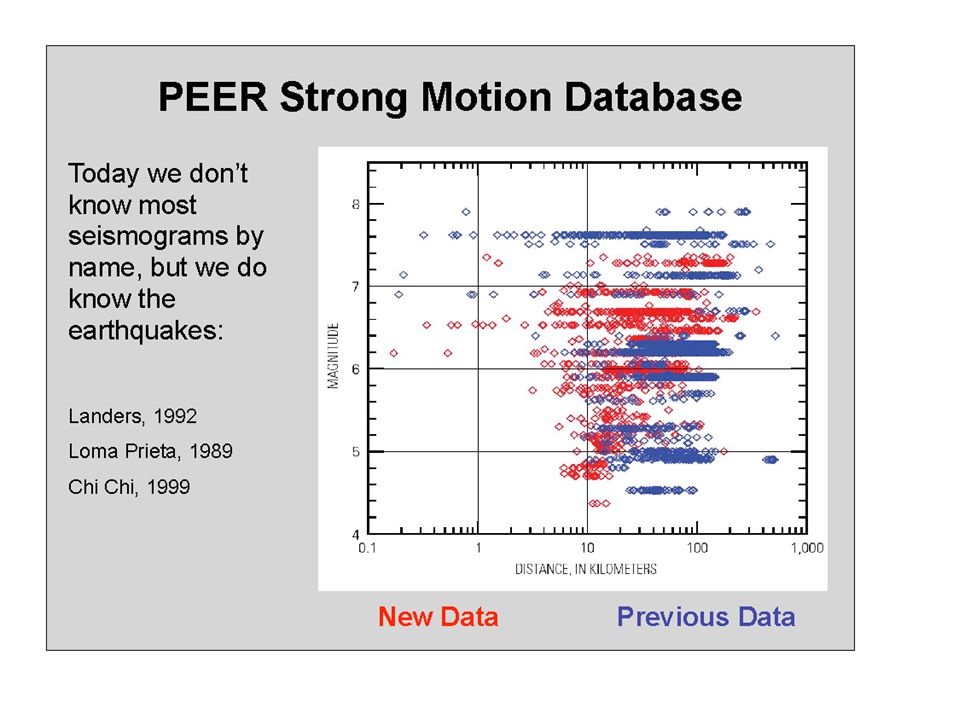
Can CSEP Be Adapted to Support Ground Motion Synthetics Synthetic Seismograms are in use by engineering communities: Development of hybrid attenuation relationships Seismograms for studying Tall Building Response to Strong Ground Motions Probabilistic Seismic Hazard Maps using 3D wave propagation as Ground Motion Prediction Equation (GMPE)
")
102
EEW Testing Center Provides On-going Performance Evaluation

104
Fig. 11. IM SA3.0 at POE 2% in 50 Years. Base is UCERF2 and average of 4 attenuation relationships

105
Fig. 11. IM SA3.0 at POE 2% in 50 Years. CyberShake 1.0 Map based on 224 Hazards curves at 10km spacing

106
Fig. 11. IM SA3.0 at POE 2% in50 Years. Difference between Base Map and CyberShake Map showing increase of hazard in LA Basin and in Riverside.

107
Fig. 6. Comparable Vs profiles across the Los Angeles Basin are shown with CVM4.0 (top) and CVM-H (bottom). The differences between the CVM 4.0 and CVM-H velocity models contribute to uncertainties in high frequency simulations. The CME collaboration is working with both velocity models in order to determine which produces best match to observation or if a new combined or merged model will be required for 2.0Hz and higher frequency deterministic wave propagation simulations for Southern California.
 and CVM-H (bottom). The differences between the CVM 4.0 and CVM-H velocity models contribute to uncertainties in high frequency simulations. The CME collaboration is working with both velocity models in order to determine which produces best match to observation or if a new combined or merged model will be required for 2.0Hz and higher frequency deterministic wave propagation simulations for Southern California..")
108
Dalguer et al (2008) Implications of the ShakeOut Source Description for Rupture Complexity and Near-Source Ground Motion Ensemble Dynamic Rupture ShakeOut Simulations Ensemble of dynamic ruptures for ShakeOut scenario produced a set of Kinematic source descriptions called the ShakeOut-D ruptures.
 Implications of the ShakeOut Source Description for Rupture Complexity and Near-Source Ground Motion Ensemble Dynamic Rupture ShakeOut Simulations Ensemble of dynamic ruptures for ShakeOut scenario produced a set of Kinematic source descriptions called the ShakeOut-D ruptures.")
109
Fig. 7. Validating regional scale wave propagation simulation results against observed data may require thousands of comparisons between observed and simulated data. The CME has developed an initial implementation of a Goodness of Fit (GOF) measurement system and is applying these new tools to help evaluate the 2Hz Chino Hills simulations. In this GOF scale, 100 is a perfect fit. The maps (left) show how GOF values vary geographically for AWP-Olsen, Chino Hill M5.4 event, and two different SCEC Community Velocity Models, CVM4.0 (left) and CVM-H 5.7 (right).
 measurement system and is applying these new tools to help evaluate the 2Hz Chino Hills simulations. In this GOF scale, 100 is a perfect fit. The maps (left) show how GOF values vary geographically for AWP-Olsen, Chino Hill M5.4 event, and two different SCEC Community Velocity Models, CVM4.0 (left) and CVM-H 5.7 (right)..")
110
Assertions for Discussion 1.Broad impact of seismological technologies (EEW, STEF, GMPE) are great enough to warrant significant effort for evaluation. 2.Independent evaluation for STEF, EEW, GMPE provides valuable service to agencies including CISN, USGS, CPEC, NEPC, and others. 3.Prospective must be done to before techniques will be accepted. 4.Similarities between problems lead to similar scientific techniques. 5.Similarities between problems lead to similar technology approach and potentially common infrastructure. 6.“Neutral” third party testing has significant benefits to the science grous involved in forecasting. 7.CSEP infrastructure can be adapted for use in CISN EEW Testing Centers. 8.A GMPE (Ground Motion Prediction Equation) Testing Center; using techniques similar to CSEP would have value both seismologists and building engineers.
 Testing Center; using techniques similar to CSEP would have value both seismologists and building engineers..")
Similar presentations


 Development Philip Maechling Information Technology Architect Southern California.>")


