Download presentation
Presentation is loading. Please wait.

1
Newcastle University, England, UK Peter Selman Newcastle University, UK pfselman@yahoo.co.uk Behind the Numbers: The Demography of Intercountry Adoption

2
The Rise and Fall of ICA The period from 1998-2009 saw a remarkable rise and fall in the number of children moving for intercountry adoption each year. In 1998 there were c 31,700 adoptions; by 2004 this had risen to over 45,000; By 2009 it had fallen to under 30,000 – less than in 1998. Available statistics for 2010 suggest that the global total will fall further, although numbers have increased in France and Italy

4
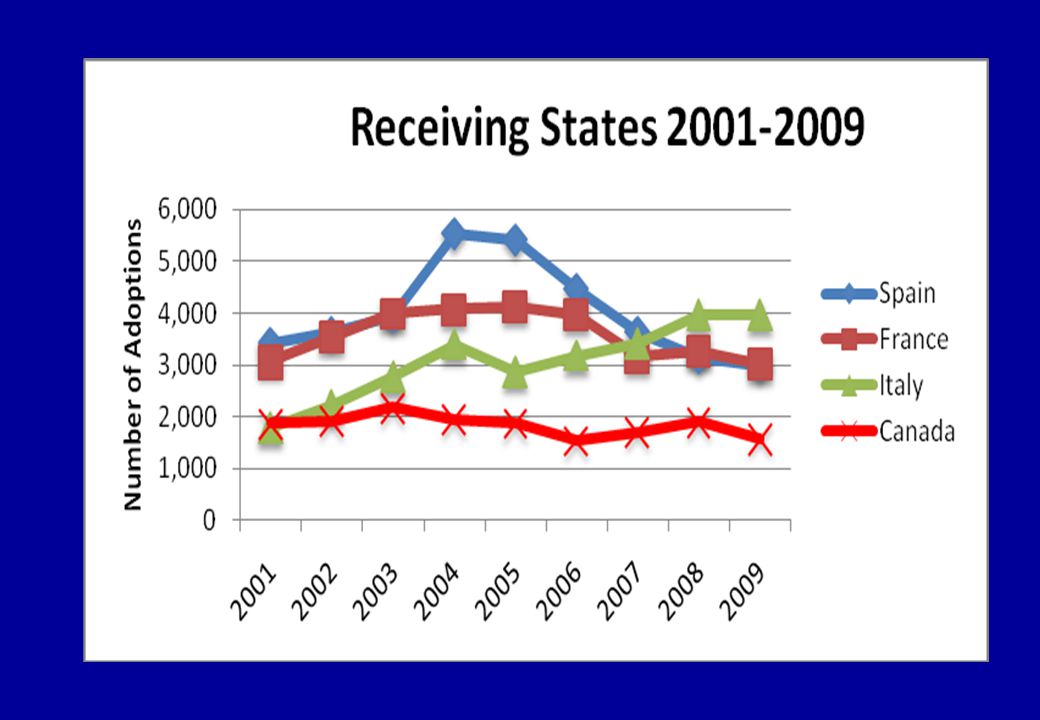
Intercountry Adoption 1998-2009 19982001200420082009 USA – FY Spain France Italy Canada Top 5 15,774 1,487 3,777 2,233 2,222 25,493 19,237 3,428 3,094 1,797 1,926 29,430 22,884 5,541 4,079 3,400 1,955 37,861 17,483 3,156 3,271 3,977 1,908 31,556 12,753 3,006 3,017 3,964 2,122 24,862 23 States % to USA 31,710 50% 36,391 53% 45,298 51% 34,774 50% 29,863 43%

6
Standardised Rates Although the United States receive most children for ICA, other countries have a higher level per 100,000 population. In 2004 the highest rates were found in Norway (15.4), Spain (13.0) and Sweden (12.3) The lowest rates were in Australia ( 1.9 ) Germany ( 0.8 ) and the UK ( 0.6 ) In Sweden in 1977 the rate was 22.6 and there were 2 adoptions for every 100 births
, Spain (13.0) and Sweden (12.3) The lowest rates were in Australia ( 1.9 ) Germany ( 0.8 ) and the UK ( 0.6 ) In Sweden in 1977 the rate was 22.6 and there were 2 adoptions for every 100 births.")
7
The rise in numbers 1998-2004 199820012004% change Spain Ireland Netherlands Italy USA 1,487 147 825 2,233 15,774 3,428 179 1,122 1,797 19,237 5,541 398 1,307 3,402 22,884 + 273 +171 + 58 + 52 + 45 22 States31,71036,39145,298 + 42 % Sweden Norway France Canada 928 643 3,777 2,222 1,044 713 3,094 1,874 1,109 700 4,079 1,955 + 19 + 10 + 8 - 15

8
Change in Numbers 2004-2010 20042009 % change 2010 Norway Netherlands Spain USA - FY 706 1,307 5,541 22,824 347 682 3,006 12,753 - 51 % - 48% - 46 % - 44% 343 697 n/a 11,059 23 states 45,29829,865- 35%n/a France Sweden Canada Italy 4,079 1,109 1,955 3,400 3,017 912 2,122 3,964 -27 % -18 % + 9 % + 17 % 3,504 (655) n/a 4,130
 n/a 4,130")
9
The Demographic History of ICA More than 400,000 children were adopted world-wide to 23+ countries between 2000 and 2010 – largest number for any decade The next four slides will explore the number adopted in previous decades since 1950 This will enable an estimate of the number of children adopted since the end of WW2

10
Intercountry Adoption 1990 -1999 Data were obtained for 15-20 countries from 1993 – 1999 and for 12 countries 1990-1992 About 225,000 children were adopted to these countries – many from China and Russia after 1992 - and 10,000+ from Romania in 1990/91 Estimated number not recorded would be at least 10,000. So decade total would be 235,000+

11
Intercountry Adoption 1980 - 1989 Kane (1993) obtained data from 14 countries – 8 had good data for 9-10 years; 4 for 5-8 years - but Canada sent data for Quebec alone but took many more ; 2 (Spain and Germany) had data for only 3 years. Data sent amounted to 163,000 (78,000 – 47% - from the USA), Kane estimates a minimum of 170-180,000 for the decade.
, Kane estimates a minimum of ,000 for the decade..")
12
Intercountry Adoption 1970-1979 Data for 5 countries (USA; Holland; Denmark, Norway and Sweden) – give a total of 77,000. Belgium and France received 6,000 from Korea alone during this decade. Children were also sent by India, Indonesia, Thailand, Vietnam and several Latin American countries; and received in addition by Canada, Germany, Italy Luxembourg and Switzerland. A decade total of at least 90-100,000 is likely.

13
Intercountry Adoption 1948-1969 Altstein & Simon (1991) record more than 31,000 to USA; there were 4,500 to Sweden; and children also went to the Netherlands, Belgium and Scandinavia) Korea sent 9,000+ children from 1953-1969 Germany sent 30,000 ( 5,000+ to the US) Greece sent c 4,000 to US and 400+ to Netherlands Children were also sent from Austria and Japan The total number moving in these years will be at least 50,000+
 record more than 31,000 to USA; there were 4,500 to Sweden; and children also went to the Netherlands, Belgium and Scandinavia) Korea sent 9,000+ children from Germany sent 30,000 ( 5,000+ to the US) Greece sent c 4,000 to US and 400+ to Netherlands Children were also sent from Austria and Japan The total number moving in these years will be at least 50,000+")
14
Summary of Estimate 1948-2010 2000-2010410,000 1990-1999235,000 + 1980-1989180,000 (Kane) 1970-197995,000 + 1948-1969 50,000 + All states 1948-2010 =970,000+ USA 1948-2010=450,000
 , ,000 + All states =970,000+ USA =450,000")
15
Countries of Origin Many countries have been involved in intercountry adoption and those sending most children have changed over time. Korea has the longest sequence of official statistics (1953-2009) - total over 165,000 by 2010. Between 1992 and 2010 China has sent more than 125,000 children for ICA; Russia more than 110,000 Tables below are based on statistical returns to the 2010 Hague Special Commission or on estimates from data from receiving States.
 - total over 165,000 by Between 1992 and 2010 China has sent more than 125,000 children for ICA; Russia more than 110,000 Tables below are based on statistical returns to the 2010 Hague Special Commission or on estimates from data from receiving States..")
16
Top 7 Sending Countries: 1980-2009 1980-89199820042009 Korea India Colombia Brazil Sri Lanka Chile Philippines China Russia Vietnam Korea Colombia Guatemala India China Russia Guatemala Korea Ukraine Colombia Ethiopia China Ethiopia Russia Ukraine Vietnam Korea Colombia

17
Top 6 Sending Countries 2009 USA FYSpainItaly France China Ethiopia Russia Korea Guatemala Ukraine Russia Ethiopia China Ukraine Colombia Kazakhstan Russia Ukraine Colombia Ethiopia Brazil Poland Haiti Ethiopia Vietnam Russia Colombia Mali

18
States of Origin 2005-2009 200520072009 2005-9 TOTAL TO 23 STATES 43,40237,51429,045- 14,357 CHINA GUATEMALA RUSSIA Three States 14,493 3,857 7,471 8,754 4,850 4,881 4,890 356 3,693 - 9,603 - 3,501 - 3,778 - 16,882 ETHIOPIA HAITI VIETNAM Three States 1,778 921 1,190 3,031 779 1,692 4,564 1,238 1,497 + 2,786 + 317 + 307 - 3,410

20
Standardised Rates China sends most children for intercountry adoption other countries send more in relation to their level of births (adoptions per 1,000). China Ratio – 0.3 in 2009 From 2003-2009, the highest levels were found in Bulgaria (15.5 in 2003) and Guatemala (10.8 in 2007); Haiti may reach 9-10.0 in 2010. Higher levels for Romania in 1991 and Korea in the 1980s. India’s adoption ratio (0.02 in 2009) is the lowest of the top ten sending countries. Ethiopia’s ratio rose from 0.3 in 2003 to 1.5 in 2009
 and Guatemala (10.8 in 2007); Haiti may reach in Higher levels for Romania in 1991 and Korea in the 1980s. India’s adoption ratio (0.02 in 2009) is the lowest of the top ten sending countries. Ethiopia’s ratio rose from 0.3 in 2003 to 1.5 in")
21
Adoption Ratios in States of Origin 2003 – 2009 – by rank in 2005 Country20032005 20072009 Guatemala Latvia Russia Ukraine Haiti Korea Bulgaria China Ethiopia Belarus India 6.4 3.6 6.3 5.0 4.2 4.7 15.5 0.6 0.3 7.2 0.02 8.8 5.4 4.9 4.4 3.6 3.8 1.9 0.84 0.56 0.26 0.03 10.8 6.7 4.5 2.5 4.0 1.4 0.6 0.95 0.4 0.04 0.8 6.1 2.5 3.5 4.5 2.8 3.5 0.3 1.5 0.3 0.02

22
Age of Children Adopted USA 2008USA 2005 Under 1 1-45+ Under 1 1-45+ Korea 86%12%1%92%8%0% Guatemala 48%47%5%79%18%3% China 24%66%10%35%63%3% Russia 4%75%21%20%51%29% Ukraine ---30%70%---53%47% Brazil ---27%73%5%22%74%

23
Age of Children Adopted in Key Receiving states - Hague 200520072009 % over 5 % under 1 % over 5 % under 1 % over 5 % under 1 Italy47%6%50%10%58%7% France24%32%33%23%34%21% USA 16%42%18%39%25% Iceland6%17%11% 29%6% Australia 8%47%8%41%9%37%

24
Adoptions from ASIA Asian adoptions represented a majority (55%+) of all transnational adoptions until the mid-1980s In the 21st century Asia accounts for 40%+ : 46% in 2005 falling to 35% in 2009, when Asia accounted for 80% of adoptions to Australia; 60% of adoptions to Sweden; 45% for USA; 25% for Spain; 20% for Italy and France In recent years there have been major concerns over adoption from India, Vietnam and Nepal
 of all transnational adoptions until the mid-1980s In the 21st century Asia accounts for 40%+ : 46% in 2005 falling to 35% in 2009, when Asia accounted for 80% of adoptions to Australia; 60% of adoptions to Sweden; 45% for USA; 25% for Spain; 20% for Italy and France In recent years there have been major concerns over adoption from India, Vietnam and Nepal")
25
CHINA 2005-2009 – CCAA data 20052006200720082009 USA6,1384,7363,5153,029 Spain2,6081,269738817 Canada928748496294379 Netherland667367330297 Sweden432335248198255 France43933117813995 Australia124112935755 To 17 states 14,22110,6467,858 5,5315,294 7,933 1,909

26
% of Children Adopted from China with special needs 200520072009 Netherlands13%42%66% USA14%42%61% All States9%30%49% Sweden6%25%48% France 6%13%34% Spain0.1%4%9% Australia 1%0%5%

27
4 Asian States of Origin 2001-2008

28
Adoption from South Korea In 2007 for the first time for many years there were more domestic than intercountry adoptions. But the annual number of transnational adoptions remains high for a country which is now rich and has lowest fertility in Asia. Most adoptions are now of children of unmarried mothers - see I wish for you a beautiful life Korea still sends more children per 1,000 births than Ethiopia or China.

29
KOREA 1998-2009: Min H&W 19982003200620082009 USA 1,8541,7481,503988850 Norway 13181704540 Sweden 111110907684 Australia 84108541834 Canada 893967867 TOTAL 2,4432,2871,8991,2501,125 In-country 1,4261,5141,3321,3061,314

30
Adoption in India India has the lowest adoption ratio of any major sending country and numbers have been falling in recent years. In-country adoptions are now more numerous, but remain few in relation to need. But concern over irregularities have been increasing. The agency Preet Mandir was exposed by CNN as “selling” babies to foreigners - see also writing of David Smolin in US and Julia Rollings in Australia, whose adopted children had been stolen..

31
INDIA 1998 -2010 19982004200620092010 USA478406320297243 Italy194102136132123 Spain481177929 Canada179703659 Denmark1201003024 To 20 States 1,5961,086861725 CARA data1,4061,021852666593 In-country1,7461,7072,4091,8525,309

32
In-country and Intercountry Adoption in India and Korea INDIAKOREA Intercountry In-country Intercountry In-country 1990 1995 2000 2004 2008 1,272 1,236 1,364 1,021 821 1,075 1,424 1,870 2,294 2,169 2,962 2,180 2,360 2,258 1,250 1,647 1,025 1,686 1,641 1,306 Pop 2005 1,103 million47.8 million Births 2005 25,926 thousand438 thousand Ratio0.0340.0884.83.3

33
VIETNAM 2003-2010 Receiving Country 20032005200820092010 France234790284308469 Italy59140313231251 USA38278284819 Ireland399218213610 Sweden32805065 Canada450105159 TOTAL4881,1951,6951,497(739)
")
34
Nepal 2003-2010 Receiving Country 2003-92003200620092010 Spain 582381730 Italy 3776490859 USA 3454266630 France 2393661319 Other 15014203(4) Total 1,73719441020(112)
 Total 1, (112)")
35
The rise and fall of adoptions from Eastern Europe The fall of Ceausescu and media coverage of the Romanian orphanages led to estimated 10,000+ adoptions in 1990/91. From 1995 Russia and other E. Europe states sent many In 2005 Romania called a total end to non-relative ICA. Adoptions have also ended in Belarus and fallen in Bulgaria As a result the proportion of ICA from Europe - excluding Kazakhstan - fell from 31% in 2003 to 23 % in 2009 - BUT number of children – many older or special needs - sent from Latvia, Lithuania and other new EU states has risen.

36
Eastern Europe 2003-2009 2003200420062009 Russia 7,7469,4266,7664,039 Ukraine 2,0522,0211,0311,523 Bulgaria 96339396222 Belarus 6566273427 Romania 47328900 Poland 346406362401 Hungary 6970100120 EUROPE 13,05813,9499,0436,793

37
RUSSIA 2004-2010 Receiving Country 20042005200720092010 US (FY) 5,8654,6393,7061,5861,082 Spain 1,6181,262955868 Italy 739628492704707 France 445357402288301 Ireland 18913116010080 Israel 957310875 Total 9,4267,4794,8794,039(2,221)
 5,8654,6393,7061,5861,082 Spain 1,6181, Italy France Ireland Israel Total 9,4267,4794,8794,039(2,221)")
38
Intercountry Adoption from Africa For many years intercountry adoption from Africa was rare. However, the growing demand for young infants - and in the US publicity surrounding adoption from Ethiopia by Angelina Jolie – has changed all that. In 2003 Africa accounted for 5% of all intercountry adoptions – by 2009 this had risen to 22% In 2009 Ethiopia was the second largest source of children for ICA after China and the main supplier of children to Belgium, Canada and Denmark. And numbers sent by Nigeria, Mali and Congo (Democratic Republic) are rising.
 are rising..")
39
AFRICA 2004-2009 (US FY) 20042006200720082009 Ethiopia1,5272,1723,0313,8964,564 M adagascar 335133711536 S. Africa242206202214283 Nigeria9410481225184 Liberia8736933424936 Mali82125158104191 Congo12626862149 TOTAL2,9503,8204,6705,6106,372

40
ETHIOPIA 2001-2010 20012004200720092010 USA FY1582891,2552,2772,513 Spain0220481722 France234390417445352 Italy79193256346274 Canada1534135170 Belgium3862124143127 Denmark234139125 TOTAL7281,5243,0334,564

41
Adoption from Latin America In the 1980s 8 of the top 12 sending countries were from Latin America. In 2008 only 3 - Guatemala, Colombia and Haiti - were in the top 12; in 2009 only Colombia and Haiti. Brazil still sends 4-500 children a year, most are older or have special need: Peru and Mexico send 100 150; Chile and El Salvador send less than 100. Haiti has become a major source for France, Canada, the USA and the Netherlands – hence the concern over recent events.

42
Latin America 2003-2009

43
Child Rescue or Child Theft ? In 2007 a French Charity Zoe’s Ark was accused of child trafficking in the case of the 103 children it attempted to fly out of Chad - and sentenced in Chad to 8 years hard labour. In 2010 The Haitian Earthquake raised fears of “rescue” of children affected. 10 members of an Idaho-based Baptist charity were arrested for trying to take 33 Haitian children across the border with the Dominican Republic without proper paperwork – none were orphans Meanwhile fears were also raised over plans to “expedite” adoptions which were “in the pipe-line” – leading to a major report from ISS.

44
HAITI: ISS Report (Aug 2010) Report highlights many areas of concern over how adoptions were expedited after earthquake Accepts that adoptions in “pipeline” with appropriate adoption judgement may be expedited but only after a “waiting period” For other children, hindsight indicates that heightened risks outweigh any benefits, Urgent need for a common approach which does not circumvent vital procedures
 Report highlights many areas of concern over how adoptions were expedited after earthquake Accepts that adoptions in pipeline with appropriate adoption judgement may be expedited but only after a waiting period For other children, hindsight indicates that heightened risks outweigh any benefits, Urgent need for a common approach which does not circumvent vital procedures")
45
HAITI 2006-2010 Receiving Country 20062007200820092010 France 571403731651992 USA 3091903023301,223 Canada 12389148141(203) N/lands 41289160108 Germany 23316130(62) Belgium 103114 Tota l (+ ISS) 1,0967791,3681,2382,337 (2,625)
 N/lands Germany (62) Belgium Tota l (+ ISS) 1, ,3681,2382,337 (2,625)")
46
United States 2005-2009 Receiving Country 20042005200620082009 Canada 8110296189253 Netherlands 1632385634 UK 13181419n/a Switz 944515 Sweden 341075 Total 128169178289314 US State Deoartment -- 630

47
What happened in 2009-10 ? The continued decline in global numbers was largely due to the moratorium on adoptions from Guatemala and Liberia to the USA. The rise in adoptions from Ethiopia accelerated Adoptions from Haiti doubled after earthquake No. of Adoptions to Sweden, Denmark and Norway increased in 2009; and to France and Italy in 2010. As a result adoptions to Europe outnumbered those to USA for first time since the 1980s.

48
What will happen in 2011 ? ?? Adoptions will recommence from Guatemala and Liberia Adoptions from Haiti and Korea will be fewer Adoptions from Ethiopia will decline Pressure on other African states will increase Adoptions from Nepal and Vietnam will rise Global numbers will continue to decline International Surrogacy will continue to rise

Similar presentations