Download presentation
Presentation is loading. Please wait.

1
Indoor Air Pollution in Rural Indian Households: Predicting Exposures and Cost-Effective Interventions Sumi Mehta, MPH, Ph.D

2
Overview Background/health effects of indoor air pollution (IAP) Predicting household concentrations in Andhra Pradesh, India Choosing interventions: cleaner fuels vs. improved ventilation and health

3
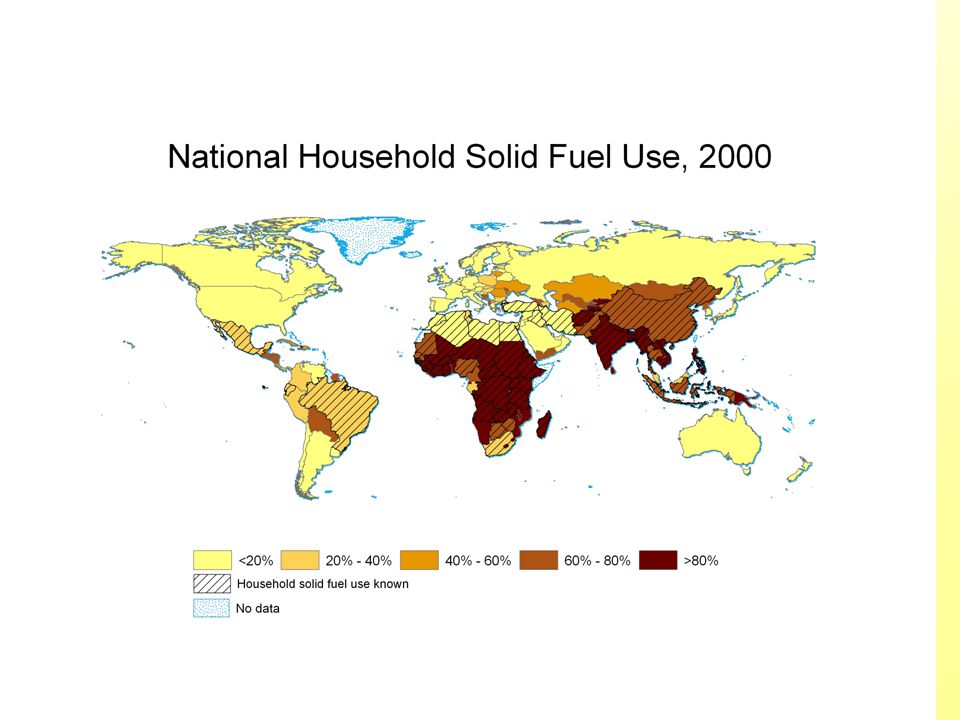
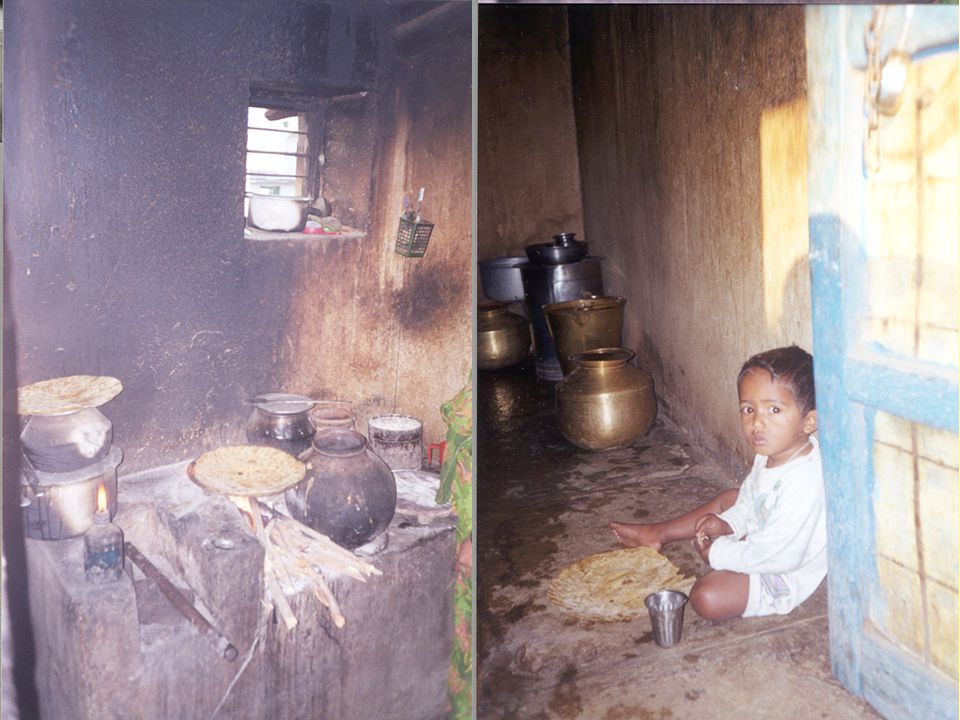
IAP = Solid fuels + Limited Ventilation Cooking and heating with solid fuels, including dung, wood, agricultural residues, and coal, is likely to be the largest traditional source of indoor air pollution (IAP) on a global scale. –Around half of the world cooks with solid fuels, including more than 75% of India and China, and 50-75% in South America and Africa. –Health damaging pollutants in the smoke include respirable particles, carbon monoxide, nitrogen and sulfur oxides, and benzene –Exposures can be many times greater than WHO guidelines, and much higher than outdoor levels in cities with the highest air pollution levels. –Women and young children are likely to have the highest burdens of exposure.

6
Health Effects of IAP from Solid Fuels WeakChildrenAsthma Ischaemic Heart Disease Blindness (Cataracts) Tuberculosis Lung Cancer (coal only) Chronic Obstructive Pulmonary Disease (COPD) Acute Respiratory Illness (ARI) Illness SuggestiveWomen >15 ModerateWomen >15 ModerateWomen >15 Strong*Women >15 Strong*Adults >15 Strong*Children <5 EvidencePopulation
 Tuberculosis Lung Cancer (coal only) Chronic Obstructive Pulmonary Disease (COPD) Acute Respiratory Illness (ARI) Illness SuggestiveWomen >15 ModerateWomen >15 ModerateWomen >15 Strong*Women >15 Strong*Adults >15 Strong*Children <5 EvidencePopulation")
7
Health Effects Currently, indoor smoke from solid fuels causes an estimated 1.6 million deaths each year (37.5% of LRI, 22.0% of COPD, and 1.5% of lung cancers). The vast majority of deaths occur from LRI in young children under five years of age. 2.7% of the entire global burden of disease (loss of healthy life due to death or illness) is attributable to indoor smoke from solid fuels. Over 30% of this burden is borne by the people of Africa and South/Southeast Asia
 is attributable to indoor smoke from solid fuels. Over 30% of this burden is borne by the people of Africa and South/Southeast Asia.")
8
LRI Deaths From Solid Fuel Use in Children Under Five, 2000

9
How does this compare with other risk factors on a global scale?

10
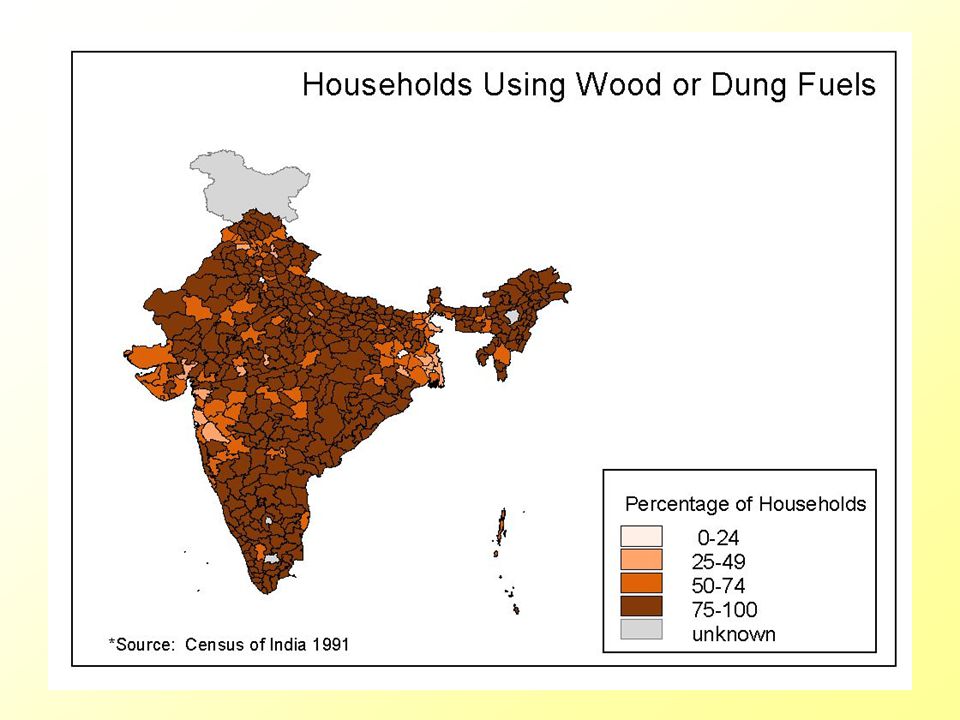
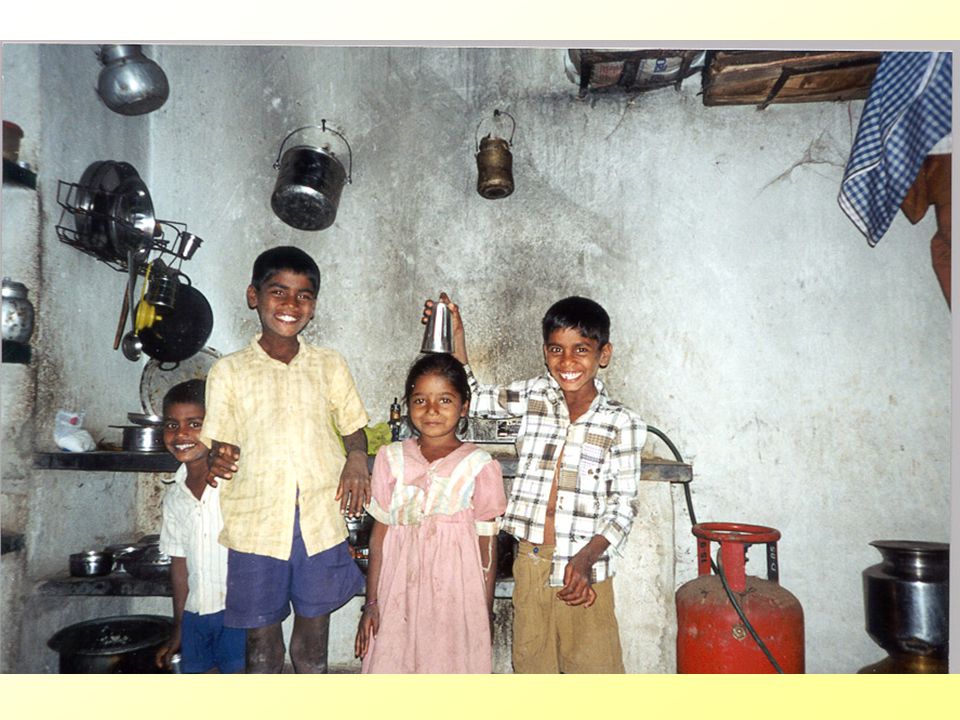
~ 80% of Indian households cook with solid fuels (1991 Census of India) 1.How can we quickly and cheaply identify households likely to have the highest exposures? –How can we create refined regional and national exposure profiles with a minimal amount of air sampling? –How do differences in housing/ventilation affect exposures? –Can household characteristics be used to predict exposures? 2.What should be done to reduce exposures? –What are possible strategies to reduce exposure? –Choosing interventions that are cost-effective

14
03 = Warangal District 20 = Rangareddy District 22 = Nizamabad District Predicting household concentrations in Andhra Pradesh, India

15
Brief Methodology 1)A household questionnaire is administered to collect information on housing type, kitchen type, stove type, ventilation, and other factors thought to be related to indoor air pollution. (IHS, Hyderabad) 2)Using respirable particulate matter as an indicator pollutant, 420 households are monitored for daily average concentrations of indoor air pollution in the kitchen and living areas and a subset is monitored on a real-time basis. (SRMC&RI, Chennai) 3)Models to predict concentrations based on housing characteristics are developed. (UC Berkeley)
 2)Using respirable particulate matter as an indicator pollutant, 420 households are monitored for daily average concentrations of indoor air pollution in the kitchen and living areas and a subset is monitored on a real-time basis. (SRMC&RI, Chennai) 3)Models to predict concentrations based on housing characteristics are developed. (UC Berkeley).")
16
Qualitative Exposure Assessment: Household Characteristics Information that parallels demographic surveys (Census and the National Family Health Survey) –Main cooking fuel –Housing materials Information on household characteristics not well characterized in demographic health surveys –Kitchen type –Mixed fuel use –Household ventilation –Fuel source, collection time, price, quantity
 –Main cooking fuel –Housing materials Information on household characteristics not well characterized in demographic health surveys –Kitchen type –Mixed fuel use –Household ventilation –Fuel source, collection time, price, quantity")
17
Quantitative Exposure Assessment: Respirable Particulate Matter Why sample for respirable particulate matter? –PM is an indicator pollutant often used in air pollution and health research –Focus on combustion particles (bulk <1 μm) –Gradual cutoff (mean particle size range from 2–10 μm, median 4 μm) useful for some human respiratory health hazards (excludes particles in same way airways prevent particles from reaching alveolar region) Average daily concentrations of respirable particulate matter –Kitchen –Living Area
 –Gradual cutoff (mean particle size range from 2–10 μm, median 4 μm) useful for some human respiratory health hazards (excludes particles in same way airways prevent particles from reaching alveolar region) Average daily concentrations of respirable particulate matter –Kitchen –Living Area.")
18
Predictor Variables Used in Modeling

19
Predicting Kitchen Concentrations *Reference Category † 95% Confidence Interval for the Odds Ratio

20
CART Kitchen Area Predictions

21
Kitchen Concentrations: Summary Fuel type –Best predictor of high concentrations, but poor predictor of low concentrations –Wide range of concentrations within fuel categories Kitchen type –Indoor kitchens more likely to have high concentrations than outdoor kitchens Ventilation –Households with good kitchen ventilation are much less likely to have high concentrations

22
Implications Fuel use the most important predictor of household air pollution Not all solid fuel using households experience high exposures, however Targeting ventilation can reduce exposure within solid fuel using households: –Improve ventilation in kitchen / housing (locally appropriate interventions) –Improved stoves that vent to the outside
 –Improved stoves that vent to the outside")
23
Internal Model Validation Consistency: Same variables significant across CART and regression models Stability: Results consistent across different high/low concentration cut-points Cross Validation: Bootstrap aggregation (average of 50 re-samplings of data) did not improve model, suggesting model stability
 did not improve model, suggesting model stability")
24
External Model Validation: Tamil Nadu

25
The model performs even better on the Tamil Nadu data, where monitoring was conducted during cooking times model could be used to identify households where cooks are likely to have higher exposures differences in housing characteristics could influence peak exposures more than average exposures Future steps: Conduct similar modeling exercises in other regions (differences in climate, housing, cooking practices, fuel use)
")
26
An Indicator for Indoor Air Pollution ‘Access to water and sanitation’ Widely accepted household environmental health indicator Systematically collected at reported at regional and national levels ‘Access to clean fuel and ventilation’ The indoor air pollution parallel Assessing kitchen type and / or kitchen ventilation is low cost, easy to collect Indicator of potential for increased exposure, not actual household concentrations

27
Cost Effectiveness Analysis Methodology developed by the World Health Organization WHO – CHOICE: CHOosing Interventions that are Cost-Effective www.who.int/evidence/cea Examine results for IAP using methodology consistent with other risk factors and diseases Sectoral, population-level cost-effectiveness analysis (CEA) Enhances comparability between interventions 14 distinct epidemiological sub-regions - available for country-level adaptation / analysis Effectiveness: DALYs averted (accounting for coverage and adherence) Results here are for WHO Region SEAR D (India comprises ~80% of this region)
 Enhances comparability between interventions 14 distinct epidemiological sub-regions - available for country-level adaptation / analysis Effectiveness: DALYs averted (accounting for coverage and adherence) Results here are for WHO Region SEAR D (India comprises ~80% of this region)")
28
Interventions addressed –Cleaner fuels LPG / Propane Kerosene / Paraffin –Improved ventilation (improved stoves) –Combined intervention scenario 50% cleaner fuels remainder improved stoves
 –Combined intervention scenario 50% cleaner fuels remainder improved stoves")
30
Cost Effectiveness Analysis: Effectiveness Exposed Population = (Population using solid fuel)x(Ventilation Factor) Efficacy estimates based on meta-analyses of epidemiologic literature Assume improved stoves result in ventilation factor of 0.25 Lower Respiratory Infections (LRI) reduction of LRI in young children < 5 RR = 2.3 (CI 95%: 1.9, 2.7) Chronic Obstructive Pulmonary Disease (COPD) decreased severity, postponed incidence of COPD in nonsmoking adults RR = 3.2 (CI 95%: 2.3, 4.8) women RR = 1.8 (CI 95% 1.0, 3.2) men
x(Ventilation Factor) Efficacy estimates based on meta-analyses of epidemiologic literature Assume improved stoves result in ventilation factor of 0.25 Lower Respiratory Infections (LRI) reduction of LRI in young children < 5 RR = 2.3 (CI 95%: 1.9, 2.7) Chronic Obstructive Pulmonary Disease (COPD) decreased severity, postponed incidence of COPD in nonsmoking adults RR = 3.2 (CI 95%: 2.3, 4.8) women RR = 1.8 (CI 95% 1.0, 3.2) men")
31
Cost Effectiveness Analysis: Costs User and programme level costs included Ingredients approach (separate specification of quantities and prices) Include training and maintenance components –This is crucial for sustainability of improved stove programs!
 Include training and maintenance components –This is crucial for sustainability of improved stove programs!")
32
Cost Effectiveness Analysis: Costs Average annual cost in Sear D (‘000 International Dollars) *includes stove, cylinder (for Propane / LPG), fuel
 *includes stove, cylinder (for Propane / LPG), fuel")
33
Cost Effectiveness Analysis: Effectiveness Average annual healthy years gained in Sear D* *discounted 3%, age weighted

34
Cost Effectiveness Ratios (CER) for Sear D InterventionCER (I$/healthy year gained) LPG / Propane 7,350 Kerosene / Paraffin1,380 Improved Stoves610 Combination: LPG and improved stoves 4,280 Combination: kerosene and improved stoves 1,040
 for Sear D InterventionCER (I$/healthy year gained) LPG / Propane 7,350 Kerosene / Paraffin1,380 Improved Stoves610 Combination: LPG and improved stoves 4,280 Combination: kerosene and improved stoves 1,040")
35
Limitations and Considerations: Kerosene will appear consistently more cost-effective than liquid petroleum gas (LPG) because it is cheaper. –concerns about kerosene use, including poisoning and possible carcinogenic effects, should be carefully considered before recommending its use Effectiveness of improved stoves is dependent on proper training and maintenance. Intended for health policy decision makers, this focuses on health benefits alone. Other key non-health benefits include: –time savings –reduction of women’s drudgery –community development (improved stove programs) –longer term implications for climate change
 –longer term implications for climate change.")
36
Policy Implications People need access to cleaner fuels and improved ventilation While cleaner fuels offer more benefits than improved ventilation, it may be more feasible to reduce exposures through improved ventilation in the short run, until the longer-term goal of providing everyone with access to cleaner fuels can be attained.

Similar presentations

 Climate effects Deteriorate air quality BC,>")


 BIENNIAL CONFERENCE November 29 th 2010 Liz Bates.>")


