Download presentation
Presentation is loading. Please wait.

1
Department of Engineering and Public Policy Carnegie Mellon University Integrated Assessment of Particulate Matter Exposure and Health Impacts Sonia Yeh Advisor: Mitchell Small

2
Department of Engineering and Public Policy Carnegie Mellon University 2 Outline Background and project overview Health effect model Exposure simulation health model Results and conclusions Summary

3
Department of Engineering and Public Policy Carnegie Mellon University 3 Particulate Matter Air Pollution Particulate Matter is the suspended atmospheric aerosol and one of the six criteria pollutants in Clean Air Act PM 10 and PM 2.5 are called the coarse and fine particles with aerodynamic diameter less than 10 and 2.5 m respectively. Sources: –ambient: natural, anthropogenic: combustion, agriculture burning, construction… –indoor: smoking, cooking, fireplace, resuspended particles...

4
Department of Engineering and Public Policy Carnegie Mellon University 4 Epidemiological studies Classical epidemiology model in air pollution studies assumes the observed ambient PM concentration is an adequate surrogate for personal exposure to PM. Using regression techniques, studies have identified a significant association between air pollution and: –premature mortality –increased hospital admissions and emergency room visits (primarily in elderly and individuals with cardiopulmonary disease) –increased respiratory symptoms and diseases –decreased lung function
 –increased respiratory symptoms and diseases –decreased lung function.")
5
Department of Engineering and Public Policy Carnegie Mellon University 5 Exposure/indoor particle studies Personal RSP (respirable suspended particles) concentrations are substantially higher on average than outdoor concentrations and exhibit a greater range of variability. Personal exposure is only somewhat correlated with indoor concentration and even less correlated with outdoor concentration Using ambient PM measurements as a surrogate for personal exposure introduces misclassification error and bias.

6
Department of Engineering and Public Policy Carnegie Mellon University 6 The new evidences suggest... Industry: Forget about ambient PM, indoor exposure is the guilt; Experts: Epidemiological studies are still valid, but maybe –overestimated; –underestimated; –uncertain; Difficulties: To prove the true relationship, need large studies on personal exposure to gain enough statistical power and re-estimate the exposure-response slope.

7
Department of Engineering and Public Policy Carnegie Mellon University 7 Critical issues and project goals NRC’s top 10 research priorities to reduce uncertainties about PM risks: EPA is calling for applications for research centers on PM study. Missions: –Relationship between ambient/personal PM in normal and susceptible populations, –Measurement errors and bias effect, –Develop and apply advanced methods for statistical analysis, –Identifies the uncertainties.

8
Department of Engineering and Public Policy Carnegie Mellon University 8 Project Overview Epidemiological studies HEALTH MODEL Predictions of health risks Personal exposure simulation model Bias- correction factor Fractional contributions of outdoor PM EXPOSURE-HEALTH MODEL Predictions of health risks Ambient central monitoring PM concentration Indoor source model Micro- environment model

9
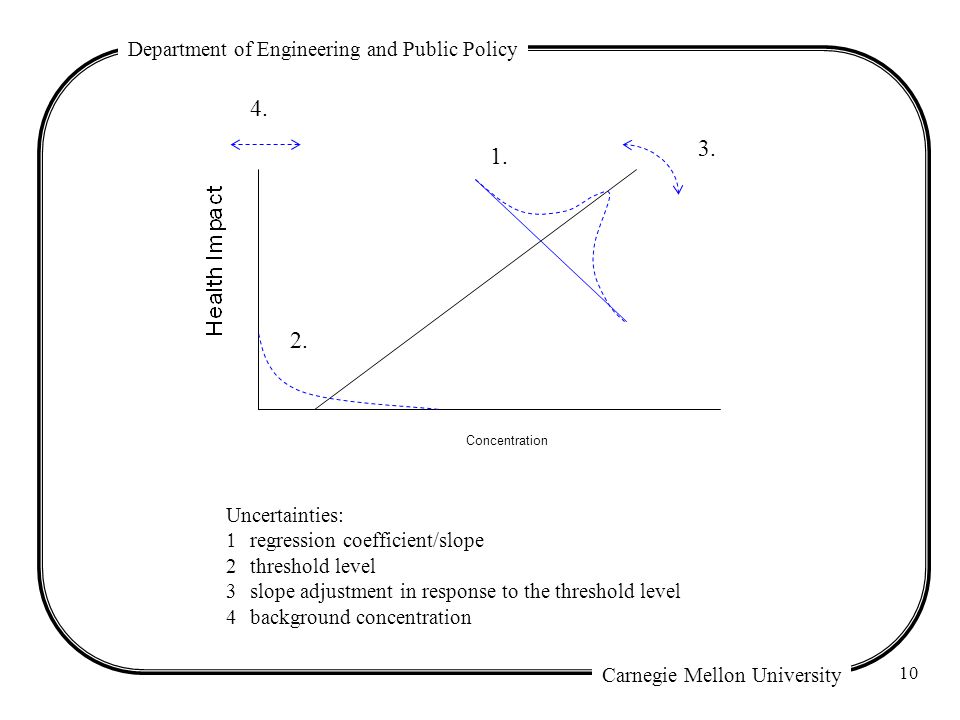
Department of Engineering and Public Policy Carnegie Mellon University 9 Health effect model y: excess mortality, y: baseline health incidence rate, : slope of the concentration- response curve. x: changes in PM air quality concentration If x-threshold > 0 Regression in the Epidemiological studies:

10
Department of Engineering and Public Policy Carnegie Mellon University 10 Concentration Uncertainties: regression coefficient/slope 2threshold level 3slope adjustment in response to the threshold level 4background concentration 1. 2. 3. 4.
11
Department of Engineering and Public Policy Carnegie Mellon University 11 Exposure model Micro environment model ( C per = T out C out + T in C in ) Indoor-source mass balance model:
 Indoor-source mass balance model:")
12
Department of Engineering and Public Policy Carnegie Mellon University 12 Exposure-health model C per = alpha C out + R alpha: fractional contribution of ambient PM to personal exposure R: residuals contributed from other indoor sources If R > threshold If R < threshold In the Epidemiology model: Y = intercept + Z (ambient) + Error In the Exposure model: Y = intercept + BX (personal) + error BIAS =
 + Error In the Exposure model: Y = intercept + BX (personal) + error BIAS =")
13
Department of Engineering and Public Policy Carnegie Mellon University 13 Air Quality and Demographic Data Air Quality and Demographic Data - Los Angeles County, 1997 Total Population: 9.1 million Children < 14 yrs: 2 million Employed population: 6.4 million Elderly > 64 yrs: 0.9 million

14
Department of Engineering and Public Policy Carnegie Mellon University 14 Mean value of alpha, BIAS, and alpha/BIAS for PM 2.5 and PM 10 indexed by season and subpopulation

15
Department of Engineering and Public Policy Carnegie Mellon University 15 Results and Discussion alpha : (0.44 ~ 0.77) –higher for PM 2.5 in all season and subpopulations –higher in summer, and children, employed population BIAS: –< 0.6, attenuation effect true health slope factor is higher when take exposure into consideration Net correction factor, alpha/BIAS: –mean values range from 1.12 to 1.54 for PM 2.5 and 0.88 to 1.35 for PM 10 suggest true PM health risk associated with ambient PM is likely underestimated in the Epidemiological studies.
 –higher for PM 2.5 in all season and subpopulations –higher in summer, and children, employed population BIAS: –< 0.6, attenuation effect true health slope factor is higher when take exposure into consideration Net correction factor, alpha/BIAS: –mean values range from 1.12 to 1.54 for PM 2.5 and 0.88 to 1.35 for PM 10 suggest true PM health risk associated with ambient PM is likely underestimated in the Epidemiological studies.")
16
Department of Engineering and Public Policy Carnegie Mellon University 16 Mortality risk associated with short-term exposure to ambient PM in Los Angeles County, 1997 for general total population (Population: 9.1 Million) 5 th % Median 95 th %
 5 th % Median 95 th %")
17
Department of Engineering and Public Policy Carnegie Mellon University 17 Mortality risk associated with short-term exposure to ambient PM in Los Angeles County, 1997 for general total population zero threshold assumption 5 th % Median 95 th %

18
Department of Engineering and Public Policy Carnegie Mellon University 18 Sensitivity Analysis Sensitivity Analysis - Tornado Diagrams a,b are the sensitivity analysis for the health model; c,d are for the exposure-health model.

19
Department of Engineering and Public Policy Carnegie Mellon University 19 Conclusions Results of the exposure model generally consistent with the literature Predict size, seasonal and subpopulation effects in the exposure-health model Slope and threshold are important sources of uncertainty in the sensitivity analysis Exposure-health model predicts higher health risks and does contribute to the overall uncertainty Threshold uncertainty is important in the exposure-health model due to the interaction with slope and exposure to indoor sources.

20
Department of Engineering and Public Policy Carnegie Mellon University 20 Summary Address the important issues proposed by EPA and NRC. Derive exposure-response relationship and find size, seasonal, and subpopulation effect. Slope and threshold uncertainty contributes to the most of the integrated uncertainty. The findings of this research should strengthen the scientific foundation for policy decisions.

Similar presentations


 NASA Goddard Space Flight Center.>")