Download presentation
Presentation is loading. Please wait.

1
OPSM 301 Operations Management Class 17: Inventory Management: the newsvendor Koç University Zeynep Aksin zaksin@ku.edu.tr

2
Single Period Inventory Control Examples: –Style goods –Perishable goods (flowers, foods) –Goods that become obsolete (newspapers) –Services that are perishable (airline seats)
 –Goods that become obsolete (newspapers) –Services that are perishable (airline seats)")
3
Demand Scenarios for a Jacket

4
Costs Production cost per unit (C): $80 Selling price per unit (S): $125 Salvage value per unit (V): $20 Fixed production cost (F): $100,000 Q is production quantity, D demand Profit = Revenue - Variable Cost - Fixed Cost + Salvage
: $80 Selling price per unit (S): $125 Salvage value per unit (V): $20 Fixed production cost (F): $100,000 Q is production quantity, D demand Profit = Revenue - Variable Cost - Fixed Cost + Salvage")
5
Best Solution Find order quantity that maximizes weighted average profit. Question: Will this quantity be less than, equal to, or greater than average demand?

6
What to Make? Question: Will this quantity be less than, equal to, or greater than average demand? Average demand is 13,100 Look at marginal cost Vs. marginal profit –if extra jacket sold, profit is 125-80 = 45 –if not sold, cost is 80-20 = 60 So we will make less than average

7
Scenarios Scenario One: –Suppose you make 12,000 jackets and demand ends up being 13,000 jackets. –Profit = 125(12,000) - 80(12,000) - 100,000 = $440,000 Scenario Two: –Suppose you make 12,000 jackets and demand ends up being 11,000 jackets. –Profit = 125(11,000) - 80(12,000) - 100,000 + 20(1000) = $ 335,000
 - 80(12,000) - 100,000 = $440,000 Scenario Two: –Suppose you make 12,000 jackets and demand ends up being 11,000 jackets. –Profit = 125(11,000) - 80(12,000) - 100, (1000) = $ 335,000.")
8
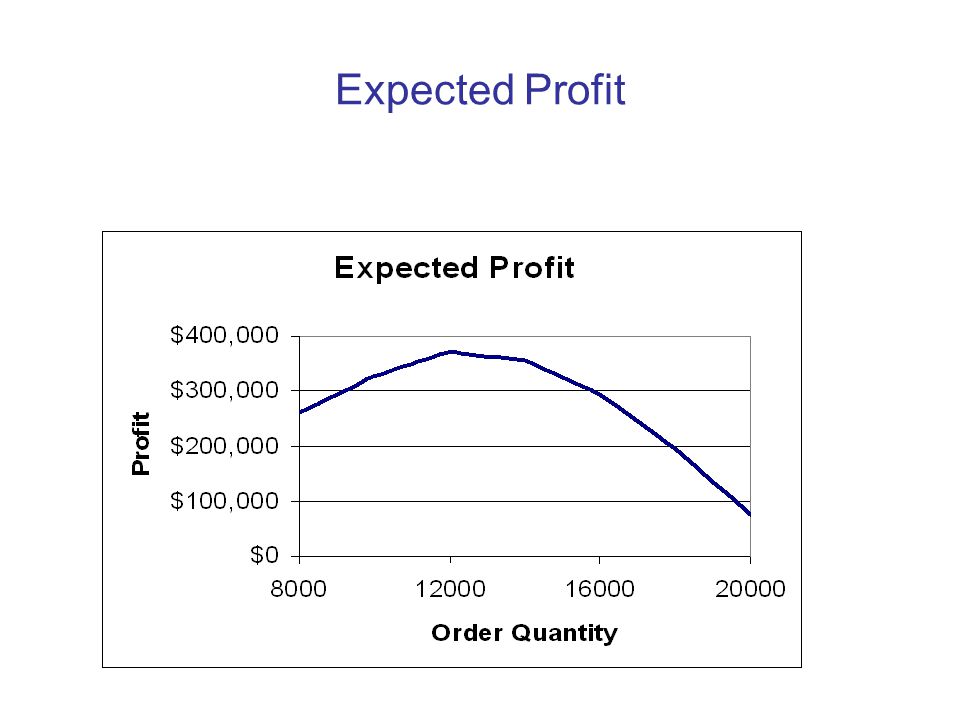
8 Scenarios and their probabilities Demand Production quantity Expected Profit

12
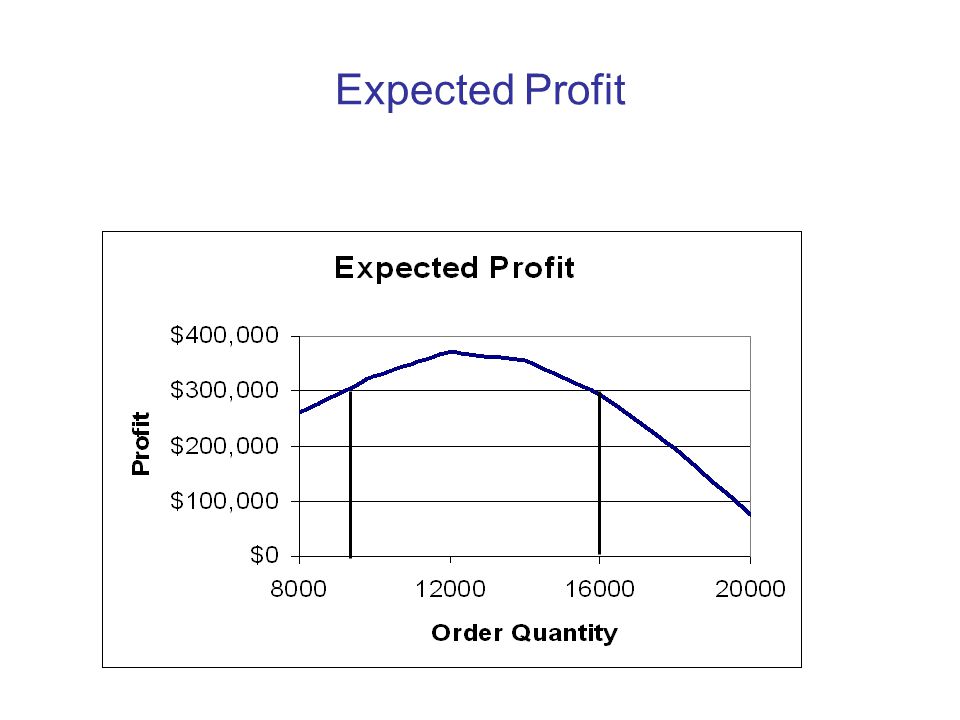
Important Observations Tradeoff between ordering enough to meet demand and ordering too much Several quantities have the same average profit Average profit does not tell the whole story Question: 9000 and 16000 units lead to about the same average profit, so which do we prefer?

13
Probability of Outcomes

14
Key Insights from this Model The optimal order quantity is not necessarily equal to average forecast demand The optimal quantity depends on the relationship between marginal profit and marginal cost Fixed cost has no impact on production quantity, only on whether to produce or not As order quantity increases, average profit first increases and then decreases As production quantity increases, risk increases. In other words, the probability of large gains and of large losses increases

15
Example Mean demand=3.85 How much would you order? Demand Probability 10.10 20.15 30.20 40.20 50.15 60.10 70.10 Total1.00

16
Single Period Inventory Control Economics of the Situation Known: 1. Demand > Stock --> Underage (under stocking) Cost C u = Cost of foregone profit, loss of goodwill 2. Demand Overage (over stocking) Cost C o = Cost of excess inventory C o = 10 and C u = 20 How much would you order? More than 3.85 or less than 3.85?
 Cost C u = Cost of foregone profit, loss of goodwill 2. Demand Overage (over stocking) Cost C o = Cost of excess inventory C o = 10 and C u = 20 How much would you order. More than 3.85 or less than")
17
Incremental Analysis ProbabilityProbability Incremental Incrementalthat incrementalthat incremental Expected Demand Decisionunit is not neededunit is neededContribution 1First0.00 1.00-10(0.00)+20(1.00) =20 2Second0.10 0.90-10(0.10)+20(0.90) =17 3Third0.25 0.7512.5 4Fourth0.45 0.556.5 5Fifth0.65 0.350.5 6Sixth0.80 0.20-4 7Seventh0.90 0.10-7 C o = 10 and C u = 20
+20(1.00) =20 2Second (0.10)+20(0.90) =17 3Third Fourth Fifth Sixth Seventh C o = 10 and C u = 20")
18
Generalization of the Incremental Analysis Chance Point Stock n-1 Decision Point Stock n Base Case nth unit needed nth unit not needed Pr{Demand n} Pr{Demand n-1} Cash Flow C u -C o 0

19
Generalization of the Incremental Analysis Chance Point Stock n-1 Decision Point Stock n Base Case Expected Cash Flow C u Pr{Demand n} -C o Pr{Demand n-1}

20
Generalization of the Incremental Analysis Order the nth unit if C u Pr{Demand n} - C o Pr{Demand n-1} >= 0 or C u (1-Pr{Demand n-1}) - C o Pr{Demand n-1} >= 0 or C u - C u Pr{Demand n-1} -C o Pr{Demand n-1} >= 0 or Pr{Demand n-1} =< C u /(C o +C u ) Then order n units, where n is the greatest number that satisfies the above inequality.
 - C o Pr{Demand n-1} >= 0 or C u - C u Pr{Demand n-1} -C o Pr{Demand n-1} >= 0 or Pr{Demand n-1} =< C u /(C o +C u ) Then order n units, where n is the greatest number that satisfies the above inequality.")
21
Incremental Analysis Incremental Demand Decision Pr{Demand n-1} Order the unit? 1First0.00 YES 2Second0.10 YES 3Third0.25 YES 4Fourth0.45 YES 5Fifth0.65 YES 6Sixth0.80 NO- 7Seventh0.90 NO C u /(C o +C u )=20/(10+20)=0.66 Order quantity n should satisfy: P(Demand n-1) C u /(C o +C u )< P(Demand n)
=20/(10+20)=0.66 Order quantity n should satisfy: P(Demand n-1) C u /(C o +C u )< P(Demand n).")
22
Order Quantity for Single Period, Normal Demand Find the z*: z value such that F(z)= C u /(C o +C u ) Optimal order quantity is: Do we order more or less than the mean if: –C u > C o ? –C u < C o ?

23
Example 1: Single Period Model Our college basketball team is playing in a tournament game this weekend. Based on our past experience we sell on average 2,400 shirts with a standard deviation of 350. We make 10TL on every shirt we sell at the game, but lose 5TL on every shirt not sold. How many shirts should we make for the game?

24
Transform X = N(mean,s.d.) to z = N(0,1) z = (X - mean) / s.d. F(z) = Prob( N(0,1) < z) Transform back, knowing z*: X* = mean + z*s.d. The Standard Normal Distribution F(z) z 0
 = Prob( N(0,1) < z) Transform back, knowing z*: X* = mean + z*s.d. The Standard Normal Distribution F(z) z 0.")
25
Example 1: Single Period Model Our college basketball team is playing in a tournament game this weekend. Based on our past experience we sell on average 2,400 shirts with a standard deviation of 350. We make 10 TL on every shirt we sell at the game, but lose 5 TL on every shirt not sold. How many shirts should we make for the game? C u = $10 and C o = $5; P ≤ $10 / ($10 + $5) =.667 Z.667 =.4 (from standard normal table or using NORMSINV() in Excel) therefore we need 2,400 +.4(350) = 2,540 shirts
 =.667 Z.667 =.4 (from standard normal table or using NORMSINV() in Excel) therefore we need 2, (350) = 2,540 shirts.")
26
Example 2: Finding C u and C o A textile company in UK orders coats from China. They buy a coat from 250€ and sell for 325€. If they cannot sell a coat in winter, they sell it at a discount price of 225€. When the demand is more than what they have in stock, they have an option of having emergency delivery of coats from Ireland, at a price of 290. The demand for winter has a normal distribution with mean 32,500 and std dev 6750. How much should they order from China??

27
Example 2: Finding C u and C o A textile company in UK orders coats from China. They buy a coat from 250€ and sell for 325€. If they cannot sell a coat in winter, they sell it at a discount price of 225€. When the demand is more than what they have in stock, they have an option of having emergency delivery of coats from Ireland, at a price of 290. The demand for winter has a normal distribution with mean 32,500 and std dev 6750. How much should they order from China?? Cu=75-35=40 Co=25 F(z)=40/(40+25)=40/65=0.61 z=0.28 q=32500+0.28*6750=34390
=40/(40+25)=40/65=0.61 z=0.28 q= *6750=")
28
Example 3: Single Period Inventory Management Problem Manufacturing cost=60TL, Selling price=80TL, Discounted price (at the end of the season)=50TL Market research gave the following probability distribution for demand. Find the optimal q, expected number of units sold for this orders size, and expected profit, for this order size. Demand Probability 5000.10 6000.2 7000.2 8000.2 9000.10 10000.10 11000.10 P(D<=n-1) 0 0.1 0.3 0.5 0.7 0.8 0.9 Cu=20 Co=10 P(D<=n-1)<=20/30=0.66 <=0.66 q=800 For q=800: E(units sold)=710 E(profit)=13,300
 Cu=20 Co=10 P(D<=n-1)<=20/30=0.66 <=0.66 q=800 For q=800: E(units sold)=710 E(profit)=13,300.")
Similar presentations


 Managing Flow Variability:>")


>")


