Download presentation
Presentation is loading. Please wait.

1
Betting on Uncertain Demand: Newsvendor Model
Optional reading: Cachon’s book (reference textbook) – Ch. 11.
 – Ch. 11.")
2
The Newsboy Model: an Example
Mr. Tan, a retiree, sells the local newspaper at a Bus terminal. At 6:00 am, he meets the news truck and buys # of the paper at $4.0 and then sells at $8.0. At noon he throws the unsold and goes home for a nap. If average daily demand is 50 and he buys just 50 copies daily, then is the average daily profit =50*4 =$200? NO!

3
Betting on Uncertain Demand
You must take a firm bet (how much stock to order) before some random event occurs (demand) and then you learn that you either bet too much or too little More examples: Products for the Christmas season; Nokia’s new set, winter coats, New-Year Flowers, …
 before some random event occurs (demand) and then you learn that you either bet too much or too little. More examples: Products for the Christmas season; Nokia’s new set, winter coats, New-Year Flowers, …")
4
Bossini -- Winter Clothes
Season: Dec. – Jan./Feb. Purchase of key materials (fabrics, dyeing/printing, …) takes long times (upto 90 days) Into the selling season, it is too late!
 takes long times (upto 90 days) Into the selling season, it is too late!")
8
Seattle Hong Kong Denver Case: Sport Obermeyer

9
The SO Supply Chain Shell Fabric Subcontractors Lining Fabric
Insulation mat. Cut/Sew Distr Ctr Retailers Snaps Zippers Others Textile Suppliers Obersport Obermeyer Retailers

10
Order Cycle and Supply Chain(cont’d) Design Phase
 Design Phase")
11
Order Cycle and Supply Chain(cont’d) Production Phase
 Production Phase")
12
Order Cycle and Supply Chain(cont’d) Selling Phase
 Selling Phase")
13
O’Neill’s Hammer 3/2 wetsuit
11-13
14
Hammer 3/2 timeline and economics
Each suit sells for p = $180 TEC charges c = $110 per suit Discounted suits sell for v = $90 The “too much/too little problem”: Order too much and inventory is left over at the end of the season Order too little and sales are lost. Marketing’s forecast for sales is 3200 units. 11-14

15
Newsvendor model implementation steps
Gather economic inputs: Selling price, production/procurement cost, salvage value of inventory Generate a demand model: Use empirical demand distribution or choose a standard distribution function to represent demand, e.g. the normal distribution, the Poisson distribution. Choose an objective: e.g. maximize expected profit or satisfy a fill rate constraint. Choose a quantity to order. 11-15

16
The Newsvendor Model: Develop a Forecast
Just one approach 11-16

17
Historical forecast performance at O’Neill
Forecasts and actual demand for surf wet-suits from the previous season 11-17

18
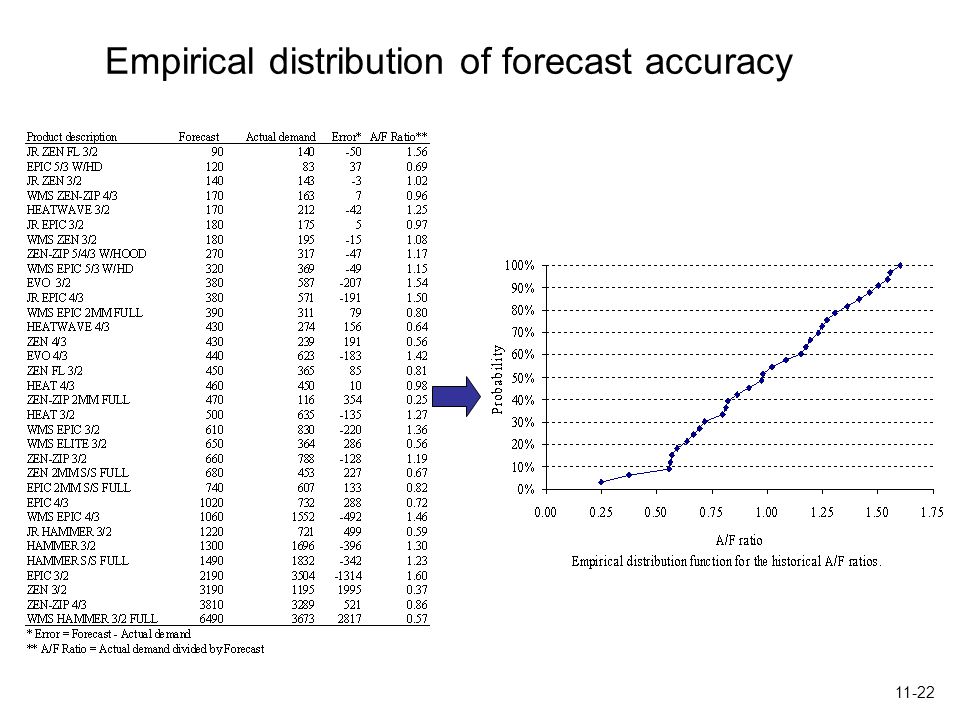
Empirical distribution of forecast accuracy
How do we know “actual d’d” if it exceeded forecast? 11-18

19
Normal distribution tutorial
All normal distributions are characterized by two parameters, mean = m and standard deviation = s All normal distributions are related to the standard normal that has mean = 0 and standard deviation = 1. For example: Let Q be the order quantity, and (m, s) the parameters of the normal demand forecast. Prob{demand is Q or lower} = Prob{the outcome of a standard normal is z or lower}, where (The above are two ways to write the same equation, the first allows you to calculate z from Q and the second lets you calculate Q from z.) Look up Prob{the outcome of a standard normal is z or lower} in the Standard Normal Distribution Function Table. 11-19
 the parameters of the normal demand forecast. Prob{demand is Q or lower} = Prob{the outcome of a standard normal is z or lower}, where. (The above are two ways to write the same equation, the first allows you to calculate z from Q and the second lets you calculate Q from z.) Look up Prob{the outcome of a standard normal is z or lower} in the Standard Normal Distribution Function Table")
20
Converting between Normal distributions
Start with = 100, = 25, Q = 125 Center the distribution over 0 by subtracting the mean Rescale the x and y axes by dividing by the standard deviation 11-20

21
Using historical A/F ratios to choose a Normal distribution for the demand forecast
Start with an initial forecast generated from hunches, guesses, etc. O’Neill’s initial forecast for the Hammer 3/2 = 3200 units. Evaluate the A/F ratios of the historical data: Set the mean of the normal distribution to Set the standard deviation of the normal distribution to Why not just order/buy 3200 units? It is the most likely outcome! Forecasts always are biased, so order less than 3200 Gross margin is 40%, should order more, if is a hit 11-21

22
Empirical distribution of forecast accuracy
11-22
23
Table 11.2

24
If the coming year is a similar to the last year, i. e
If the coming year is a similar to the last year, i.e., the forecasting errors are similar, then, There is a 3% chance that demand will be 800 units or fewer (0.25*3200) There is a 90.9% chance demand is 150% of the forecast or lower (or 1.5*3200 = 4,800)
 There is a 90.9% chance demand is 150% of the forecast or lower (or 1.5*3200 = 4,800)")
25
O’Neill’s Hammer 3/2 normal distribution forecast
O’Neill should choose a normal distribution with mean 3192 and standard deviation 1181 to represent demand for the Hammer 3/2 during the Spring season. 11-25

26
Empirical vs normal demand distribution
Empirical distribution function (diamonds) and normal distribution function with mean 3192 and standard deviation 1181 (solid line) 11-26
 and normal distribution function with. mean 3192 and standard deviation 1181 (solid line)")
27
The Newsvendor Model: The order quantity that maximizes expected profit
11-27
28
“Too much” and “too little” costs
Co = overage cost The cost of ordering one more unit than what you would have ordered had you known demand. In other words, suppose you had left over inventory (i.e., you over ordered). Co is the increase in profit you would have enjoyed had you ordered one fewer unit. For the Hammer 3/2 Co = Cost – Salvage value = c – v = 110 – 90 = 20 Cu = underage cost The cost of ordering one fewer unit than what you would have ordered had you known demand. In other words, suppose you had lost sales (i.e., you under ordered). Cu is the increase in profit you would have enjoyed had you ordered one more unit. For the Hammer 3/2 Cu = Price – Cost = p – c = 180 – 110 = 70 11-28
. Co is the increase in profit you would have enjoyed had you ordered one fewer unit. For the Hammer 3/2 Co = Cost – Salvage value = c – v = 110 – 90 = 20. Cu = underage cost. The cost of ordering one fewer unit than what you would have ordered had you known demand. In other words, suppose you had lost sales (i.e., you under ordered). Cu is the increase in profit you would have enjoyed had you ordered one more unit. For the Hammer 3/2 Cu = Price – Cost = p – c = 180 – 110 =")
29
Balancing the risk and benefit of ordering a unit
Ordering one more unit increases the chance of overage … Expected loss on the Qth (+1) unit = Co x F(Q) F(Q) = Distribution function of demand = Prob{Demand <= Q) … but the benefit/gain of ordering one more unit is the reduction in the chance of underage: Expected gain on the Qth (+1) unit = Cu x (1-F(Q)) As more units are ordered, the expected benefit from ordering one unit decreases while the expected loss of ordering one more unit increases. As we deal with large numbers, we omit +1 11-29
 unit = Co x F(Q) F(Q) = Distribution function of demand = Prob{Demand <= Q) … but the benefit/gain of ordering one more unit is the reduction in the chance of underage: Expected gain on the Qth (+1) unit = Cu x (1-F(Q)) As more units are ordered, the expected benefit from ordering one unit decreases while the expected loss of ordering one more unit increases. As we deal with large numbers, we omit")
30
Newsvendor expected profit maximizing order quantity
To maximize expected profit order Q units so that the expected loss on the Qth unit equals the expected gain on the Qth unit: Rearrange terms in the above equation -> The ratio Cu / (Co + Cu) is called the critical ratio. Hence, to maximize profit, choose Q such that we don’t have lost sales (i.e., demand is Q or lower) with a probability that equals the critical ratio 11-30
 is called the critical ratio. Hence, to maximize profit, choose Q such that we don’t have lost sales (i.e., demand is Q or lower) with a probability that equals the critical ratio")
31
Finding the Hammer 3/2’s expected profit maximizing order quantity with the empirical distribution function Inputs: Empirical distribution function table; p = 180; c = 110; v = 90; Cu = = 70; Co = =20 Evaluate the critical ratio: Lookup in the empirical distribution function table If the critical ratio falls between two values in the table, choose the one that leads to the greater order quantity (choose which corresponds to A/F ratio 1.3) Convert A/F ratio into the order quantity A round-up rule! See p235. 11-31
 Convert A/F ratio into the order quantity. A round-up rule! See p")
32
Hammer 3/2’s expected profit maximizing order quantity using the normal distribution
Inputs: p = 180; c = 110; v = 90; Cu = = 70; Co = =20; critical ratio = ; mean = m = 3192; standard deviation = s = 1181 Look up critical ratio in the Standard Normal Distribution Function Table: If the critical ratio falls between two values in the table, choose the greater z-statistic Choose z = 0.77 Convert the z-statistic into an order quantity: 11-32

Similar presentations


 Managing Flow Variability:>")


