Download presentation
Presentation is loading. Please wait.

1
An Architecture for Evolving IT Customer Service Garland C. Elmore Deputy CIO and Dean Associate Vice President elmore@iu.edu Sue B. Workman Director of User Support sbworkma@iu.edu U NIVERSITY I NFORMATION T ECHNOLOGY S ERVICES I NDIANA U NIVERSITY U NIVERSITY I NFORMATION T ECHNOLOGY S ERVICES Copyright Garland C. Elmore and Sue B. Workman, 2006. This work is the intellectual property of the authors. Permission is granted for this material to be shared for non-commercial, educational purposes, provided that this copyright statement appears on the reproduced materials and notice is given that the copying is by permission of the authors. To disseminate otherwise or to republish requires written permission from the authors.

2
An Architecture for Evolving IT Customer Service Organization Context Indiana University and the IT organization Customer and technology trends Rationale for the support initiative Cost, quality and the priority-setting process The problem Developing the Online Support Environment Systems and information management Defining the OSE Gap analysis and new tools Lessons learned and next steps

3
An Architecture for Evolving IT Customer Service Organization Context Indiana University and the IT organization Customer and technology trends Rationale for the support initiative Cost, quality and the priority-setting process The problem Developing the Online Support Environment Systems and information management Defining the OSE Gap analysis and new tools Lessons learned and next steps

4
IUPUI Indianapolis IUB Bloomington IU Southeast New Albany Kokomo IU East Richmond Fort Wayne South Bend Gary Columbus Elkhart Context: Indiana University Characteristics Founded in 1820 Eight campuses Approximately 100,000 students Students from 50 states and over 100 countries About 15,000 faculty and staff Operates with $2.1 billion budget IU Kokomo IU Southeast IUPUI IP Fort Wayne IU East IU Northwest IU South Bend IU Bloomington

5
Context: Indiana University Characteristics Bloomington (IUB) Campus Enrollment: 37,958 Degree programs: 329 Degrees conferred last year: 8,590
 Campus Enrollment: 37,958 Degree programs: 329 Degrees conferred last year: 8,590")
6
Context: Indiana University Characteristics Indianapolis (IUPUI) Campus Enrollment: 29,933 Degree programs: 231 Degrees conferred last year: 5,521
 Campus Enrollment: 29,933 Degree programs: 231 Degrees conferred last year: 5,521")
7
Context: IT Organization Central Technology AVP Garland C. Elmore AVP Mark S. Bruhn AVP Dennis J. Cromwell AVP Craig A. Stewart TEACHING & LEARNING IT TELECOM- MUNICATIONS UNIVERSITY INFORMATION SYSTEMS RESEARCH & ACADEMIC COMPUTING Vice President for Information Technology Michael A. McRobbie Director J. Michael Lucas Director Elizabeth Van Gordon Director Robert Lowden Director David Jent Director Sue Workman Director Barry Walsh Acting Director Scott McCaulay Director Sara Chambers UITS IUPUI (Elmore) UITS IUB (Wheeler) University Information Technology Services (UITS) Acting Director Matt Link Director James Williams Note: Also reporting in full or part to the OVPIT are the Pervasive Technology Labs, Regional Campus CIOs (dual report), School of Medicine CIO (dual report), and IT offices, including Policy and Security, Finance, Human Resources, etc. Acting Chief Information Officer and Dean for IT, IUB Bradley C. Wheeler Acting Deputy CIO and Dean for IT, IUPUI Garland C. Elmore
 UITS IUB (Wheeler) University Information Technology Services (UITS) Acting Director Matt Link Director James Williams Note: Also reporting in full or part to the OVPIT are the Pervasive Technology Labs, Regional Campus CIOs (dual report), School of Medicine CIO (dual report), and IT offices, including Policy and Security, Finance, Human Resources, etc. Acting Chief Information Officer and Dean for IT, IUB Bradley C. Wheeler Acting Deputy CIO and Dean for IT, IUPUI Garland C. Elmore.")
8
Context: Customer and Technology Trends Support Challenge 115,000 student, faculty and staff users 200,000 computing and communication devices University workstations: 30,000 Personally owned computers (96 percent): 110,400 University telephones: 33,516 University cell phones: 1,251 University pagers: 1,183 PDA and other devices (estimated): 28,000 Continued technology growth and a flat support budget
: 110,400 University telephones: 33,516 University cell phones: 1,251 University pagers: 1,183 PDA and other devices (estimated): 28,000 Continued technology growth and a flat support budget")
9
100.0 % 90.0 % 80.0 % 70.0 % 60.0 % 50.0 % 40.0 % 30.0 % 20.0 % 10.0 % 0.0 % 199219931994199519961997199819992000200120022003200420052006 Recent Information Technology Trends at Indiana University

10
Ownership 100.0 % 90.0 % 80.0 % 70.0 % 60.0 % 50.0 % 40.0 % 30.0 % 20.0 % 10.0 % 0.0 % 199219931994199519961997199819992000200120022003200420052006 Recent Information Technology Trends at Indiana University Ownership Personal ownership increased 53% in 14 years, to 96% of users reporting computers in their residence by 2006

11
Ownership 100.0 % 90.0 % 80.0 % 70.0 % 60.0 % 50.0 % 40.0 % 30.0 % 20.0 % 10.0 % 0.0 % 199219931994199519961997199819992000200120022003200420052006 Recent Information Technology Trends at Indiana University Technology Classrooms Ownership Personal ownership increased 53% in 14 years, to 96% of users reporting computers in their residence by 2006 Classrooms All of IU’s 640 Registrar-scheduled classrooms will be enhanced with technology by 2007

12
Ownership CMS 100.0 % 90.0 % 80.0 % 70.0 % 60.0 % 50.0 % 40.0 % 30.0 % 20.0 % 10.0 % 0.0 % 199219931994199519961997199819992000200120022003200420052006 Recent Information Technology Trends at Indiana University Technology Classrooms Ownership Personal ownership increased 53% in 14 years, to 96% of users reporting computers in their residence by 2006 CMS Course management system adoption increased with 88% of students and 80% of faculty using Oncourse by 2005 Classrooms All of IU’s 640 Registrar-scheduled classrooms will be enhanced with technology by 2007

13
Networks Ownership CMS 100.0 % 90.0 % 80.0 % 70.0 % 60.0 % 50.0 % 40.0 % 30.0 % 20.0 % 10.0 % 0.0 % 199219931994199519961997199819992000200120022003200420052006 Recent Information Technology Trends at Indiana University Technology Classrooms Ownership Personal ownership increased 53% in 14 years, to 96% of users reporting computers in their residence by 2006 CMS Course management system adoption increased with 88% of students and 80% of faculty using Oncourse by 2005 Networks Classrooms and residence halls’ network connections increased to 100% by 2003 Classrooms All of IU’s 640 Registrar-scheduled classrooms will be enhanced with technology by 2007

14
Networks Ownership CMS Wireless 100.0 % 90.0 % 80.0 % 70.0 % 60.0 % 50.0 % 40.0 % 30.0 % 20.0 % 10.0 % 0.0 % 199219931994199519961997199819992000200120022003200420052006 Recent Information Technology Trends at Indiana University Technology Classrooms Ownership Personal ownership increased 53% in 14 years, to 96% of users reporting computers in their residence by 2006 Wireless Wireless coverage of academic and informal learning areas increased from 1% to 95% in 3 years CMS Course management system adoption increased with 88% of students and 80% of faculty using Oncourse by 2005 Networks Classrooms and residence halls’ network connections increased to 100% by 2003 Classrooms All of IU’s 640 Registrar-scheduled classrooms will be enhanced with technology by 2007

15
Networks Ownership CMS Wireless 100.0 % 90.0 % 80.0 % 70.0 % 60.0 % 50.0 % 40.0 % 30.0 % 20.0 % 10.0 % 0.0 % 199219931994199519961997199819992000200120022003200420052006 Recent Information Technology Trends at Indiana University Technology Classrooms Students and faculty reported an increase from 18 to 29 hours/week in using technology over ~3 years Ownership Personal ownership increased 53% in 14 years, to 96% of users reporting computers in their residence by 2006 Wireless Wireless coverage of academic and informal learning areas increased from 1% to 95% in 3 years CMS Course management system adoption increased with 88% of students and 80% of faculty using Oncourse by 2005 Networks Classrooms and residence halls’ network connections increased to 100% by 2003 Usage Reported computer usage increased by 10.6 hours per week in 3 years Classrooms All of IU’s 640 Registrar-scheduled classrooms will be enhanced with technology by 2007

16
Call Center – 2,302,478 contacts Operator assistance Paging, answering services, emergencies Support Center – 225,212 contacts Walk-in, phone, and e-mail help Second-tier and third-tier follow up Residential IT – 3,104 in-room service calls STC Consulting – 166,415 contacts IT Training – 22,730 students Context: Customer and Technology Trends Support Challenge

17
2.5M one-to-one contacts, initiated every 12 seconds, 24x7x365 UITS Support and Call Centers

18
Activity-Based Costing Rationale: Cost, Quality and the Priority Process At What Cost?

19
Service Annual Cost Units Activity MeasuredUnit Cost Walk-in Consulting$493,342 34,776Contacts$14.19 4,888Operating Hours$100.93 Telephone Consulting$773,312 118,800Contacts$6.51 8,760Operating Hours$88.28 E-mail Consulting$220,925 34,748Contacts$6.36 8,760Operating Hours$25.22 Chat Online Services$165,830 2,406Contacts$68.92 2,420Operating Hours$68.52 Knowledge Base$997,562 8,829,685Web Access$0.11 8,760Operating Hours$113.88 Online Support Services$550,666 13,200,000Web Access$0.04 8,760Operating Hours$62.86 Current Support Costs

20
Relationship to Customer Satisfaction Rationale: Cost, Quality and the Priority Process At What Cost?

21
Relationship to Customer Satisfaction Rationale: Cost, Quality and the Priority Process At What Cost?

22
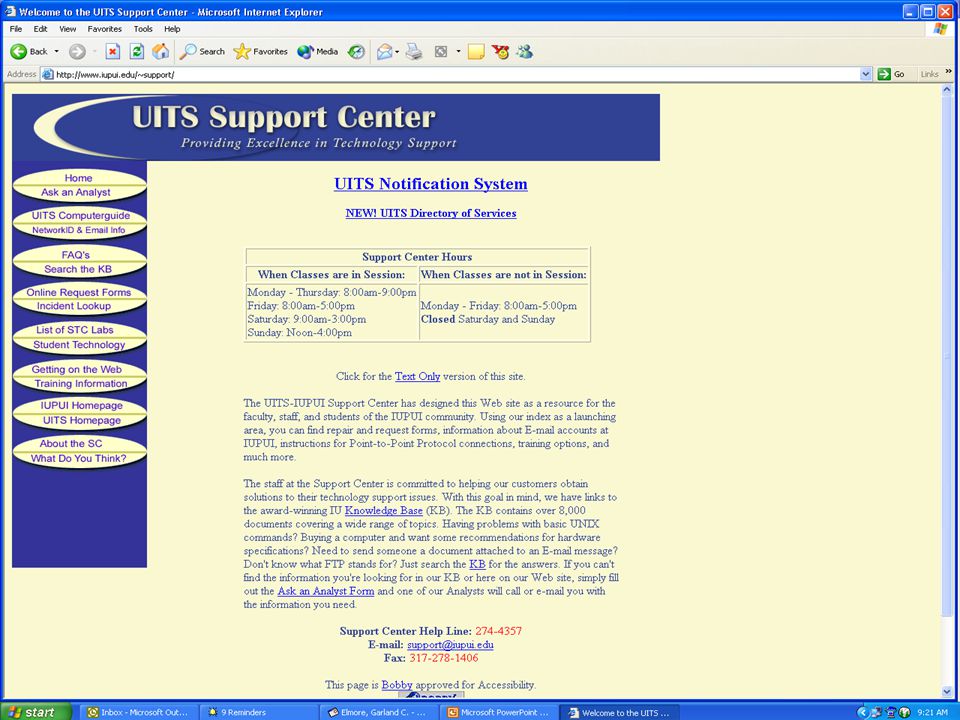
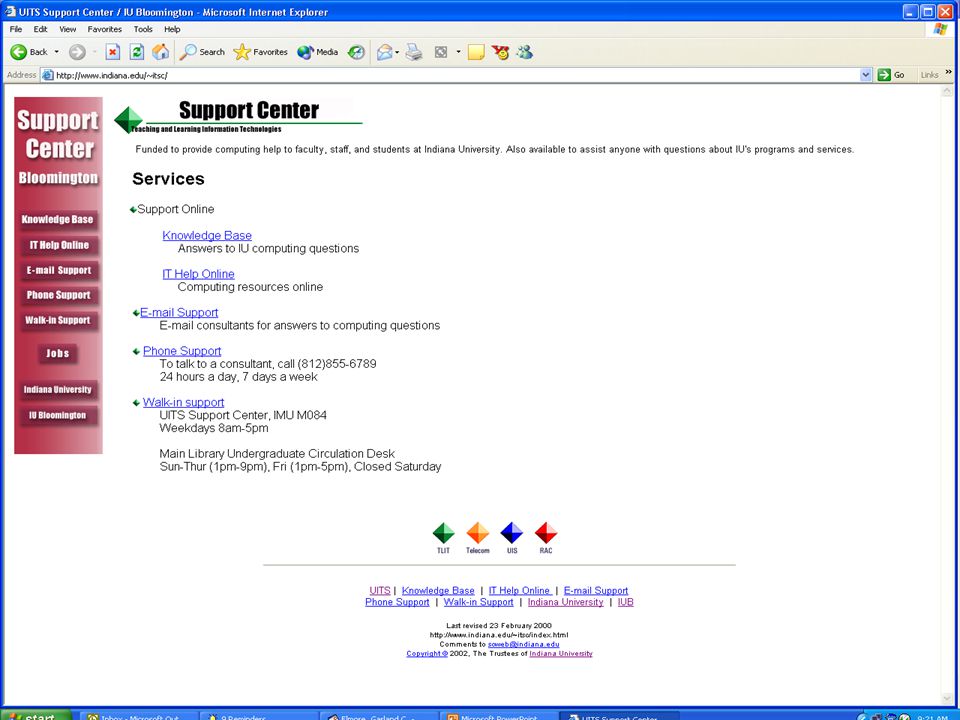
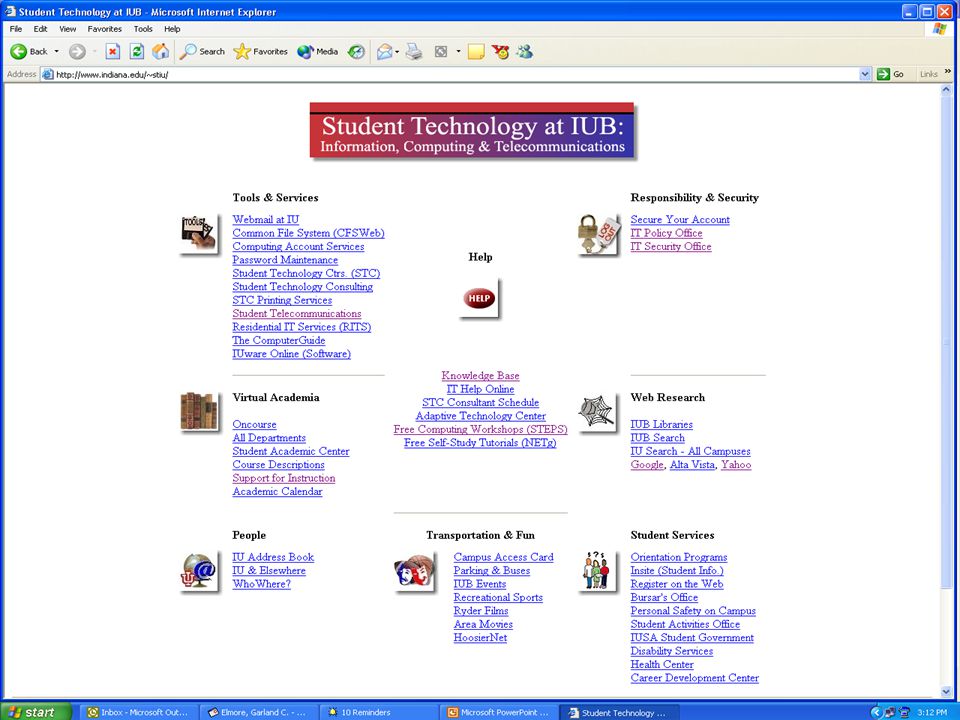
Success of IU Information Technology Strategic Plan (ITSP) initiatives increased demand for support across all technologies. Reduced or flat budgets near the end of ITSP implementations made it difficult to improve access, efficiency, and quality of support. This was further complicated by well-established University Information Technology Services Web space originally developed in 1997 to introduce the organization, not provide services and support. Moment of Truth The Problem

66
The old user interface helped illustrate the need Very creative pages Not very coherent Not very service-oriented Not customer-centered Cost and quality arguments were compelling UITS had developed an environment in which critical review was complemented by trust The Problem: Communicating and... Reaching Consensus

67
An Architecture for Evolving IT Customer Service Organization Context Indiana University and the IT organization Customer and technology trends Rationale for the support initiative Cost, quality and the priority-setting process The problem Developing the Online Support Environment Systems and information management Defining the OSE Gap analysis and new tools Lessons learned and next steps

68
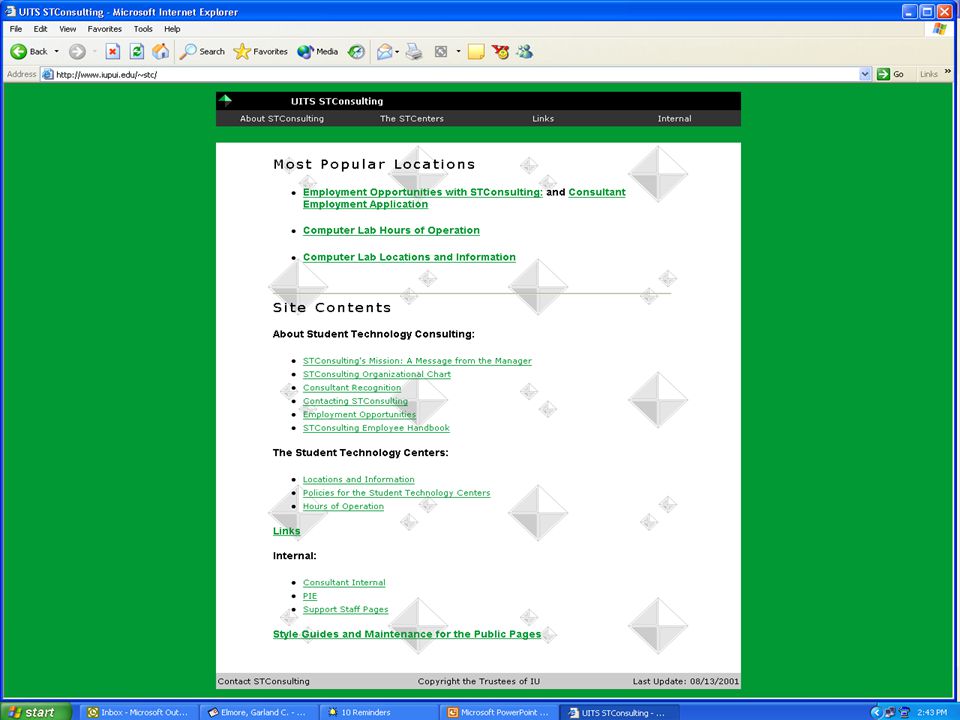
http://uits.iu.edu/ Support and Services Model The New UITS Web site

69
The Online Support Environment utilizes automation, systems, and technology to: Provide one-stop guided online support and services to users Provide information to consultants and support staff Provide user communication about IT systems and services Provide management information for service planning and service adjustments. Defining the OSE What is it?

70
First phase Reorganized December 2002 to launch August 2003 Central Attendant Services and Telephone Consulting Established User Support organization Consolidated Learning Technology Operations Defining the OSE: Stages in Development Online Support Environment

71
First phase Reorganized December 2002 to launch August 2003 Defined and integrated OSE systems Knowledge Base, KB Workshop Incident managementIT Notifications ACD, Call Management System Departmental data, TLIT Dashboard Develop new systems or applications to fill in the gaps Defining the OSE: Stages in Development Online Support Environment

72
First phase Reorganized December 2002 to launch August 2003 Defined and integrated OSE systems Completed UITS Services and Support Web site Defining the OSE: Stages in Development Online Support Environment

73
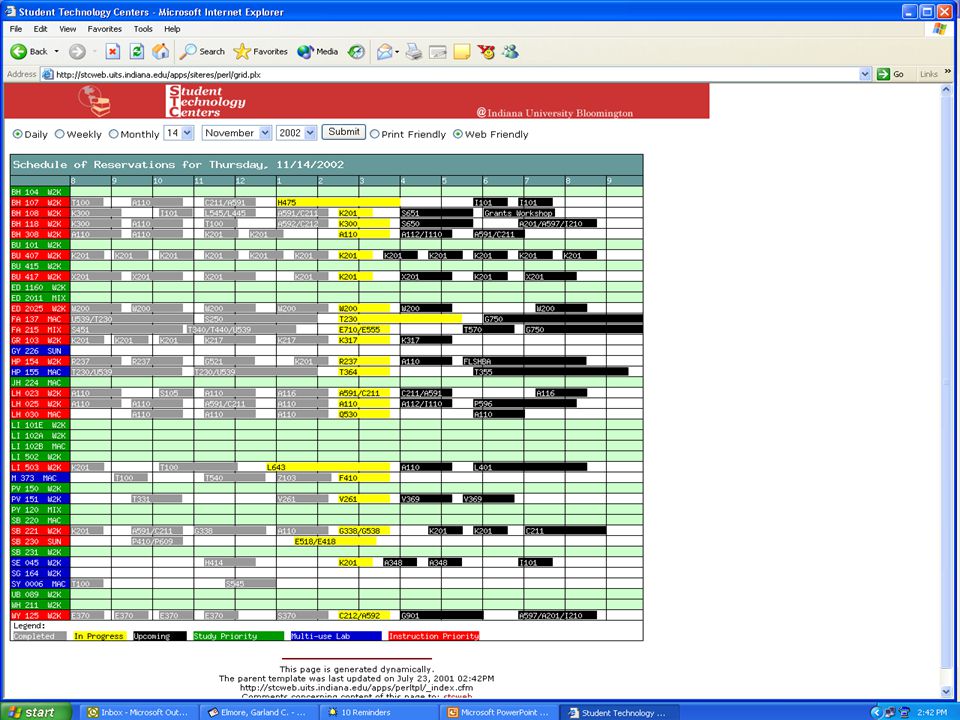
Create computing accounts Change passwords Search the Knowledge Base Get help Learn how to buy computers Read IT news Check for system updates Reserve a computer lab Request software View IT Notices and Alerts Request phone service Make a VPN connection Download free software Access programmers’ tools Find tutorials Join mailing lists Connect to live IT chat Browse the address book Take a self-study course Browse job listings Defining the OSE: UITS Web site User Self Help

74
First phase Reorganized December 2002 to launch August 2003 Defined and integrated OSE systems Completed UITS Services and Support Web site Offered 24x7 support to regional campuses Defining the OSE: Stages in Development Online Support Environment

75
First phase Reorganized December 2002 to launch August 2003 Defined and integrated OSE systems Completed UITS Services and Support Web site Offered 24x7 support to regional campuses Implemented system diagnostics, remote control, and live chat Defining the OSE: Stages in Development Online Support Environment

76
First phase Reorganized December 2002 to launch August 2003 Defined and integrated OSE systems Completed UITS Services and Support Web site Offered 24x7 support to regional campuses Implemented system diagnostics, remote control, and live chat Expanded second-tier support Defining the OSE: Stages in Development Online Support Environment

77
Defining the OSE: Back to the Web Site The Architecture

78
ACDs/CCMIS Contact Tracking IT Notifications User Surveys Activity Based Costing Knowledge Base Workflow Gap Analysis and New Tools Existing Systems

79
Data Information Service Planning Productivity Gap Analysis and New Tools Each System Lends Value

80
Individual systems Had to know where to find them Had to know the organization owners Gap Analysis and New Tools We Had

81
Integrate these within one “system” User did not have to know individual URLs Combine for powerful information Make information available that was not available before Leverage information and work Built a guided automated self-serve system Gap Analysis and New Tools The Web Site

82
Gap Analysis and New Tools Individually We Had

83
Gap Analysis and New Tools Together We Have

84
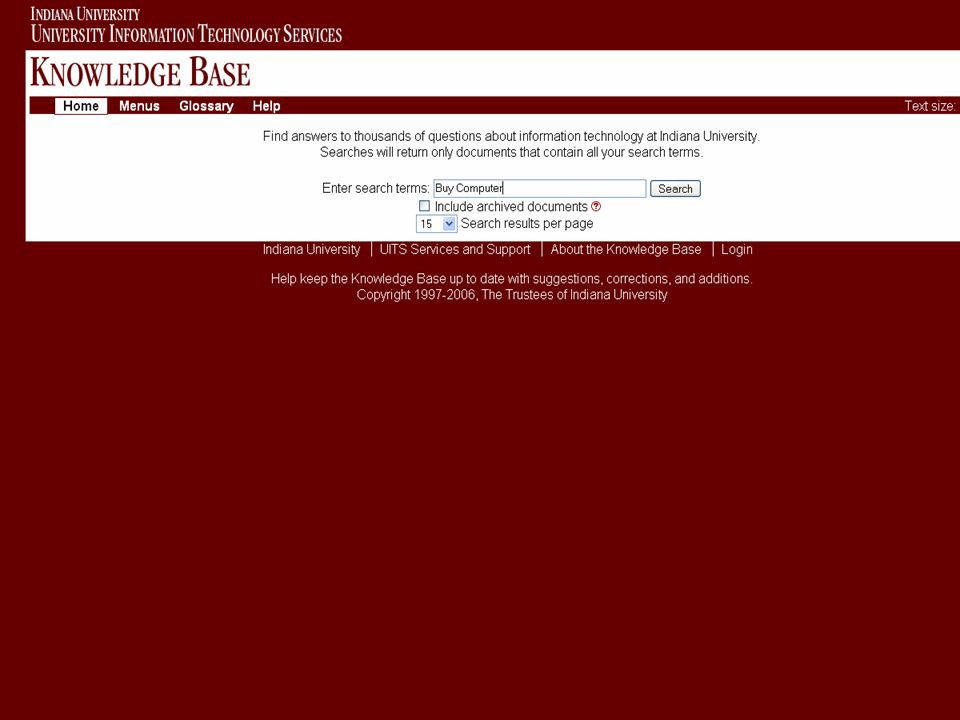
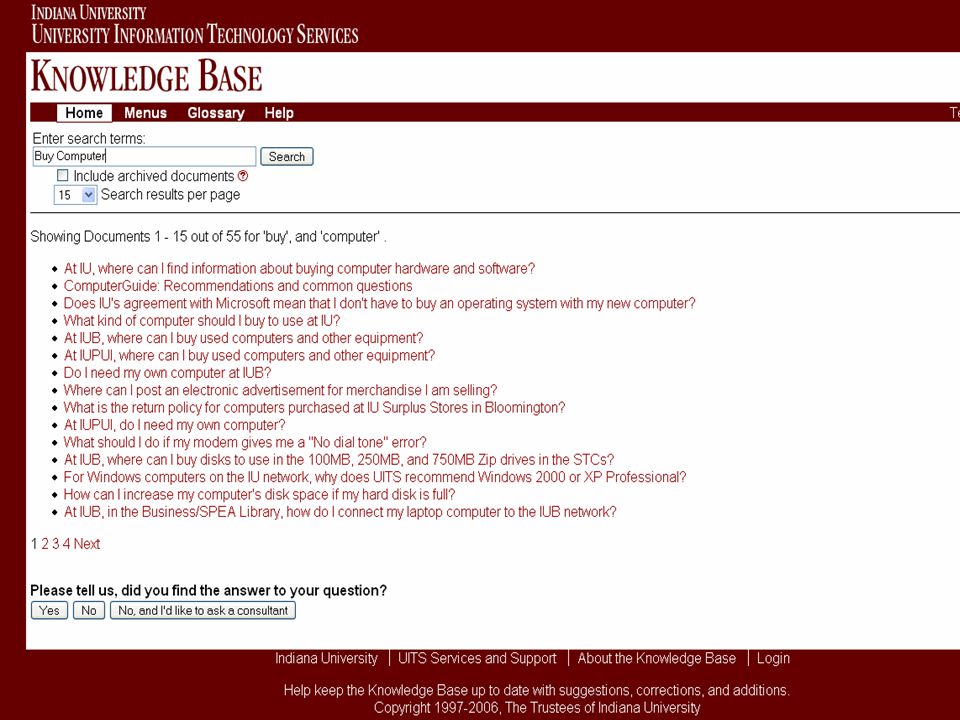
Gap Analysis and New Tools: An Example Top Ten Hits in May 2006 4,568 Buying Hardware 4,503 Software and Hardware 3,050 Email 2,723 Accounts and Passwords 1,715 Internet, Phone, and Video Connections 1,709 Labs, Classrooms, and Instructional Resources 1,007 Training and Workshops 972 Contact UITS 963 Help Options 935 About UITS

85
Manage the data once Publish many places Gap Analysis and New Tools: An Example The IU Knowledge Base

86
KB was born in 1988 Internal tool to retain computing support information Became a self-serve tool in 1995 For more info see: “What is the history of the Knowledge Base” at http://kb.indiana.edu/data/acjq.html Systems and Information Management: Where it all Began IU Knowledge Base

89
Best Technical Support Page Yahoo! Internet Life, Sept 1997 Best of Show and Distinguished Technical Communication, Society for Technical Communication, March 1999 Best Technical Support Online, PC World Magazine, May 1999 Best Practices in Higher Education (Honorable Mention), EDUCAUSE, Oct 1999 Institutional Excellence in Telecommunications, ACUTA, July 2000 SciTech Web Award, Scientific American, May 2001 Others listed: http://kb.indiana.edu/data/aiwp.htmlhttp://kb.indiana.edu/data/aiwp.html Systems and Information Management: Knowledge Base Awards and Recognitions
, EDUCAUSE, Oct 1999 Institutional Excellence in Telecommunications, ACUTA, July 2000 SciTech Web Award, Scientific American, May 2001 Others listed: Systems and Information Management: Knowledge Base Awards and Recognitions.")
90
Gap Analysis and New Tools: From the... Knowledge Base to the OSE

91
IU Knowledge Base 8.8M hits per year 12,000 entries kb.iu.edu New Online Support Environment 13.2M hits per year 3,470 pages uits.iu.edu Gap Analysis and New Tools Online Support Contacts

92
Gap Analysis and New Tools Moral to the story OSE is much more than a web site Integrated systems, services, and people working together to provide excellent IT Support.

93
Gap Analysis and New Tools Other Tool Developments New Notifications System New IT Now Client New KB features and interface New Get Connected! New Pinnacle System New User Support Dashboard

94
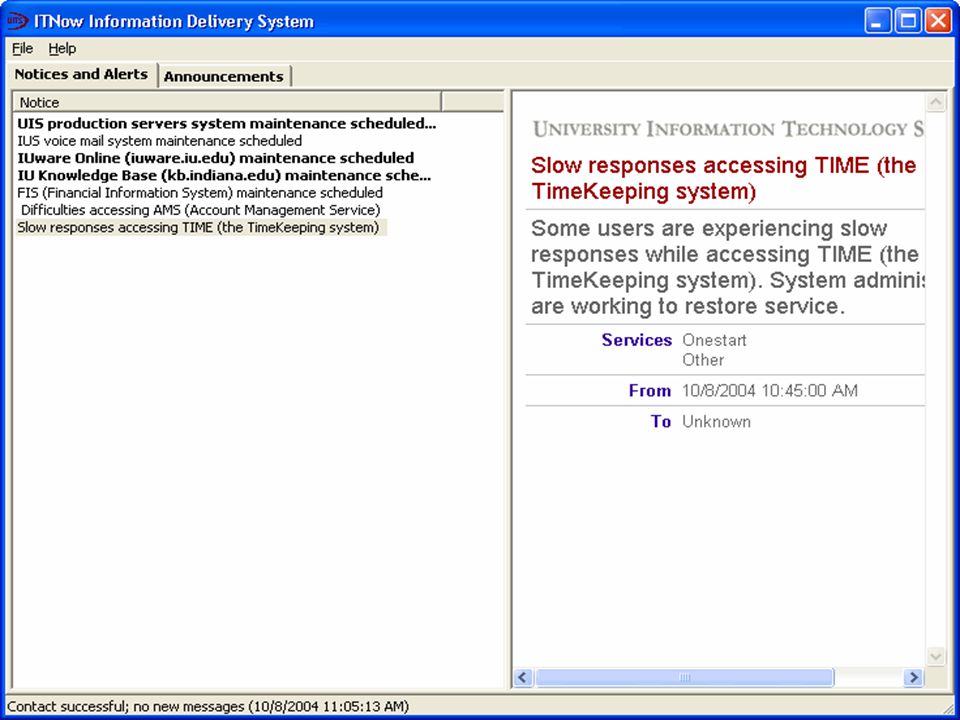
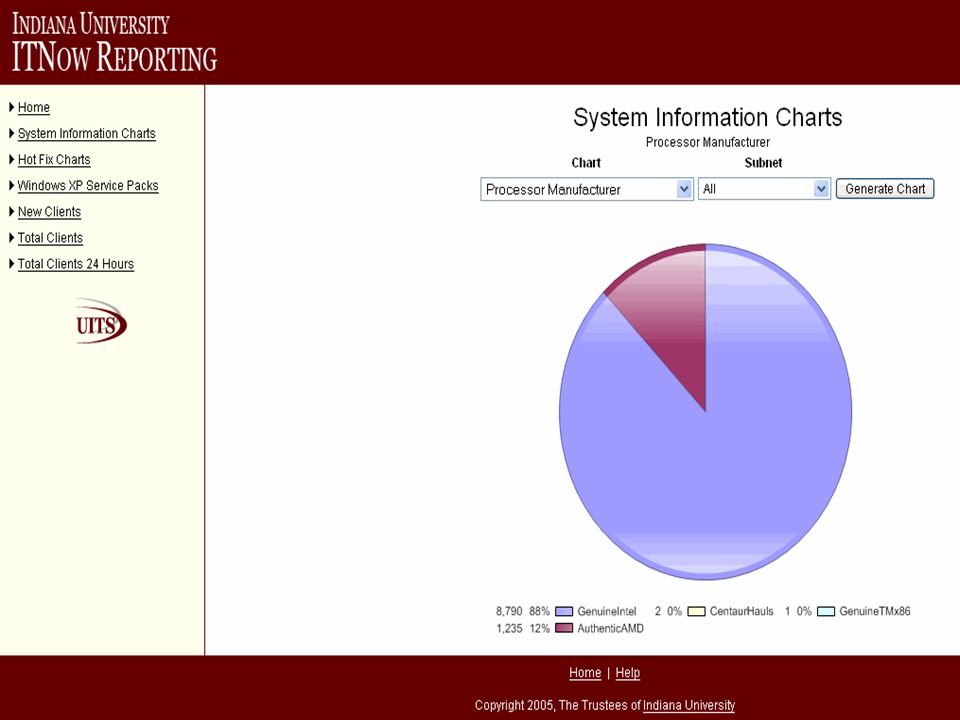
Gap Analysis and New Tools: Newest Tool ITNow

95
From: List Description: Support Center [mailto:SC_COMMUNICATE@LISTSERV.INDIANA.EDU] On Behalf Of IT NOTICE Sent: Saturday, September 11, 2004 11:48 AM To: SC_COMMUNICATE@LISTSERV.INDIANA.EDU Subject: Notice - bell.ucs.indiana.edu emergency maintenance scheduled bell.ucs.indiana.edu emergency maintenance scheduled - Saturday 9/11 11:36 The IU Knowledge Base server bell.ucs.indiana.edu is currently unavailable due to emergency maintenance. The ability to edit Knowledge Base articles using the Workshop is affected. System administrators are working to restore service. Kevin Johnson UITS Support Center 11:48, Saturday, Sep 11 For outages and other information see: http://ithelp.indiana.edu/notice.cgi/ Gap Analysis and New Tools: Newest Tool User Communication

96
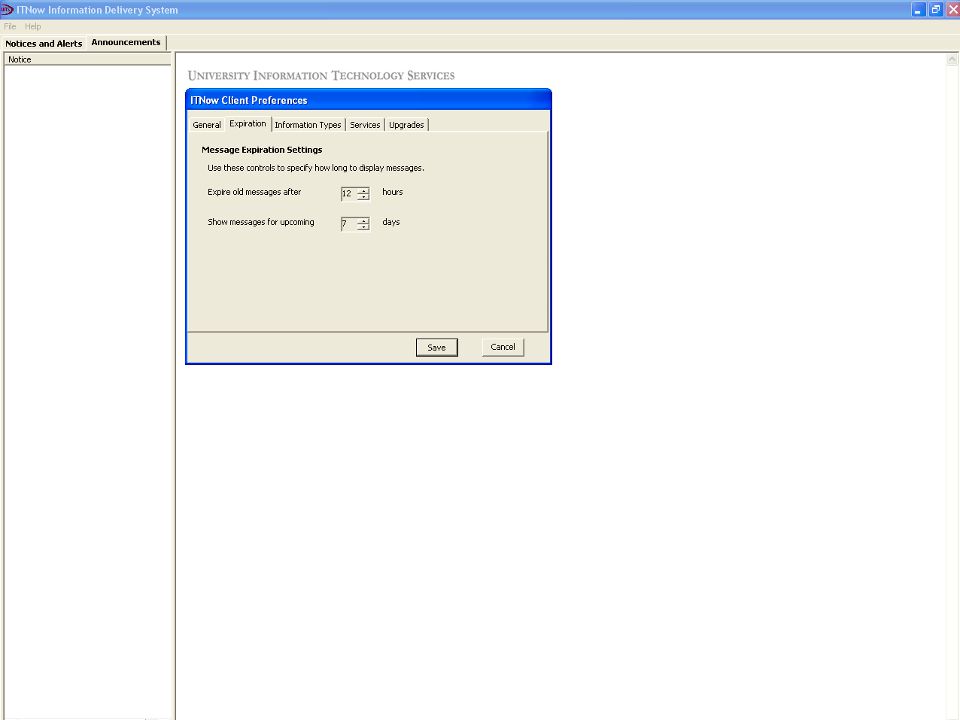
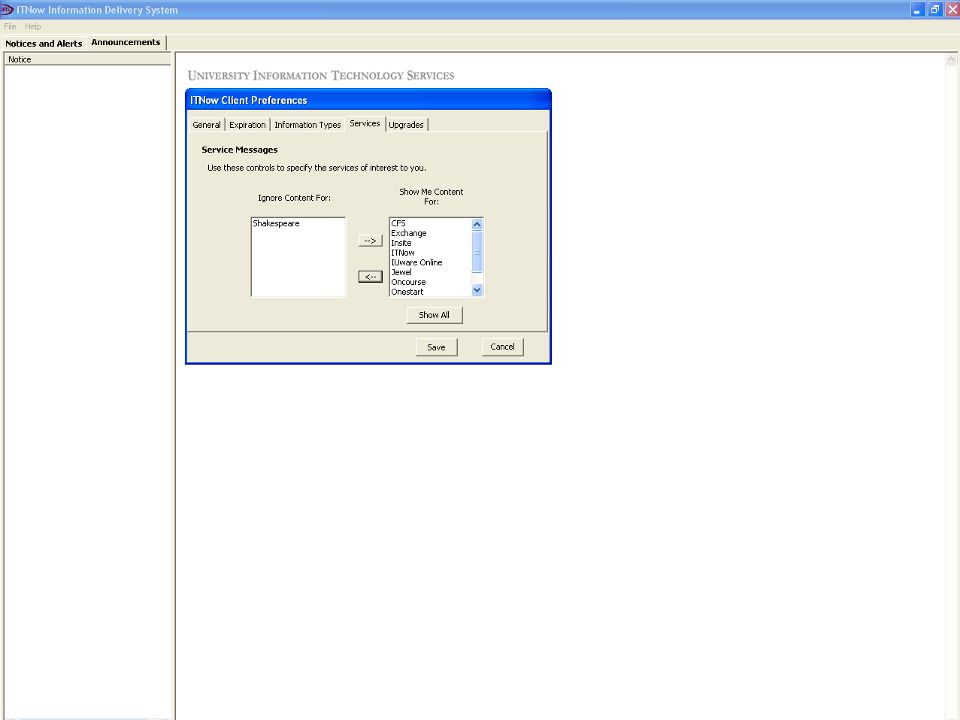
Developed by UITS Resides in system tray Notifies users of IT outages and alerts Keeps users informed about upcoming changes Customizable Gathers user support information Gap Analysis and New Tools: Newest Tool ITNow

102
Gap Analysis and New Tools We are measuring everything

103
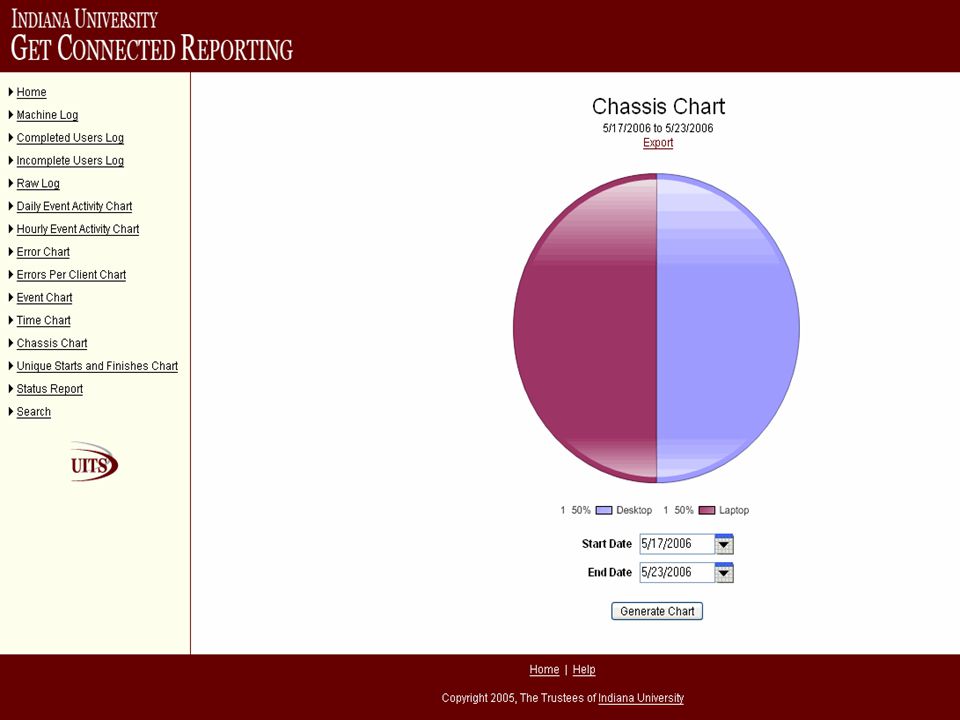
Adjust support and services based on population characteristics Assist users in troubleshooting Identify personal computers not appropriately patched or secured Track trends for future planning of support and services Gap Analysis and New Tools: Newest Tool ITNow Reporting Purposes

104
Gap Analysis and New Tools User Support Dashboard User Support Dashboard

105
Gap Analysis and New Tools So, what are we really doing? Utilizing IT to run our IT Support Business User self-service and support delivery Operations management Tool set – internal and external

106
Choose a project lead and team expert in user support, and have development skills. Create quickly, test for usability, improve, repeat. Make info available in multiple ways. Build systems, not web pages. Leverage your support and system resources. Design with a philosophy. Involve multiple levels of the organization. Create a culture of service. Lessons Learned and Next Steps Advice from OSE Experience

107
The Reward Recognition for web site ACUTA Member Site to See Tech Support Center/Help Desk - 2005 Society for Technical Communication Distinguished Award for Online Communication, User Support Tools – 2006 Excellence Award for Online Communication (International) - 2006
")
108
Center for Applied Research Garland C. Elmore, Indiana University Jan R. Holloway, Indiana University Sue B. Workman, Indiana University Research Bulletin Volume 2004, Issue 23 November 9, 2004 EDUCAUSE Customer-Centered IT Support: Foundations, Principles, and Systems

109
Center for Applied Research Garland C. Elmore, Indiana University Jan R. Holloway, Indiana University Sue B. Workman, Indiana University Research Bulletin Volume 2005, Issue 14 July 5, 2005 EDUCAUSE An Architecture for Evolving IT Customer Services

110
Center for Applied Research Garland C. Elmore, Indiana University Jan R. Holloway, Indiana University Sue B. Workman, Indiana University Research Bulletin Volume 2006, Issue 11 May 23, 2006 EDUCAUSE Vision, Data, and Analysis: An Administrative Structure for Decision Making

111
Some Questions How are you leveraging your resources to meet support demand? Do you have a process to reallocate or reduce budgets to fund rising support costs? How does support compare with other priorities at your institution? Who participates in setting IT priorities? Support priorities? How do division priorities align with each other and with institutional priorities? How are you using IT to run your business? Who looks at support innovation? What’s next?

112
An Architecture for Evolving IT Customer Service Garland C. Elmore Deputy CIO and Dean Associate Vice President elmore@iu.edu Sue B. Workman Director of User Support sbworkma@iu.edu U NIVERSITY I NFORMATION T ECHNOLOGY S ERVICES I NDIANA U NIVERSITY U NIVERSITY I NFORMATION T ECHNOLOGY S ERVICES

Similar presentations


 Tool for Program Assessment Heather Stewart, Director, Institute for Technology Development,>")


