Download presentation
Presentation is loading. Please wait.

1
Historical Flood Mapping from Satellite Imagery Norman Mueller National Earth Observation Group

2
National Flood Risk Information Project Following the Natural Disaster Insurance Review 2011: Geoscience Australia to develop a portal for flood studies and water observations from satellite imagery. Engineers Australia to revise national guidelines for flood modelling and collection, comparability and reporting of flood risk information. The purpose is to provide a single authoritative source of flood related information for use by all or any sector, including local governments, industry and the public. National Flood Risk Information Portal

3
Earth Observation Component of NFRIP Analyse satellite imagery to find surface water. Derived from the historical satellite imagery available to Geoscience Australia, in particular the archive of Landsat-5 and Landsat-7 imagery for the period of 1987 to 2012. A “time series” of water observations for all of Australia. The time-series of observed water to be queried or combined with other data to generate map products and web feature services. Provides information on where water has been seen in the past and helps to inform where flooding may have occurred. National Flood Risk Information Portal

4
Landsat Landsat-5, -7 and -8 Medium spatial resolution (25m x 25m pixel) Views the same area every 16 days Regional coverage 185km wide path
 Views the same area every 16 days Regional coverage 185km wide path")
6
National Flood Risk Information Portal How to show flood information? Medium resolution (Landsat) – 185km wide strips across Australia repeated every 16 days Single flood extents gives a single snapshot of one flood only, often only partial loses continuity across swath edges Summary flood products shows the behaviour of water in an area for all images over all available snapshots through time displaying ratio of detected water to number of good observations provides continuity across swath boundaries
 – 185km wide strips across Australia repeated every 16 days Single flood extents gives a single snapshot of one flood only, often only partial loses continuity across swath edges Summary flood products shows the behaviour of water in an area for all images over all available snapshots through time displaying ratio of detected water to number of good observations provides continuity across swath boundaries.")
7
What does this sort of information help to inform? Knowing where water has been before can help with flood planning and mitigation Understanding how often water exists in a given location is important in managing water resources (eg Broken Hill Managed Aquifer Recharge) Comparing water resources with the surrounding area helps inform environmental management and planning A driver for scientific infrastructure policy: The ability to provide these information products relies on the underlying infrastructure: Access to satellite services / capabilities (satellite utilisation policy) High performance computing to extract information (national computational infrastructure) Information delivery mechanisms (open data policy) National Flood Risk Information Portal
 Comparing water resources with the surrounding area helps inform environmental management and planning A driver for scientific infrastructure policy: The ability to provide these information products relies on the underlying infrastructure: Access to satellite services / capabilities (satellite utilisation policy) High performance computing to extract information (national computational infrastructure) Information delivery mechanisms (open data policy) National Flood Risk Information Portal.")
8
Water Observations from Space The summary product will be made available as a web service for use in analysis packages: ArcGIS and similar Google Earth National Flood Risk Information Portal

9
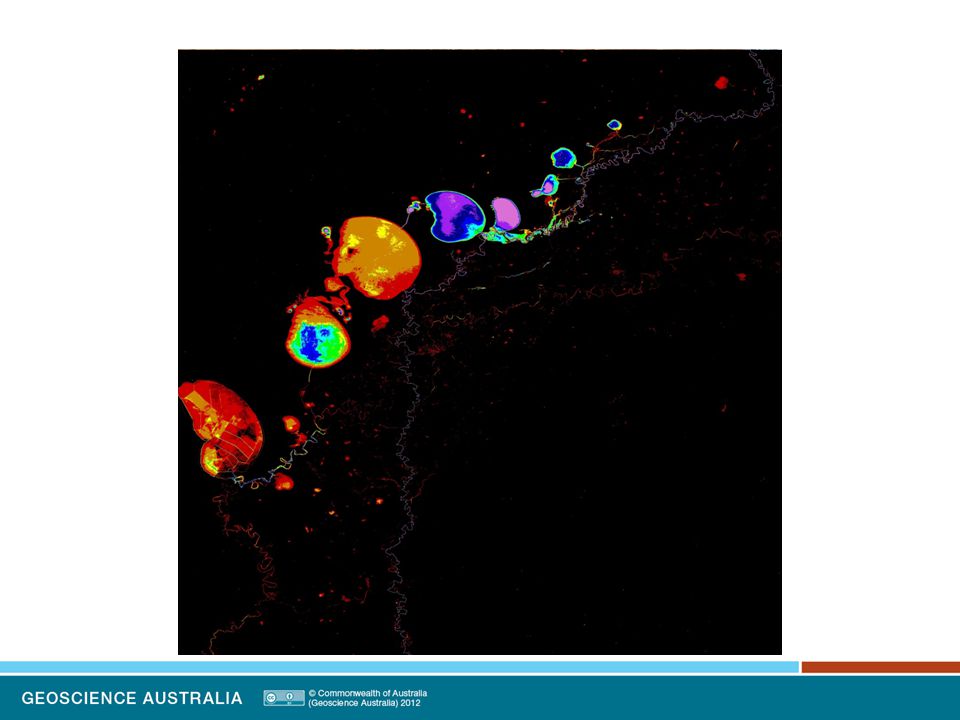
Examples of WOfS Current progress has all of Australia analysed for the 1998 to 2012 period

10
National Flood Risk Information Portal Chinchilla zoom-in

11
National Flood Risk Information Portal Lake Eyre zoom-in

12
Questions National Flood Risk Information Portal

Similar presentations