Download presentation
Presentation is loading. Please wait.

1
Geographic Information Systems ASM 215 Feb 2013 Larry Theller

2
Schedule Wednesday –GIS lecture –Disc of homework Lab – Thursday GPS Feb 28 Lab – ABE 105 or 116 computer labs

3
GIS Lecture today History Software details Current GIS uses Hot GIS trends Feb 28 lab

4
Geographic Information Systems GIS means “Geographical Information System” –its called SYSTEM because there is information behind the map. –You may “ask questions” of the data or of the map

5
GIS Evolution Map viewing >> Map Analysis Past: map layers = little files Now: map layers = huge databases We use Terabytes of images Streaming GIS data = music on the web Web-based tools do not install on your computer

6
Example: Map of cholera outbreak, 1854 (Based on John Snow’s map) Other analysis examples?
 Other analysis examples")
7
GIS is not CAD Difference between CAD and GIS software: –you ask questions in GIS Three levels of GIS applications: –Inventory (What is there?) –Analysis (Answering questions) –Modeling (Making predictions) CAD stands for Computer-Aided Design
 –Analysis (Answering questions) –Modeling (Making predictions) CAD stands for Computer-Aided Design")
8
Image: ESRI course Learning ArcGIS Desktop 2007 A GIS is a software system that connects map layers with tables of information. Tabular Data

9
Spatial Analysis is considered the crux of GIS. Why? Spatial analysis is the means of adding value to geographic data. It turns data into information Spatial analysis can reveal things that might otherwise be invisible. It can make what is implicit explicit.

10
More about spatial analysis… Some methods are highly mathematical. All effective spatial analysis requires an intelligent user, not just a powerful computer. “Spatial analysis is best seen as a collaboration between the computer and the human, in which both play vital roles.” (Geographic Information Systems and Science, Wiley, 2001)
.")
11
The GIS analytical process 1. Define the problem 2. Define the criteria 3. Identify the data you need 4. Plan the analysis 5. Prepare the data for analysis 6. Execute the analysis 7. Examine and present the results

12
A GIS originally was software installed on a computer and using local files as layers with attached tables of information.

13
GIS and the internet GIS Users quickly adopted the internet for download of large files With satellite-sensors and digital camera the files soon became gigantic Not efficient to copy to every PC in Indiana

14
This map is drawing data from two streaming data sources on the web and from files on the hard drive. These high-resolution aerial photos use 8 terabytes of storage at IU, which is why you do not want to download files anymore Named streets and property parcel lines from the Tippecanoe County GIS server

15
Streaming High-resolution images

16
Don’t Download that image If you don’t need to change it, maybe you don’t need to download it If you need to change it, edit it or clip out parts, you need to have your own copy. Aerial Photos – Indiana 2005 photos are: –8500 gigabyes –Or 2000 DVD’s –Sure you want to download that?

17
Location Business Services: The geo fence You know when a vehicle passes into or out of a zone. Monitor deliveries, service staff, employees, felons, ambulances, pizza delivery guy.. –http://gis2.esri.com/showcase/showcase.cf m –http://tuxedo.esri.com/geofence/

18
Web Location Business Services Target marketing geographically –Cell phone yellow pages Google and Mapquest, –Spots on the map, Gas, food, etc. eBay –Nearby items

19
Mobile GoogleEarth Google Earth for iPhone Google Earth for Android

20
GIS software on your desktop ESRI ArcGIS (ArcMap, ArcCatalog) Other Commercial : ThinkMap, Autodesk Map 3D or Civil 3D, MapInfo Commercial but free Viewers: –Google Earth –ArcGIS Explorer Open Source GIS: –uDIG (user-friendly Desktop Internet GIS) –Quantun GIS (most full-featureed and free)
 Other Commercial : ThinkMap, Autodesk Map 3D or Civil 3D, MapInfo Commercial but free Viewers: –Google Earth –ArcGIS Explorer Open Source GIS: –uDIG (user-friendly Desktop Internet GIS) –Quantun GIS (most full-featureed and free)")
21
uDIG – free and web-oriented Scale Bar Legend Labels Streaming data; databases, tables, shapefiles uDIG Open Source GIS

22
Quantum GIS (free)
")
23
Overlay Combine spatial and attribute data from two or more spatial data layers Union and Intersect most common

24
Buffers Buffer = region that is less than or equal to a specified distance from a feature or features Can buffer point, line or area feature Raster or vector data

25
Clip, Intersect, and Union

26
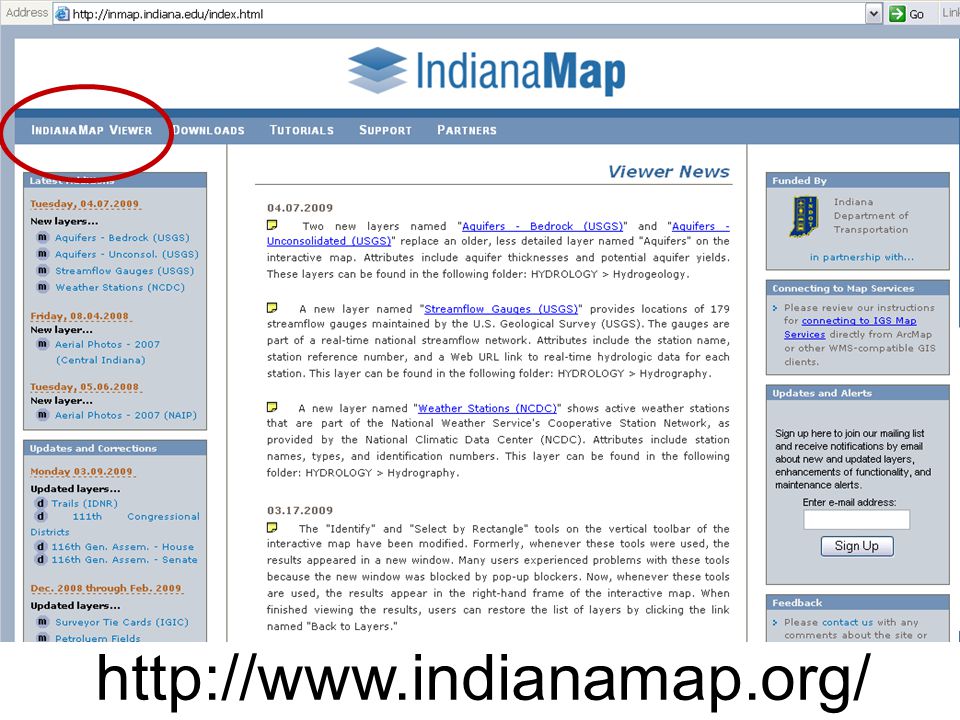
http://www.indianamap.org/
27
Map Gallery

28
Online Map

30
Build my map by adding layers

31
The Lab Exercise - ArcMap

32
THE END

Similar presentations


