Download presentation
Presentation is loading. Please wait.

7
Giussani et al 2001

8
Stowe and Teeri 1978

9
Investigation 2 – Causes and consequences of energy and carbon dynamics in biological systems: Scaling from molecules to ecosystems

10
allocation Biochem Anatomy Physiology

12
Energy, matter, allocation, and growth in a vascular plant E C H2OH2O ions RGR

13
What is RGR? [Mass time time t+1 – Mass time t ] [Mass time t · time interval] units? Time –1 meaning – RGR’s like an interest rate initial account sizeinterest rate d-1acct size in 100 d 100 0.05 = (105-100/100)100(1.05)100 = 13,150 100 0.06100(1.06)100 = 33,930 50 0.06 50(1.05)100 = 16,965 therefore RGR = good measure of size increase rate
![What is RGR. [Mass time time t+1 – Mass time t ] [Mass time t · time interval] units.](http://images.slideplayer.com/17/5370770/slides/slide_13.jpg "Time –1 meaning – RGR’s like an interest rate initial account sizeinterest rate d-1acct size in 100 d = ( /100)100(1.05)100 = 13, (1.06)100 = 33, (1.05)100 = 16,965 therefore RGR = good measure of size increase rate.")
14
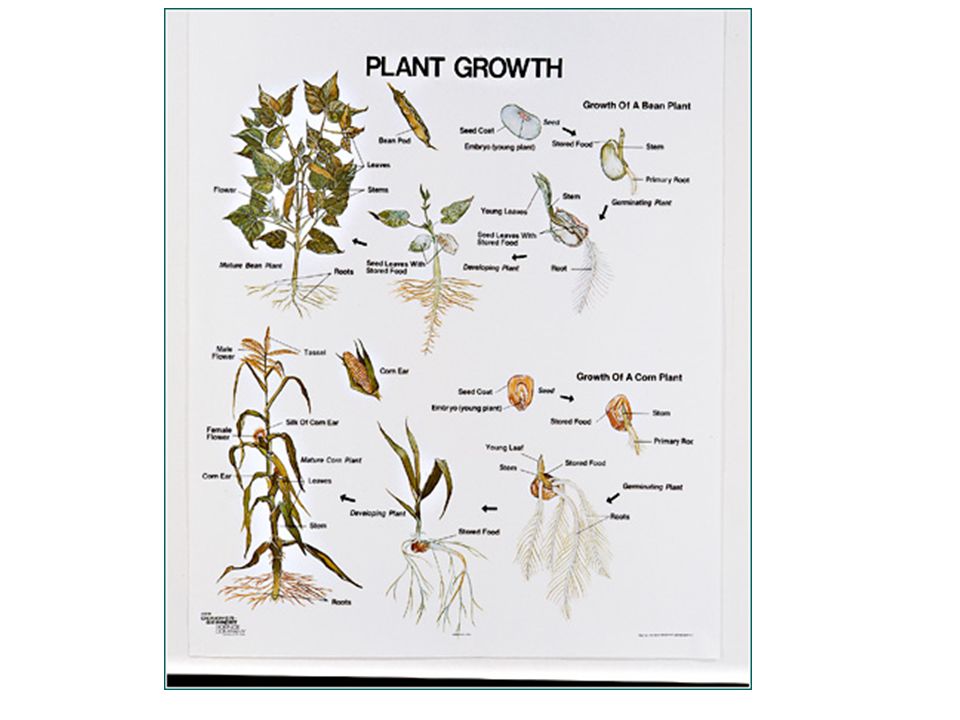
Cast of characters

15
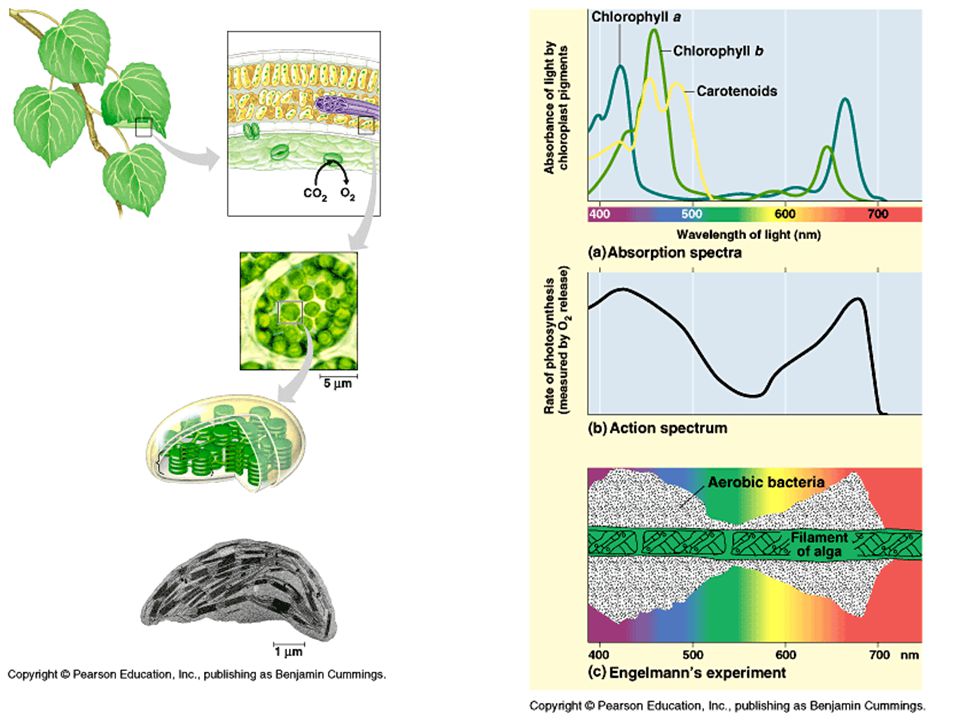
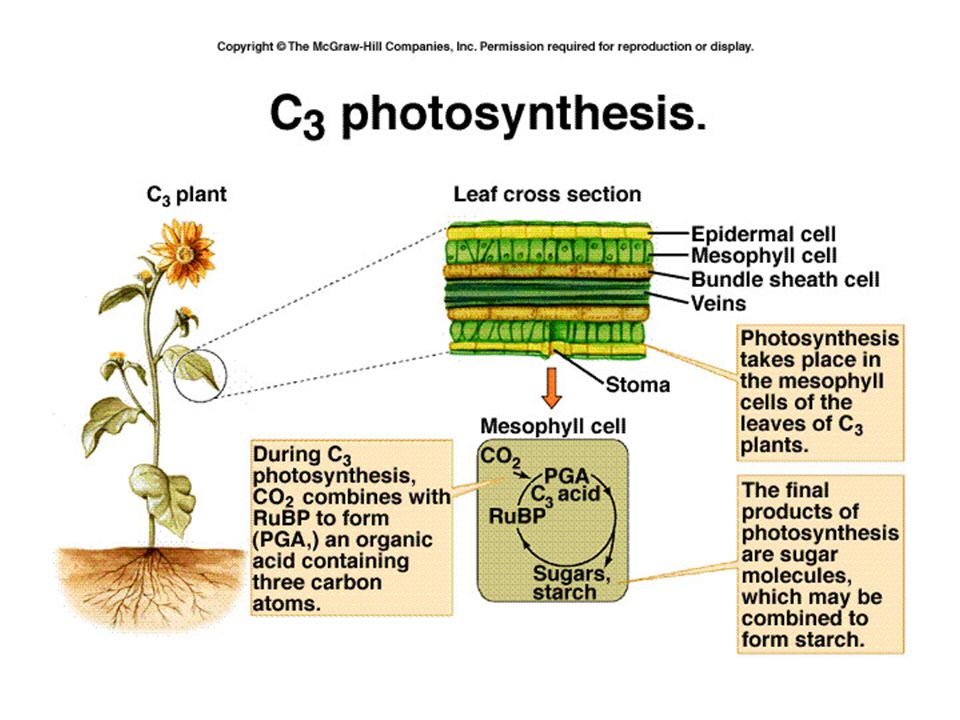
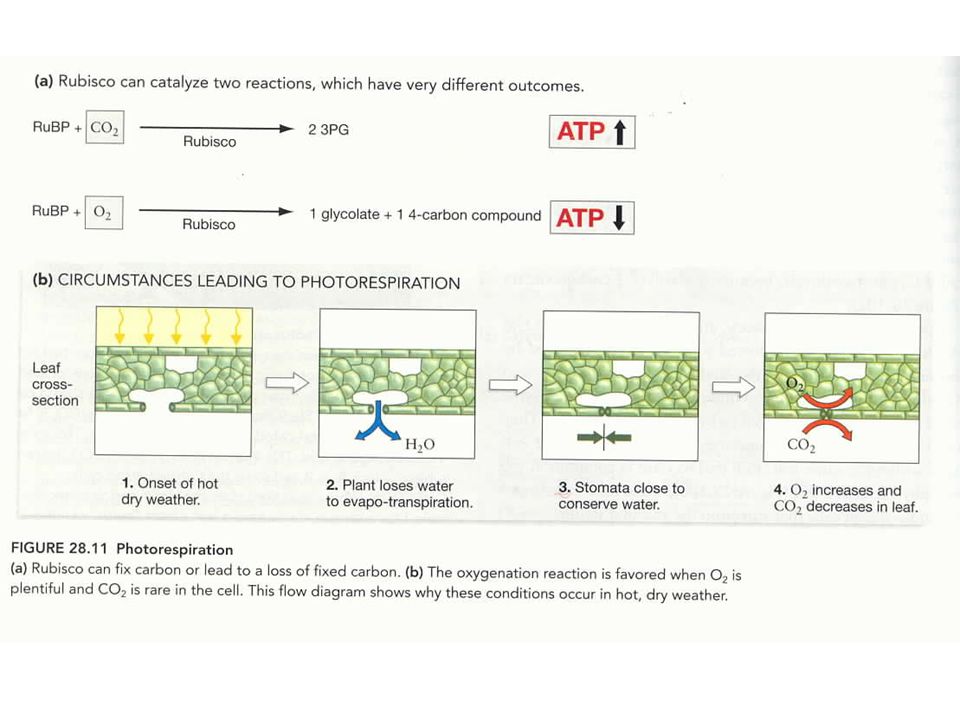
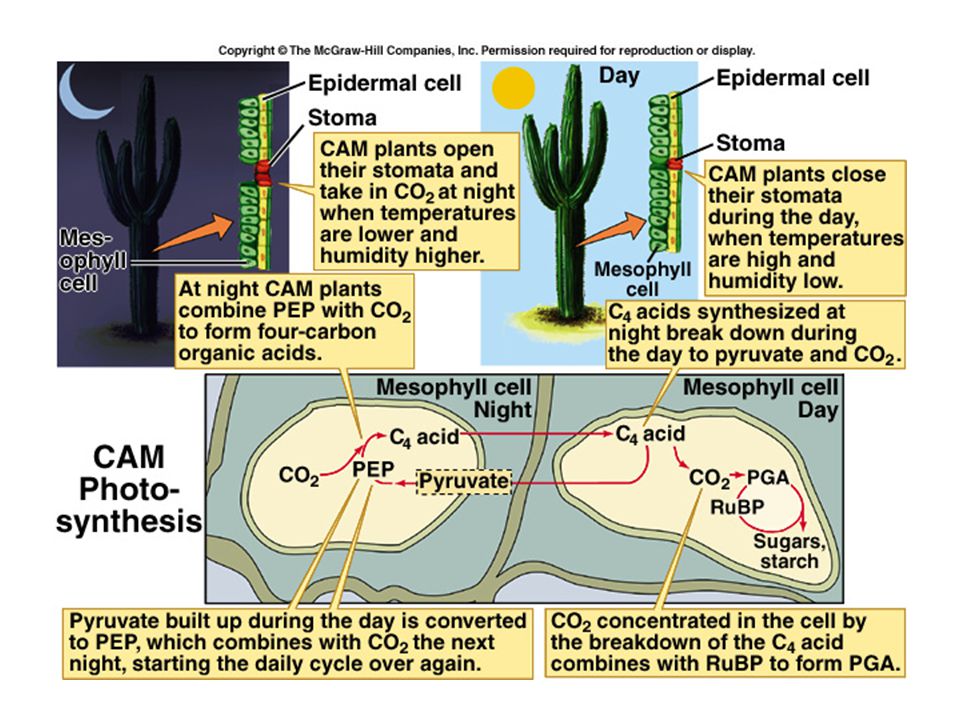
Where did the data come from? A)Biochemical traits 1)C3 v. C4 photosynthesis phylogeny of C4 traits in grass family

16
Where did the data come from? A)Biochemical traits 2) Chlorophyll concentration Grind the 9 cm2 of leaf tissue in 9 ml of 80% acetone. Centrifuge at full speed for 5 min. Dilute supernatant to 10 ml with 80% acetone. Total chlorophyll mg/ml = 0.0202 A645 + 0.00802 A663 mg chlorophyll per gram fresh weight:= = [mg. chlor./ml X volume of extract (ml)] ÷ fresh weight (g)
Biochemical traits 2) Chlorophyll concentration Grind the 9 cm2 of leaf tissue in 9 ml of 80% acetone. Centrifuge at full speed for 5 min. Dilute supernatant to 10 ml with 80% acetone. Total chlorophyll mg/ml = A A663 mg chlorophyll per gram fresh weight:= = [mg. chlor./ml X volume of extract (ml)] ÷ fresh weight (g).")
17
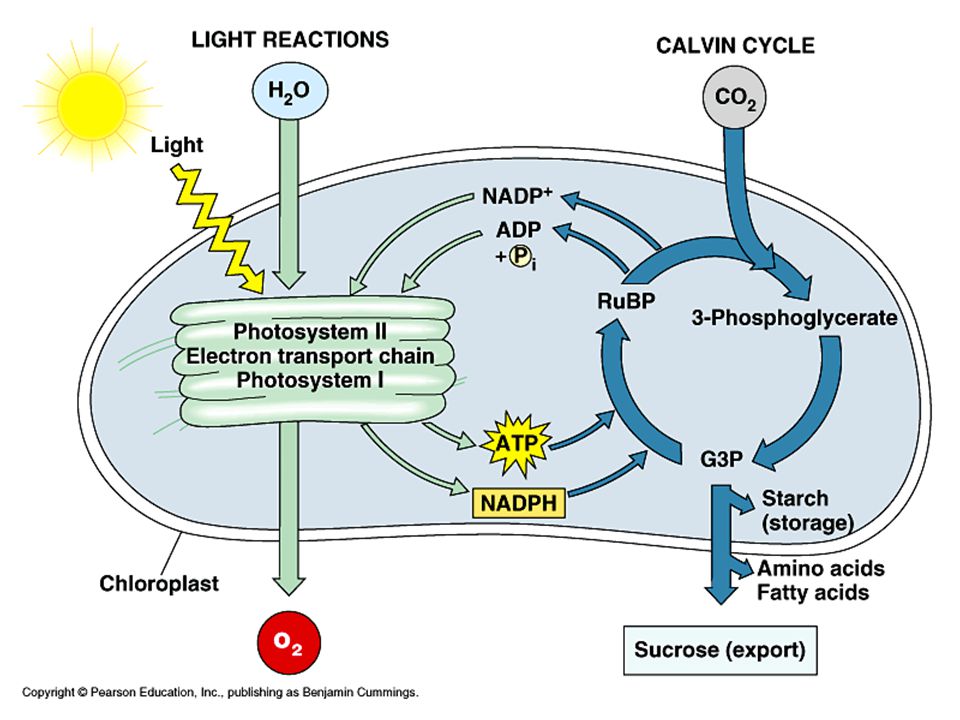
Where did the data come from? B) Leaf gas exchange 1)Photosynthetic rate 2)Respiration rate http://web.grinnell.edu/courses/bio/qubitmanual/Information/Respiration/intro.htm
 Leaf gas exchange 1)Photosynthetic rate 2)Respiration rate")
18
Where did the data come from? C) Resource allocation Root fraction Grow plants individually Initial harvest at 1 month clip shoots wash roots dry 48 h at 65°C weigh root wt / total wt
 Resource allocation Root fraction Grow plants individually Initial harvest at 1 month clip shoots wash roots dry 48 h at 65°C weigh root wt / total wt.")
19
Where did the data come from? D) Growth rate RGR Grow plants individually 2nd harvest 1 wk later unearth & wash dry 48 h at 65°C weigh RGR = (Mass final – Mass initial ) Mass initial wk
 Growth rate RGR Grow plants individually 2nd harvest 1 wk later unearth & wash dry 48 h at 65°C weigh RGR = (Mass final – Mass initial ) Mass initial wk.")
20
Today’s plan 1)Take the variables in Table 1 groups create models depicting: A)Relationships among variables B)Controls of variation in RGR 2)Class creates consensus model. 3) Groups evaluate the model statistically, and hand in worksheets. 4) Class reviews findings and their lessons.
 Groups evaluate the model statistically, and hand in worksheets. 4) Class reviews findings and their lessons..")
22
C4 C3

Similar presentations