Download presentation
Presentation is loading. Please wait.

1
Cirrus Transition Course
Avidyne MFD Cirrus Transition Course 10/20/04

2
The system information, procedures and guidelines found in this presentation are for Reference Only.
The information & procedures in this presentation have been taken from the FAA Approved Airplane Flight Manual and Pilot’s Operating Handbook (POH). The Information & Procedures in this presentation DO NOT SUPERSEDE the Information & Procedures in the POH. In the event of conflict, the POH shall take precedence.
. The Information & Procedures in this presentation DO NOT SUPERSEDE the Information & Procedures in the POH. In the event of conflict, the POH shall take precedence.")
3
Avidyne FlightMax MFD The Multi-Function Display (MFD) is a 10.4 inch landscape orientated LCD mounted in the center of the instrument panel. The MFD Provides a supplemental display of situational and navigational information to the pilot. The MFD accepts data from a variety of sources: GPS sensors, Stormscope, SkyWatch Traffic Advisory System, Terrain Awareness Warning System, CMax Jeppesen Charts and XM Weather Downlink.

4
System Structure ADAHRS Magnetometer OAT (1) OAT Probe XM Weather
Magnetic Heading OAT (1) OAT Probe ADAHRS MFD OAT probe located on right side by engine cowling. XM Weather Antenna TAWS Processor Crossfill Skywatch (4) TAWS Annunciator AS GPSS Relay (2) Stormscope Heading Bug Nav/GPS CDI Altitude Pre-Select VSI Bug Failure Flag Turn Coordinator (3) 1 The PFD’s OAT probe is located underneath right wing fuel vent panel . Used for TAS calculations, not Displayed on PFD if equipped with engine monitoring. Black: Navigation source information, Outside Air Temperature probe data and Airspeed switch signal for Skywatch activation Thin Black Line: Groundspeed switch for transponder activation. Bright Green: Altitude Encoding and Sky watch information Amber: Magnetic Heading Information Red: GPSS Relay Information when PFD power is off. Grey: Normal Navigational/Autopilot information pathway Purple: Garmin Crossfill information Yellow: Turn coordinator information (inclined gyro behind the instrument panel) Blue: Stormscope information Brown: Terrain Awareness/Warning System (KGP 560 Processor) Olive Drab Green: XM Weather Rate of Roll 2 Used only during PFD Failure for proper autopilot operations. Connected when PFD has no electrical power (CB’s pulled). Altitude Transducer 3 Turn Coordinator is an Inclined gyro placed behind the instrument panel. GS Blind Encoder GS = Ground Speed Activation Switch 4 Skywatch has an Airspeed switch for automatic activation that is located in the pitot tube. Approximately set for 30 KIAS
 OAT Probe. ADAHRS. MFD OAT probe located on right side by engine cowling. XM Weather. Antenna. TAWS. Processor. Crossfill. Skywatch (4) TAWS. Annunciator. AS. GPSS Relay (2) Stormscope. Heading Bug. Nav/GPS CDI. Altitude Pre-Select. VSI Bug. Failure Flag. Turn. Coordinator (3) 1 The PFD’s OAT probe is located underneath right wing fuel vent panel . Used for TAS calculations, not Displayed on PFD if equipped with engine monitoring. Black: Navigation source information, Outside Air Temperature probe data and Airspeed switch signal for Skywatch activation. Thin Black Line: Groundspeed switch for transponder activation. Bright Green: Altitude Encoding and Sky watch information. Amber: Magnetic Heading Information. Red: GPSS Relay Information when PFD power is off. Grey: Normal Navigational/Autopilot information pathway. Purple: Garmin Crossfill information. Yellow: Turn coordinator information (inclined gyro behind the instrument panel) Blue: Stormscope information. Brown: Terrain Awareness/Warning System (KGP 560 Processor) Olive Drab Green: XM Weather. Rate of Roll. 2 Used only during PFD Failure for proper autopilot operations. Connected when PFD has no electrical power (CB’s pulled). Altitude Transducer. 3 Turn Coordinator is an Inclined gyro placed behind the instrument panel. GS. Blind. Encoder. GS = Ground Speed Activation Switch. 4 Skywatch has an Airspeed switch for automatic activation that is located in the pitot tube. Approximately set for 30 KIAS.")
5
Avidyne FlightMax MFD Standard MFD Functions The MAP page
The TRIP page The NEAREST page The CHECKLIST pages The SYSTEM SETUP Optional Installed Equipment The Terrain Awareness Warning System page XM Weather System CMax Approach and Airport Charts System Skywatch Traffic Avoidance System Strikefinder Lightning Detector EMax Engine Monitoring

6
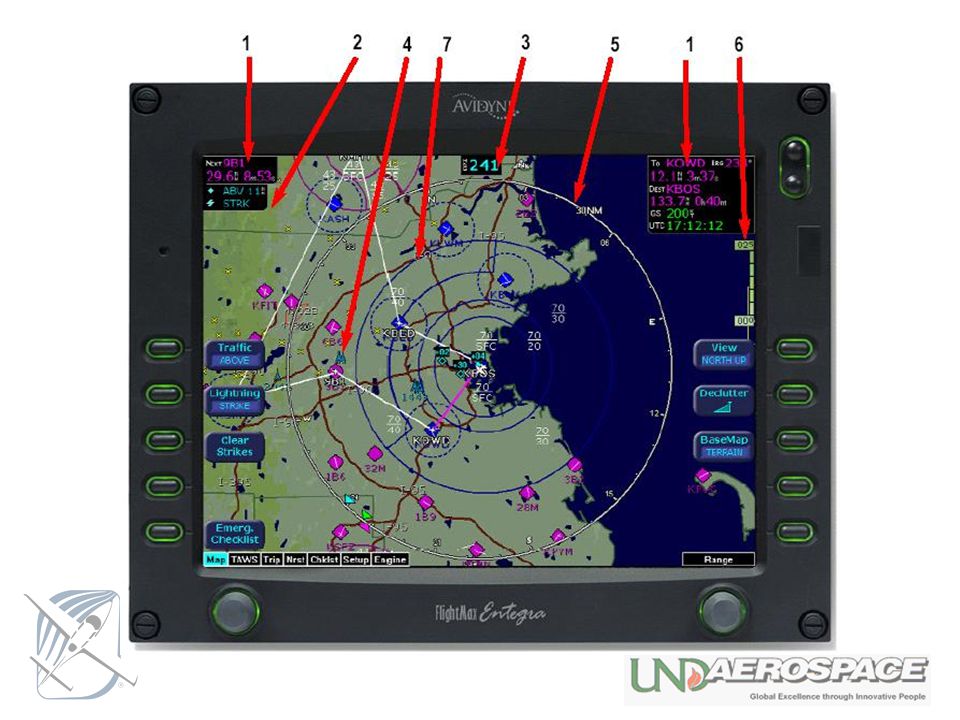
MFD MAP Page The MAP page is the primary page and presents the pilot with a pictorial of the aircraft position, flight plan, and nearby lightning and WX Data as well as traffic. The moving map display must not be used as the primary navigation instrument. Use of Map page during IFR flight requires an IFR approved GPS receiver installation operated in accordance with applicable limitations. Navigation data on the moving map is based on data that is periodically updated on a 28 day cycle from Avidyne. Obstacle clearance data on the moving map is updated on a 56 day cycle from NOAA. A warning message will be displayed on the system set-up page upon initialization of unit. The only way to clear these messages is to update the databases through the USB port located on the front bezel.

8
MFD Map Page Symbology 1.) Data Blocks (Left & Right) - View navigation and engine (when equipped with engine monitor) data in data blocks in the upper corners of the display. 2.) Sensor Status Box - Displays the status of the lightning and traffic sensors installed on the aircraft. 3.) Heading/Track Indicator - Three triangles around the compass rose provide actual track, desired track, and heading indications.
 Data Blocks (Left & Right) - View navigation and engine (when equipped with engine monitor) data in data blocks in the upper corners of the display. 2.) Sensor Status Box - Displays the status of the lightning and traffic sensors installed on the aircraft. 3.) Heading/Track Indicator - Three triangles around the compass rose provide actual track, desired track, and heading indications.")
9
MFD Map Page Symbology Compass Rose/Range Ring - Displays a 360 degree or 120-degree compass circle or arc and also indicates current range setting. The range number is the distance from the airplane symbol to the compass arc. Terrain Scale - Shows highest and lowest limits of terrain in displayed area. Legend colors in between these numerics represent terrain elevations. Blue obstacle clearance number shows the top of the highest obstacle, when greater than the highest displayed terrain. Terrain data is not displayed when your aircraft’s latitude is greater than 75 degrees (north or south). Special Use Airspace - The MFD uses several different line styles to convey special use and class airspaces. Class B is solid blue line, Class C is solid magenta line. Class D is dashed blue line, MOA, Warning, and Alert areas are solid yellow lines, and restricted and prohibited areas are solid red lines. Reference Table 6 and associated note
. Special Use Airspace - The MFD uses several different line styles to convey special use and class airspaces. Class B is solid blue line, Class C is solid magenta line. Class D is dashed blue line, MOA, Warning, and Alert areas are solid yellow lines, and restricted and prohibited areas are solid red lines. Reference Table 6 and associated note.")
10
XM Satellite Weather System

11
XM Satellite Weather System
The XM Satellite Weather System enhances situational awareness by providing the pilot with real time, graphical weather information. The XM antenna is integrated with the COM1 antenna it receives weather information from dual-redundancy satellites, that broadcasts in the S-Band frequency range. The signal is sent to the XM receiver, installed in the co-pilot side of the instrument console. The XM Satellite Weather System is powered by 28 VDC supplied through the 3-amp Weather/Stormscope breaker on the Non-Essential Bus. Subscription to a XM Satellite Weather System Service Package is required for operation. Once activated, the XM Satellite Weather System will overlay the NEXRAD Radar METARs SIGMETs AIRMETs TFRs Lightning Strikes

12
XM Weather

13
XM Weather 1. Sensor Status Block - with Broadcast datalink installed, the Sensor Status Block gives the status of the weather information presented. The Lightning sensor status will reflect if the lightning information displayed on the Map is from the broadcast datalink, or from the on-board lightning sensor, if installed. The broadcast datalink sensor status is shown on the bottom line of this block, and indicates if the external broadcast satellite receiver is reporting a good operational status. The age of the most recent NEXRAD radar image is also listed.

14
XM Weather

15
XM Weather Lightning button - controls the display of lightning information on the Map page. Pressing the button toggles between Datalink and Display Off, or if a WX-500 lightning sensor is installed, between Strike, Cell, Datalink, and Display Off. Lightning will not be displayed from both Datalink and WX-500 at the same time. Clear Strikes button - clears the current lightning strike symbols from the screen for WX-500, if installed. Does not clear datalink Lightning Wx Rprts button - controls the display of METAR symbols, AIRMETs, and SIGMETs on the Map page. Pressing the button toggles through All, METARS, SIGMET, AIRMET, and Display Off.

16
XM Weather Symbology 5. Lightning strike symbols - Lightning information from the XM broadcast satellite is matched to grid coordinates with a resolution of approximately 2 NM. Overlapping lightning symbols may be decluttered for clarity. The lightning strike symbols for datalink lightning are shaded according to their age, with strikes older than 15 minutes removed from display.

17
XM Metar Symbology METAR symbols - Each METAR reporting station shown on the Map page will have a METAR condition flag displayed. The color of the METAR flag indicates the current conditions at that airport: For more details, see Table 6 in the Pilots Guide Appendix.

18
XM Radar Symbology AIRMETs/SIGMETs - AIRMETs and SIGMETs are shown as ribbed lines enclosing the area of the advisory and are color coded and labeled as to their type. For more details, see Table 6 in the Pilots Guide Appendix. NEXRAD radar images - The XM broadcast NEXRAD images are delivered with a resolution of approximately 1 NM. The MFD smoothes the edges of the NEXRAD images, so that the images are not distracting at smaller zoom ranges.

19
XM Weather Symbology Wx Ovly button - controls the display of the NEXRAD overlay on the Map page. Pressing the button toggles between Broadcast NEXRAD radar images and Display Off. TFR - Temporary Flight Restrictions are also reported over the Broadcast datalink. TFRs are shown with solid RED lines on the Map page.

20
XM Weather Radar

21
XM Weather Radar The Air/Sig button - controls the display of AIRMETs and SIGMETs, and pressing it toggles between ALL, AIRMET, SIGMET, and OFF. The Metar button - controls display of the graphical METAR symbols on the Map page, and pressing it toggles between ON and OFF. The NEXRAD colors conform to aviation standards, with Green, Yellow, Red, and Magenta depicting varying intensities of rainfall. Shades of Blue for snow and shades of Pink for mixed precipitation.

22
XM Weather in Trip Page Each waypoint on the current active Flt-plan can be associated with a METAR reporting point. For non-airport waypoints, the nearest METAR is used. The general conditions are reported with the same METAR flags as used on the Map page. For legs on the Flt-plan that exceed 100nm in length, the MFD will select "intermediate waypoints" in between the waypoints of the leg.

23
XM Weather in Trip Page

24
XM Weather in Trip Page METAR symbols - Using the same METAR condition symbols as the Map page, a METAR report is shown for each Flt- plan waypoint. METAR text - the METAR is translated into plain English and presented for the currently-selected waypoint. If the METAR report is for an airport near the waypoint, the distance and direction from the waypoint is shown. Display button - controls the display in the bottom half of the Trip page. Pressing this button alternates between METAR, Legend, and Status. Select knob - use the right Select knob to move the highlight up and down the waypoint list to view the text METAR for the waypoints on the route.

25
TAWS Page DRAFT 10/07/04

26
TAWS Page

27
TAWS Colors

28
TAWS Colors

29
TAWS Display Azimuth Lines Peaks Elevation Maximum elevation
displayed over minimum elevation. Here maximum elevation is 14,200ft. and minimum is 8,000ft. Range Rings Outer ring is selected range, inner ring is half the selected range. Here outer ring is 80nm and the inner ring is 40nm. Azimuth Lines Small Dash’s are 10° and lines are at 20 ° increments to max of 40 °. Measured Sea Level Geometric Altitude MSL-G

30
TAWS Page Terrain and obstacle alerts are the most critical situations displayed by TAWS. There are two levels of alerts: Caution - Possible terrain or obstacle conflict within seconds. Warning - Possible terrain or obstacle conflict within 30 seconds. When a CAUTION alert is triggered, the terrain or obstacle that caused the alert is displayed in bright YELLOW. When a WARNING alert is triggered, the terrain or obstacle that caused the alert is displayed in RED. In addition, a message describing the nature of the alert is presented in the message bar.

31
Terrain Caution

32
Terrain Warning

33
TAWS Please Refer to TAWS Powerpoint presentation, TAWS Pilots Guide and POH supplement for more system, operational and limitation information.

34
CMax Approach and Airport Charts

35
CMax The CMax Approach Charts function allows the pilot to view terminal procedure chart data on the MFD. Most approach charts and airport diagrams are geo-referenced; most arrival, departure, and miscellaneous charts are not. The CMax installation is entirely software dependant. No additional hardware is required.

36
CMax Do not use the CMax Approach Charts function for navigation of the aircraft. The CMax Approach Charts function is intended to serve as a situational awareness tool only. The electronic approach charts must not be used as the primary set of on-board approach charts.

37
CMax The CMax function is found on the MFD as the "Chart" page.
The Chart page is capable of having 2 charts ready for viewing at any one time; Airport diagram and Procedure chart Below 50kts. the MFD will automatically display the Airport diagram of the current flight plan airport.

38
CMax Subscription to JeppView Electronic Airway Manual chart service is required for operation. Contact Jeppesen The MFD Startup Screen reports the valid dates for the currently loaded chart data. The date will be in YELLOW if the next update has passed. If the chart data becomes more than 10 weeks out of date, access to the charts will not be allowed. If no valid GPS position is available at start-up, the Chart page will default to the Chart Selection Page for manual selection of a chart.

39
CMax Chart Selection

40
CMax Chart Selection Airport Entry Field - The Airport Entry Field is used to enter an airport identifier in order to select a chart associated with that airport. The field will be pre-filled with the current position airport on startup. The field will be left blank if the MFD cannot determine a valid position. Chart Selection List - All of the available charts for the airport in the Airport Entry Field are listed. The list of charts will not appear until the user has selected an airport in the entry field. Then the List Charts button should be pushed to switch from selecting an airport to selecting the desired chart. Charts are only listed for those airports that are part of the user's subscription coverage area.

41
CMax Chart Selection FlightPlan button - Toggles the display of the flight plan overlay on the chart Plan View between Display and Off. Changes to this selection are effective immediately. Back to Active button - The Back to Active button returns the user to the chart display screen. Auto Fill button - When pressed, moves the detected destination airport listed on the button into the Airport Entry Field. Select chart - Moves the active selection cursor from the Airport Entry Field to the Chart Selection list. Next Letter button - The Next Letter button moves the cursor within the Airport Entry Field to the next character location. Select knob - Selects the character for the current cursor position when entering an airport identifier.

42
CMax Airport Page

43
CMax Airport Page Airport Identifier - the airport identifier for the current airport is displayed in green. Chart Name - the name of the current chart being displayed, also in green. Geo-referenced Symbol - a globe is shown when the displayed chart is geo-referenced. If the chart is not geo-referenced, the globe symbol is crossed out. Flight Plan Symbol - an FPL symbol indicates the option to display the current flight plan is turned on. If the display of flight plan is turned off, the FPL symbol is crossed out. If a chart is not geo-referenced or no flight plan is received from the GPS, the flight plan cannot be displayed. Ownship - displays the current position of the aircraft. The chart nominally remains fixed and the ownship symbol moves across the chart with aircraft movement. Select Chart button - brings the user to the Selection Page for the selection of a new chart for display. See the description of the Selection Page below.

44
CMax Airport Page

45
CMax Airport Page View button - controls which portion of the chart is being displayed. Day/Night button - Toggles the chart display mode between the Day and Night modes. The Day display is black text on a white background, while the Night display is white text on a black background. The MFD starts up with a default to Night mode. Emerg. Checklist. button - provides one-touch access to the Emergency Checklist page. Pan Buttons - The pan buttons manually move the chart on the screen. They only appear when the current view is able to be panned. Zoom control - Zooms the chart for close-up examination of a specific area. The label only appears when the current view is able to be zoomed. If the user has panned the chart, using the right knob to zoom all the way out to the full-screen chart size will also re-center the chart on the screen.

46
CMax Approach Page

47
CMax Approach Page Display Airport button - The Display Airport button is displayed when the current procedure chart is being displayed. Pressing the Display Airport button allows you to swap between display of the loaded procedure chart and display of the associated airport diagram. Flight Plan - The flight plan is overlaid on the chart plan view when the flight plan display option is selected (on Selection page) and the chart is geo-referenced. Flight Plan active leg - The active leg of the current flight plan, if it appears on the chart, is depicted in magenta. The non-active legs are shown in green.
 and the chart is geo-referenced. Flight Plan active leg - The active leg of the current flight plan, if it appears on the chart, is depicted in magenta. The non-active legs are shown in green.")
48
CMax Approach Chart Views

49
CMax Approach Chart Views
View button Pressing the View button toggles through the available views for that chart. For procedure charts, the views are generally Plan View, Header, Profile, and Minimums. The Header view contains general chart information and appropriate communications frequencies, the Profile view includes the profile view of the approach procedure, and the Minimums view shows the descent minimums for the approach. The Header, Profile, and Minimums views also feature a small "preview pane" of the Plan View, which, although too small to read all chart details, gives the user a general overview of the approach for situational awareness. The flightplan and ownship symbol are also displayed on the preview pane.

50
Trip Page

51
Trip Page Trip page provides the remaining legs of the active flight plan in tabular format Current ground speed and track Flight Plan information from your GPS. Active waypoint is shown in Magenta. Displayed data: WPT - Waypoint identifier as received from the GPS BRG - Bearing to current waypoint DTK - Desired track to waypoint NM - Cumulative great circle distance of each flight plan leg in nautical miles. ETE - Cumulative estimated time en route to waypoint in H:MM format for each flight plan leg at current ground speed. ETA - Estimated time of arrival to waypoint in HH:MM formatted for local time. Fuel (Gal) - Available with Engine and Fuel Monitor function. Displays remaining fuel at each waypoint in gallons.
 - Available with Engine and Fuel Monitor function. Displays remaining fuel at each waypoint in gallons.")
52
Trip Page Course Deviation Indicator (CDI) - Shows lateral distance (Crosstrack deviation) from desired course, providing continuous navigation reference when viewing the Trip page. Local and UTC time in HH:MM:SS using a 24-hour clock format. Destination Airport Information - Provides quick access to airport information for the destination airport, when available.
 - Shows lateral distance (Crosstrack deviation) from desired course, providing continuous navigation reference when viewing the Trip page. Local and UTC time in HH:MM:SS using a 24-hour clock format. Destination Airport Information - Provides quick access to airport information for the destination airport, when available.")
53
Nearest Page Using the Jeppesen NavData data and the GPS-supplied position, the MFD can provide the pilot with the nearest 25 airports or navaids within 100 nm, depending upon pilot selection. This information is presented on the Nearest page. More detail on a particular airport is also generated from the Jeppesen NavData data and is available for viewing on the Info page.

54
Nearest Page

55
Nearest Page TYPE - Cycles through the various data types in the following order: Airports ->VORs ->NDBs ->Intersections ->Obstacles NRST List - Shows a list of the nearest data including identifier, bearing, distance, frequency and name for airports, VORs, and NDBs. Identifier, bearing and distance are displayed for intersections, and MSL (and AGL) height, bearing and distance are displayed for obstacles. Selection Control - Use right knob to move the cursor up or down to highlight a specific airport or other data type. FILTER - Press to see all airport types (SHOW ALL) or only the airport types as defined on the Airport filter page (ON) (Reference Set Up Pages - Airport Filter). Airport Info - Provides quick access to airport information for the airport highlighted. The Airport Info line select button only appears when viewing the Nearest Airports.
 height, bearing and distance are displayed for obstacles. Selection Control - Use right knob to move the cursor up or down to highlight a specific airport or other data type. FILTER - Press to see all airport types (SHOW ALL) or only the airport types as defined on the Airport filter page (ON) (Reference Set Up Pages - Airport Filter). Airport Info - Provides quick access to airport information for the airport highlighted. The Airport Info line select button only appears when viewing the Nearest Airports.")
56
Checklists Page

57
Checklist Pages The Avidyne electronic checklists display supplements the Pilot Operating Handbook checklists and is advisory only. The electronic checklists must not be used as the primary set of onboard airplane checklists.

58
Checklist Pages The Normal and Emergency Procedures Checklists in the MFD are interactive. The pilot is able to check off each step as it is accomplished. Once a step is checked off, it will change color to show that a step has been completed. Checklist steps can be un-checked, the entire checklist can be reset, and confirmation of a completed checklist is indicated. Normal Procedures checklist steps in the MFD are abbreviated from the POH procedures. Notes, Cautions, and Warnings have been removed. The following Normal Procedures Checklists are provided in the Checklist Pages of the MFD: Airspeeds for Normal Operations Before Takeoff In Flight Landing/Shutdown

59
Checklist Pages

60
Performance Checklist Pages
Performance data in the MFD are derived directly from the POH data. The following Performance data and Charts are provided in the Checklist Pages of the MFD: Crosswind Chart Takeoff Distance Chart Selected Cruise Settings Landing Distance Chart

61
Performance Checklist Pages

62
Emergency Checklist Emergency Procedures checklist steps in the MFD are abbreviated from the POH procedures and Notes, Cautions, and Warnings have been removed. The Emergency Checklist soft key is always displayed on the MFD. The following Emergency Procedures Checklists are provided in the Checklist Pages of the MFD: Emergency Airspeeds Ground Emergencies In-Flight Emergencies Landing Emergencies System Malfunctions

63
Emergency Checklist

64
Emergency Checklist Normal Checklist - Press the Normal Checklist button to return to the selection of normal operating checklists. Checklist Types - Provides access to the top-level Emergency checklists for each phase of flight including: Ground Emergency, In-Flight Emergency, Landing Emergency, and System Malfunctions. Available Checklists - Menu of checklists within each type. Pushing the Show Checklist key takes you directly to the desired list. Selection Control - Use right knob to move the blue outlined box up or down to highlight a specific checklist within each menu for viewing. Show Checklist - Press “Show Checklist” to view the highlighted checklist.

65
System Set-up Various System Setup pages allow the pilot to set user preferences for system operation. The software version identification information and database validity dates will also be displayed. The System Setup pages allow access to several pages for preference selection. The System Setup pages provide a means to initiate self test of the traffic and lightning sensors. The following preferences can be set: Airport Settings page – selections for displaying airport type, runway surface type, minimum runway lengths on moving map. Declutter Settings page – selections for defining the base map detail when changing display range. System Time – selection of system time zone and map page menu timeout options. DataBlock Edit page – selection of data to be displayed in the datablock window of the Map page. Swap GPS B – Selecting this soft key in Setup will swap data display from GPS A to GPS B in the event of a failure of GPS 1.

66
System Set-up

67
System Setup Message List including sensor status. This is a record of the messages displayed in the message bar. If more messages are active than space allows, the right knob will allow scrolling. Software build number, system part number and release date are displayed here. Expiration dates for on-board databases are also shown on this page. Setup Menu - Line select keys to select specific setup functions including: Airport Filter, Declutter Settings, Data Block Editing, System Time. Traffic Standby - Switches SkyWatch traffic sensor back into standby mode only while on the ground. To view traffic data while on the ground press Traffic button in Map page. Lightning Strike Test - Initiates a self test of the lightning sensor. Nav Src - Swaps between GPS A and GPS B as to which unit is providing position information and flight plan data to the moving map.

68
Engine Monitoring

69
Engine Monitoring The Engine Monitoring page provides the pilot with engine parameters depicted on simulated gauges and electrical system parameters located in a dedicated region within in the Avidyne MFD display. An Engine Sensor Unit interfaces with engine-mounted sensors, some of which are shared with the standard airplane gauges, and provide data to the MFD for display.

70
Engine Monitoring Fuel Page
Fuel Initialization Page Displayed on startup or when the “Initial Fuel” button is pressed in the engine monitoring page. The MFD will display the fuel initialization page and ask the pilot to input the amount of fuel added to the aircraft. Buttons for "Fuel Full" and "Fuel to Tabs" are available to quickly set commonly used fuel amounts. In addition the right knob can be used to fine tune the amount of fuel added per gallon. When the desired amount has been entered, pressing the "Fuel Done" button will exit the fuel initialization page.

71
Engine Instruments

72
Engine Instruments Gauges - Provides analog and digital readouts of RPM, Manifold Pressure, Percent Power, Oil Temperature, and Oil Pressure. Electrical - Monitors electrical bus voltages and battery current (where applicable). OAT- Digital outside air temperature (OAT) gauge. Fuel - Provides Fuel Flow, Fuel Used, Fuel Remaining, Time Remaining, and Fuel Economy information. Cylinder Temperatures - Full display of Exhaust Gas Temperature (EGT) and Cylinder Head Temperature (CHT) for all six cylinders. Engine Instruments - Cautions and Warnings - In order to assist the pilot in monitoring engine health the MFD will highlight any engine parameters that are not within normal operating conditions. “Caution zone” readings will cause the appropriate annunciation to turn yellow, while “Warning zone” readings will cause a red indication.
. OAT- Digital outside air temperature (OAT) gauge. Fuel - Provides Fuel Flow, Fuel Used, Fuel Remaining, Time Remaining, and Fuel Economy information. Cylinder Temperatures - Full display of Exhaust Gas Temperature (EGT) and Cylinder Head Temperature (CHT) for all six cylinders. Engine Instruments - Cautions and Warnings - In order to assist the pilot in monitoring engine health the MFD will highlight any engine parameters that are not within normal operating conditions. Caution zone readings will cause the appropriate annunciation to turn yellow, while Warning zone readings will cause a red indication.")
73
Fuel Information Flow - Displays the current fuel flow in gallons per hour as reported by the SIU. Used - Displays the total amount of fuel used since the last engine start as reported by the SIU. Rem - Displays the total amount of fuel remaining in gallons. This indication is calculated by the MFD based on the starting fuel entered by the pilot on the fuel initialization page and fuel flow as reported by the SIU. Time - Displays the amount of time remaining before the total useable fuel on board will be consumed. This value is only displayed when the GPS ground speed is greater than 50 knots. Econ - Displays the current fuel economy in nautical. This value is only displayed when the GPS ground speed is greater than 50 knots.

74
EGT/CHT EGT/CHT of each cylinder is displayed as a numeric indication above each bar. An up or down trend row will also appear below this numeric indication to indicate whether a cylinder's EGT/CHT is rising or falling. * The EGT indications are reported by the SIU and in combination with the Lean Assist function are used to aid the pilot in leaning the aircraft's engine for desired performance.

75
EGT Absolute - Selects the “Absolute” mode for EGT display. Absolute mode is the default display mode, which indicates the current exhaust gas temperature for each cylinder. Normalize - Selects the “Normalize” mode for the EGT display. Upon activation, the display will establish all of the current EGT's at a zero point. * EGT in Normalized mode, the bar graphs will indicate overall changes in EGT rather than displaying the actual temperature values as in absolute mode.

76
Leaning for Best Power In order to lean the engine for best power, begin by pressing the Lean Assist button and smoothly lean the mixture control. The MFD will annunciate "Looking for First Peak" at the top of the temperatures section of the display. When leaning for best power, the final mixture setting is based on first cylinder to peak. As the mixture is leaned look for a rise in EGT. (For this example assume that cylinder #5 is the first to peak.) As cylinder #5 peaks the display will annunciate "Peak Detected" and the #5 cylinder bar graph will turn cyan. At this point the pilot should then begin to richen the mixture. As the mixture is richened the display will first annunciate “Looking for #5 to Peak (Rich)” and then “Peak Detected (Rich)” as it determines the peak temperature. Finally, it will display "Best Power" when the optimum best power mixture has been achieved (-65°F to -85°F Rich of Peak). After the desired engine lean setting is achieved, press the “Normalize” or “Absolute” button to exit the “Lean Assist” function.
 As cylinder #5 peaks the display will annunciate Peak Detected and the #5 cylinder bar graph will turn cyan. At this point the pilot should then begin to richen the mixture. As the mixture is richened the display will first annunciate Looking for #5 to Peak (Rich) and then Peak Detected (Rich) as it determines the peak temperature. Finally, it will display Best Power when the optimum best power mixture has been achieved. (-65°F to -85°F Rich of Peak). After the desired engine lean setting is achieved, press the Normalize or Absolute button to exit the Lean Assist function.")
77
Leaning for Best Power

78
Leaning for Best Economy
In order to lean the engine for best economy, begin by pressing the Lean Assist button and smoothly lean the mixture control. The MFD will annunciate "Looking for First Peak" at the top of the temperatures section of the display. As the EGT rise the first cylinder will reach peak EGT followed by the second cylinder. Continue to slowly lean the mixture. After the third cylinder peaks, the annunciation will change to “Looking for Last Peak”. When leaning for Best Economy, the final mixture setting is based on the last cylinder to peak. As the mixture is leaned further, the last cylinder will eventually peak, and the MFD will annunciate "Last Peak Detected." Continue leaning until the MFD annunciates "Best Economy" which will indicate that the best economy mixture has been achieved (-25°F to -50°F Lean of Peak). After the desired engine lean setting is achieved, press the “Normalize” or “Absolute” button to exit the Lean Assist function.
. After the desired engine lean setting is achieved, press the Normalize or Absolute button to exit the Lean Assist function.")
79
Leaning for Best Economy

80
Engine Monitoring on Moving Map

81
Other Lean data block states are:
Data Blocks in the upper left and right corners of the Map page can be configured to show engine instrument information. The “Lean” data block shows the status of the Lean function. After leaning to Best Economy or Best Power on the Engine Page, press the “Absolute” or “Normalize” button to exit the Lean Assist mode. On the Map Page, the Lean data block will show “Economy” or “Power” when the Lean Assist procedure is completed. Other Lean data block states are: Leaning - Displayed when you switch back to the map page before the Lean Assist mode was exited. Incomplete - When the Lean Assist mode is exited prior to achieving Best Power or Best Economy FF Change - When the lean state is changed by a fuel flow adjustment Pwr Change - When the lean state is changed by a power adjustment. Data Block type and placement are examples.

82
Limitations The moving map display must not be used as the primary navigation instrument. The moving map display provides visual advisory of the airplane’s GPS position against a moving map. The information supplements CDI course deviation and information provided on the GPS navigator. Use of Map page during IFR flight requires an IFR approved GPS receiver installation operated in accordance with applicable limitations. Under no circumstances should the Map page terrain representations be used as a basis for terrain avoidance. The Avidyne electronic checklists display supplements the Pilot Operating Handbook checklists and is advisory only. The electronic checklists must not be used as the primary set of onboard airplane checklists. The MFD interfaces with separately approved sensor installations. Adherence to limitations in the appropriate sensor installation POH Supplements is mandatory.

83
Limitations Traffic information shown on the Map page display is provided to the pilot as an aid to visually acquire traffic. Pilots should maneuver their aircraft based only on ATC guidance or positive visual acquisition of the conflicting traffic. Maneuver should be consistent with ATC instructions. No maneuvers should be made based solely on a traffic advisory. Do not use the optionally installed XM Satellite Weather System for navigation of the aircraft. The XM Satellite Weather System is intended to serve as a situational awareness tool only. Do not use the CMax Approach Charts function for navigation of the aircraft. The CMax Approach Charts function is intended to serve as a situational awareness tool only. The electronic approach charts must not be used as the primary set of on-board approach charts. The Avidyne FlightMax EX5000C Pilot’s Guide, P/N , Revision 03 or later, must be available to the pilot during all flight operations.

Similar presentations


 O-0205 LOCATE A POINT ON A MAP USING THE CAP GRID SYSTEM (S) O-2003 GRID.>")


 and Radio Navigation (R/N) services R/T Communications English is the standard language for all commercial flights,>")


