Download presentation
Presentation is loading. Please wait.

1
Exploring & Visualizing Hot & Cold Game metaphor

2
Picture as exploration Most of the polynomiography methods are based on root-finding Roots themselves however present little interest The important part is the process of root- finding rather than result

3
The standard algorithm Every point in the plane is assigned two numbers: speed of convergence and root index The two numbers are later transformed into a color

4
Speed of convergence Pick up a point in the plane Iterate it (repeatedly apply a certain procedure) Stop based on some criterion Record how many times you did That’s number of iterations = speed of convergence
 Stop based on some criterion Record how many times you did That’s number of iterations = speed of convergence")
5
Root index Polynomials, or functions in general, typically have more than one root The root index is a whole number recording to which root we arrived = our final destination

6
Coloring Algorithm Typically the root index determines the color of the point (red, green, blue, etc) The speed of convergence (number of iterations) determines the hue of the color [some quick example with the software demonstrating where a point converges and how fast]
![Coloring Algorithm Typically the root index determines the color of the point (red, green, blue, etc) The speed of convergence (number of iterations) determines the hue of the color [some quick example with the software demonstrating where a point converges and how fast]](http://images.slideplayer.com/17/5327508/slides/slide_6.jpg "Coloring Algorithm Typically the root index determines the color of the point (red, green, blue, etc) The speed of convergence (number of iterations) determines the hue of the color [some quick example with the software demonstrating where a point converges and how fast]")
7
Math is difficult, painting – not Difficult part: iterating points and computing the two numbers for every point we want to paint Easy part: Reassigning color for the two given numbers [example in the software showing that recoloring takes much faster than recomputing and examples of coloring]
![Math is difficult, painting – not Difficult part: iterating points and computing the two numbers for every point we want to paint Easy part: Reassigning color for the two given numbers [example in the software showing that recoloring takes much faster than recomputing and examples of coloring]](http://images.slideplayer.com/17/5327508/slides/slide_7.jpg "Math is difficult, painting – not Difficult part: iterating points and computing the two numbers for every point we want to paint Easy part: Reassigning color for the two given numbers [example in the software showing that recoloring takes much faster than recomputing and examples of coloring]")
8
Typical Results Smooth parts = continuity areas Fractal = difficult = interesting areas

9
Goals Predict the fractal parts without too much computing Possibly suggest some root-estimating or root-proximity methods (as opposed to root-finding methods) Get cool pictures in the process! [end of introduction]

10
Root = object we seek When we are at the root, we know it Even when not at the root we know if we’re close or not Use |p(x)|, the absolute value (norm) of the polynomial computed at point x Norm = absolute value of the polynomial = temperature
|, the absolute value (norm) of the polynomial computed at point x Norm = absolute value of the polynomial = temperature")
11
Game of Hot and Cold Hide an object (root) Search for it (algorithm) Follow hints (numerical data) Hot = you are close Cold = you are far Warmer = you are getting closer Colder = you are moving away from it
 Search for it (algorithm) Follow hints (numerical data) Hot = you are close Cold = you are far Warmer = you are getting closer Colder = you are moving away from it")
12
Bridge between continuous and fractals Smooth and continuous Fractal and discontinuous

13
Method 1: Plotting Follow the analogy with the temperature Plot the “temperature” = absolute value of p(x) over the given two-dimensional area Temperature map with red areas around the roots (hot) and white (cold) areas with high values of p.
 over the given two-dimensional area Temperature map with red areas around the roots (hot) and white (cold) areas with high values of p.")
14
Method 1: Picture

15
Game-to-Math Dictionary A (big!) house with objects hidden inside Our search strategy Hidden objects Where we are Our next position Temperature at where we are … at where we’ll be Polynomial p(x) Iteration function Roots x p(x) p(φ(x))
 house with objects hidden inside Our search strategy Hidden objects Where we are Our next position Temperature at where we are … at where we’ll be Polynomial p(x) Iteration function Roots x p(x) p(φ(x))")
16
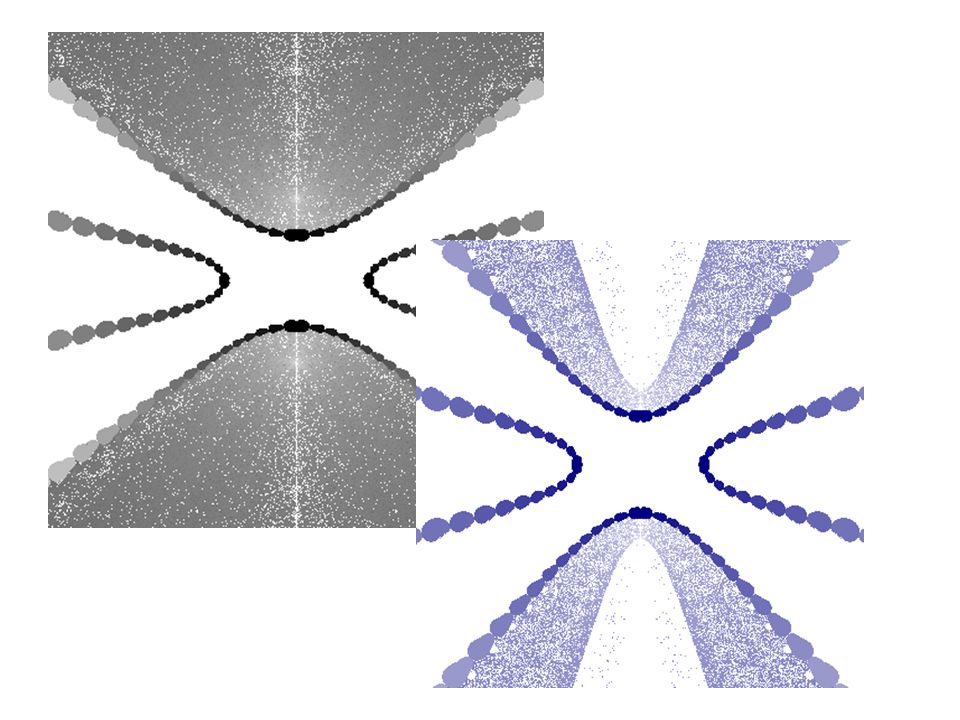
Method 2: Peeking and plotting If I enter that room: will it be hot or cold? Instead of plotting the temperature at where we are, we plot at where we will be Plotting |p(φ(x))|. If it is good a point and good searching strategy, φ(x) will be close or closer to a root
)|. If it is good a point and good searching strategy, φ(x) will be close or closer to a root.")
17
Peeking: Picture

18
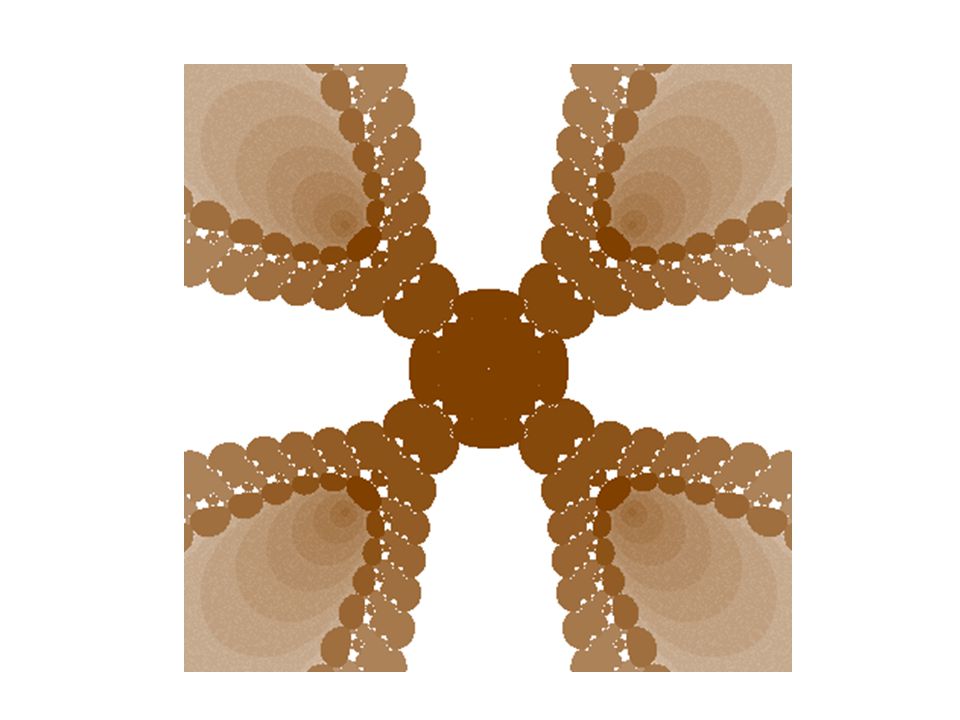
Method 3: Relative If I enter that room: will it be hotter or colder? Plots relative increase or decrease in temperature Plotting

19
Relative plotting

20
Method: Decreasing sequence Traditionally we look at the sequence x i+1 = p(φ(x i )) Terminate it when we’re close to a root In this method, we terminate the sequence when we’re going away from the root (measured by |p(x)|) Stopping at your destination vs stopping when we hit dead end
) Terminate it when we’re close to a root In this method, we terminate the sequence when we’re going away from the root (measured by |p(x)|) Stopping at your destination vs stopping when we hit dead end")
21
Decreasing sequence: Picture

Similar presentations


 Heating Houses You will learn about: The differences between heat and temperature How energy flows How to read a thermogram www.PhysicsGCSE.co.uk.>")
 2. Entire maps ( exp(z))>")

>")
. Solving of the linear equation system.>")


