Download presentation
Presentation is loading. Please wait.

1
How to interpret contamination plumes

2
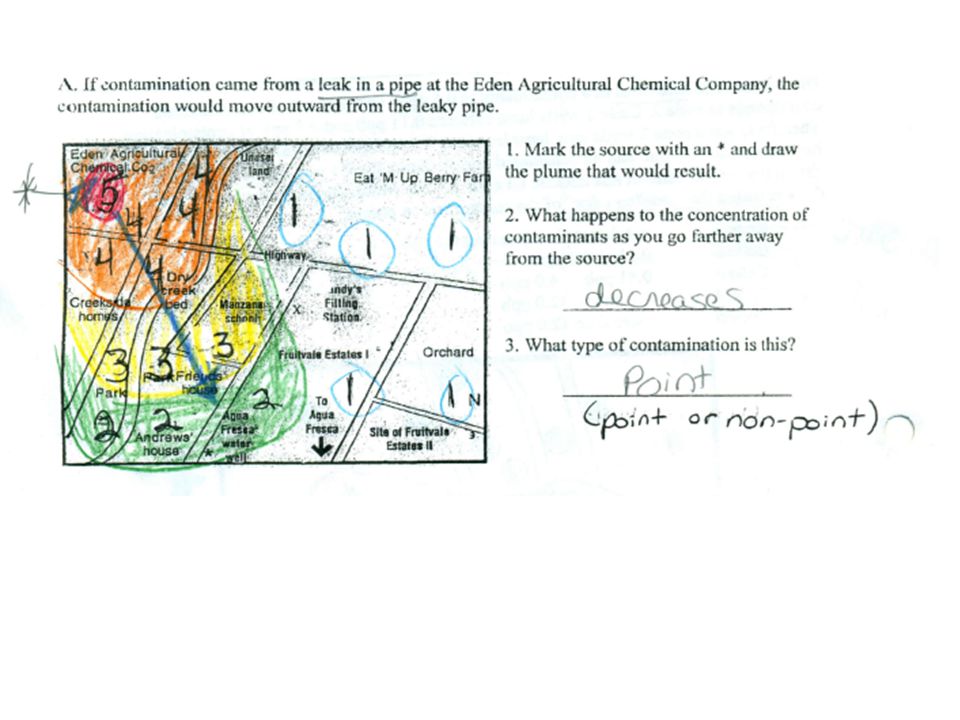
The source of the contamination will have the highest concentration

3
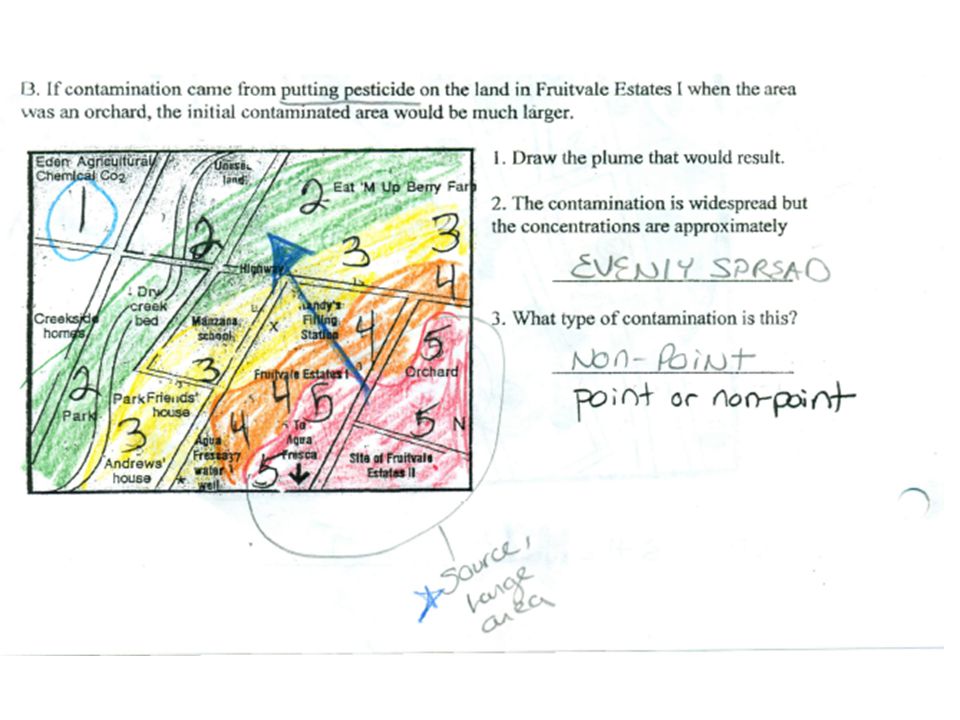
If the contamination spreads out evenly, this is non-point source contamination and no one specific spot is causing the contamination

5
If the contamination levels get lower as they move away from the source then this is know as point source pollution and one particular spot is causing the pollution.

7
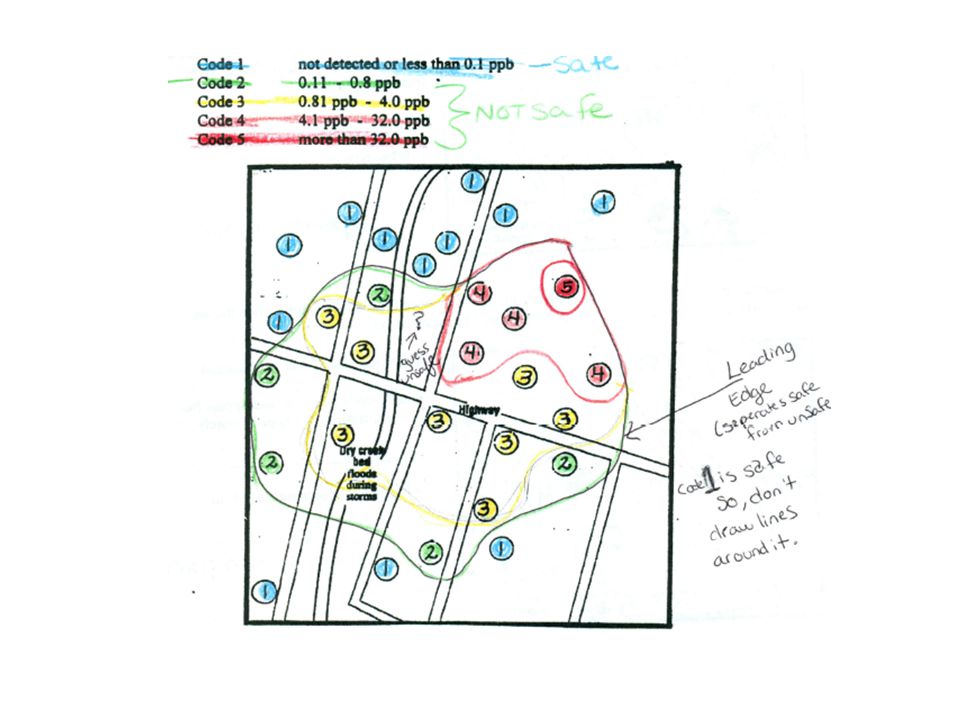
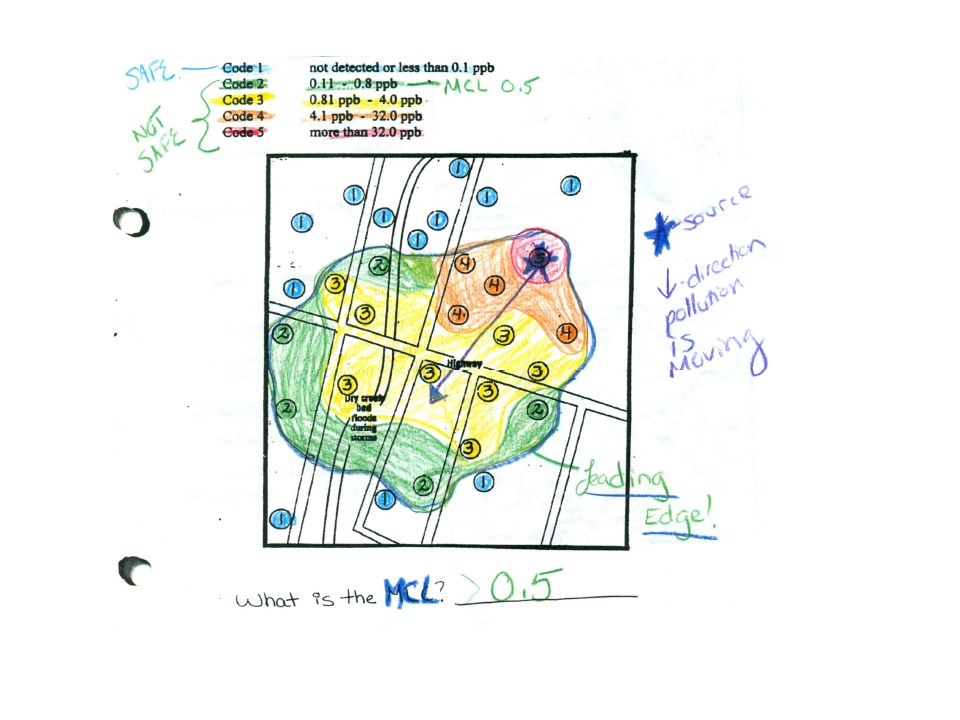
First you identify the MCL The number is a concentration expressed in ppm or ppb. It is the maximum amount that a person can be exposed to without negative effects.

8
Next, look at the key What code corresponds to the MCL? In other words, which code has the MCL in its range? Any well that has a code equal to or HIGHER than this is UNSAFE!

9
Code that have a range that contain the MCL could be contaminated or not, so we err on the side of caution and consider all wells in the code unsafe. Ex if the MCL= 0.5 ppb Code 2 = 0.11 - 0.8 ppb 0.5 ppb is in between so some code 2 wells are unsafe and others are not If I gave you a glass of code 2 water would you drink it? No….assume it is unsafe

10
color code the wells

11
a line separating the safe areas from the unsafe areas is called the leading edge

12
Now… draw a leading edge around all of the unsafe areas

14
Shade in all of the unsafe areas

16
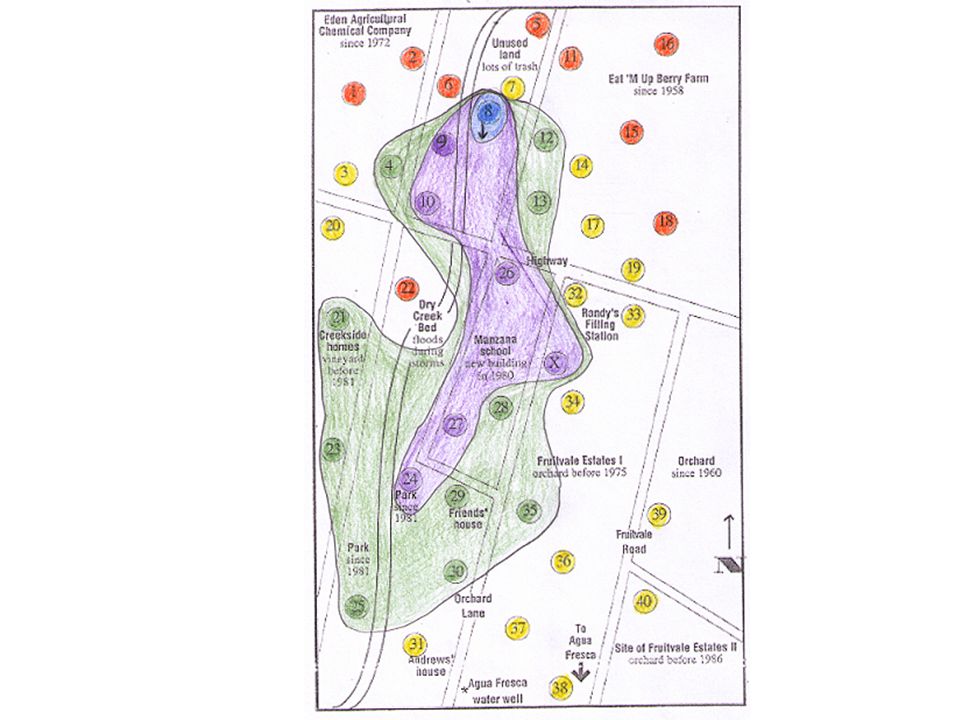
Can you see the source? The concentration will be highest at the source (star) What direction is the plume moving? From higher codes to lower codes (arrow)
 What direction is the plume moving. From higher codes to lower codes (arrow).")
18
This map is called an PLUME iso-map Iso means same Areas that are the same concentration will be connected and color coded the same color. The areas that are unsafe and shaded in is called the plume NOW DRAW THE PLUME ON YOUR FRUITVALE MAP. GO TO THE NEXT SLIDE.

19
Well data CodeWells with this code orange1, 2, 5, 6, 11, 15, 16, 18, 22 yellow3, 7, 14, 17, 19, 20, 31, 32, 33, 34, 36, 37, 38, 39, 40 green4, 12, 13, 21, 23, 25, 28, 29, 30, 35 Blue-greenX, 9, 10, 26, 27, 24 blue8

20
Remember the MCL is 1ppb. Which codes are safe? Which are unsafe? Draw your plume in PENCIL! Do Not shade in the safe areas.

Similar presentations