Download presentation
Presentation is loading. Please wait.

1
DATA ANALYSIS II MKT 525

2
CROSS-TABULATIONS-1 Numbers of Cars 1 or none2 or moreTotal Income Less than $37,50048654 = or > $37,500271946 Total7525100

3
CROSS-TABULATIONS-2 Numbers of Cars 1 or none2 or moreTotal Income Less than $37,50089%11%100% = or > $37,50059%41%100%

4
CROSS-TABULATIONS-3 Numbers of Cars 1 or none2 or more Income Less than $37,500 64%24% = or > $37,500 3676 Total 100% 100%

5
CROSS-TABULATIONS-4 Numbers of Cars 1 or none2 or moreTotal Family size 4 or less90%10%100% 5 or more23%77%100%

6
CROSS-TABULATIONS-5 Family: 4 members or less5 or more No. Cars 1 or none 2 or more 1 or none 2 or more Income: Less than $37,500 96%4%50%50% = or > $37,500 81%19% 7%93%

7
CROSS-TABULATIONS-6 Size of family: 4 or less5 or moreTotal Income: Less than $37,5004%50%11% = or > $37,500 19%93% 41%

8
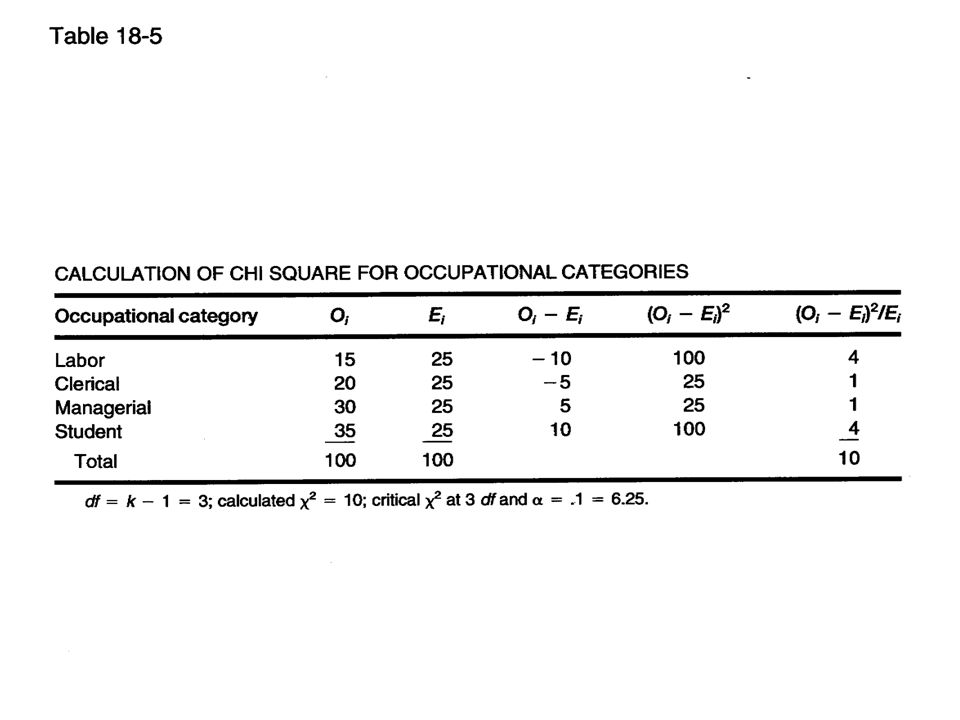
Chi Square Test Does an observed set of frequencies match an expected pattern? Requirements: –samples in cells must be independent –Expected frequency must be 5 or more SPSS: Nonparametric- chisquare-test variable- expected value

10
Chi Square: Compare Two Classifications

11
Compare means from two samples: t-test Assume the 2 samples are independent Is there a difference in number of years to pay back a home improvement loan between S&Ls and other financial institutions? S&L Other Mean years 8.7 7.7 Variance.5.6 N 100 64 t = (8.7 - 7.7)/.1175 = 8.51 At p=.05, df = n1+n2-no. groups=100+64-2=162, critical t= 1.96
/.1175 = 8.51 At p=.05, df = n1+n2-no. groups= =162, critical t=")
12
Compare proportions from two samples: t-test Do younger women use bubble baths less than older women? Women under 35 Women 35 ‑ 64 p(use bb).13.23 Std. Dev..04.04 N 144 169 Average p(use bb):weighted mean:=.184 Std. error of diff. of proportions=.0439 t = (.13 ‑.23) ‑ 0 = ‑ 2.28.0439 df = n ‑ no. gps. = 144 + 169 ‑ 2 = 311 Critical t = 1.96
 Std. Dev N Average p(use bb):weighted mean:=.184 Std. error of diff. of proportions=.0439 t = (.13 ‑.23) ‑ 0 = ‑ df = n ‑ no. gps. = ‑ 2 = 311 Critical t =")
13
SPSS Chi Square-compare two classifications: –Analyze-Descriptive Statistics -Crosstabs - Statistics-Chi square t-test -compare mean with expectation –Analyze- Compare Means - One sample t-test - test variable - test value t-test - compare independent samples –Analyze-Compare means -Independent samples- test variable-grouping variable-levels of 2 groups

14
Correlation Is there an association between two variables? If so, how strong is it? What is the form of the association? Correlation = measure of relationship between two variables

15
Correlation-2 CORRELATION DOES NOT MEAN CAUSATION! A measure of relationship; NOT a proportion! Reflects a linear relationship. Can range from -1.00 to +1.00 Correlation high if points close together when form a line and low if points are far apart when form a line. Correlation coefficient is standardized and dimensionless. Value of correlation = degree of relationship Sign of correlation = direction of relationship

16
SPSS for Correlation Both continuous: –Analyze-correlation-bivariate-enter 2 variables One dichotomous and one continuous: –Analyze-correlation-bivariate-enter 2 variables Both dichotomous: –Analyze-crosstabs-statistics-phi &Cramer’s v Both ranks: –Analyze-correlation-Spearman-enter 2 variables

17
Simple linear regression Want to predict value of one variable (DV) from another variable (IV) Y = bX + a For each unit increase in X there is a b increase in Y r 2 = coefficient of determination = proportion of variance accounted for by regression model. Relation between correlation coefficient (r) and b: b = r (s.d. y /s.d. x )
 and b: b = r (s.d. y /s.d. x ).")
18
Simple regression: SPSS Analyze- regression - linear - dependent variable name - independent (predictor) variable name
 variable name")
19
Case A baking company found a correlation of.70 between the number of persons in a HH and the consumption of bread. They also found a correlation of -.35 between HH income and bread consumption. How would you interpret these findings? How much variance in HH bread consumption is explain by a linear regression model using the number of persons in the HH as the predictor variable?

Similar presentations