Download presentation
Presentation is loading. Please wait.

2
PM-10 EMISSION INVENTORY Average of Peak PM10 Monthly Concentrations, 1998-2001 Average of 1998 to 2001 peak readings from the highest site for each month.

3
Particulate Matter is Complex In the summer and fall, about 80% of the PM problem is due to directly emitted particulates (the remainder is mostly nitrates formed in the atmosphere). Of the directly emitted particulates, about 70% is fugitive dust. The remainder of the direct particulates are smoke and internal combustion engine exhaust. In the winter, about 50% of the PM problem is due to directly emitted particulates (again, the remainder is mostly nitrates). Of the directly emitted particulates, about 60% is fugitive dust.
. Of the directly emitted particulates, about 60% is fugitive dust..")
4
SJV Air Quality Monitoring Sites

5
Agricultural Production in the San Joaquin Valley Irrigated Acres: 6.4+ million Value of Crops: $15+ billion Number of Farms: 27,000+

6
Ag Contribution to PM-10 Emission Inventory (2002) Total Annual PM-10 Emissions: 329.5 t/d Ag Contribution (24.2%): 83.5 t/d Total Mobile Sources (4.4%): 14.6 t/d Total Mobile Sources (NOx): 237.0 t/d
 Total Annual PM-10 Emissions: t/d Ag Contribution (24.2%): 83.5 t/d Total Mobile Sources (4.4%): 14.6 t/d Total Mobile Sources (NOx): t/d")
7
San Joaquin Valley Air District PM-10 Plan Website for the San Joaquin Valley Unified Air Pollution Control District: www.valleyair.org

8
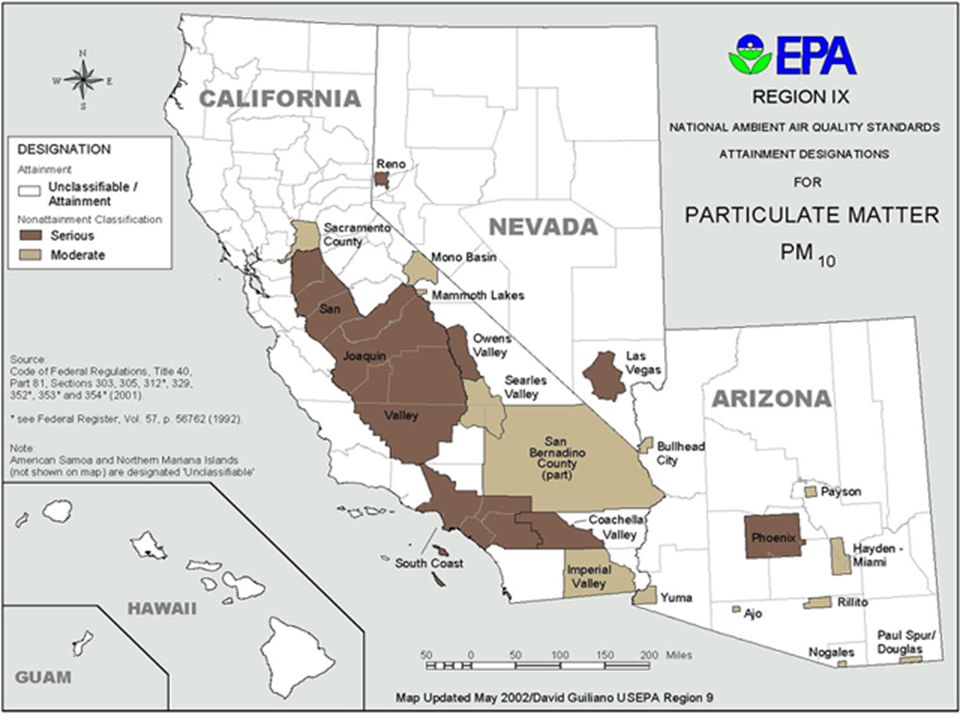
San Joaquin Valley Air District PM-10 Plan The SJV is in Extreme non-attainment for PM 10 because the Valley couldn’t meet its pollution reduction deadlines. State Implementation Plan has been written and includes new PM 10 planning requirements for agriculture to reduce dust from all sources on farms.

9
San Joaquin Valley Air District PM-10 Plan Changes that affect agriculture: 1.Senate Bill 700 removes the Ag exemption for air quality. 2.A Conservation Management Practice (CMP) Plan program has been developed and a CMP plan is required of every land owner with 100 acres or more; 6400+ farms. 3.Senate Bill 705 prohibits ag burning in 2005.
 Plan program has been developed and a CMP plan is required of every land owner with 100 acres or more; farms. 3.Senate Bill 705 prohibits ag burning in")
11
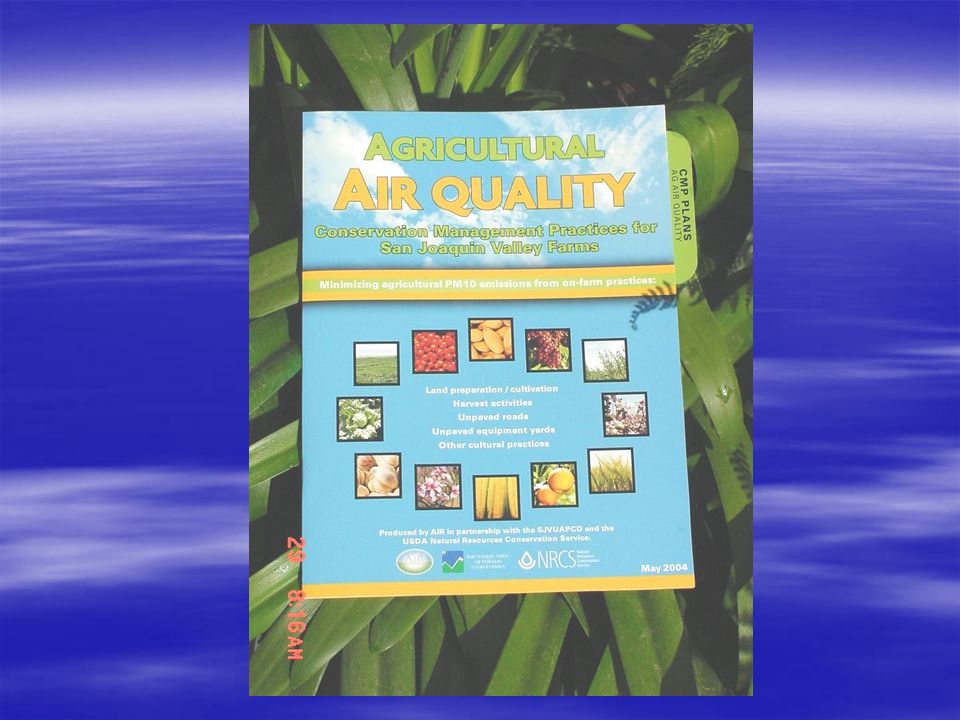
Conservation Management Practice (CMP) Plan Program Requires growers to write and adhere to an annual plan that reduces emissions from five categories of sources of dust on a farm: Requires growers to write and adhere to an annual plan that reduces emissions from five categories of sources of dust on a farm: *unpaved roads and equipment storage and traffic areas, traffic areas, *land preparation, *harvest, *windblown dust, and *burning.
 Plan Program Requires growers to write and adhere to an annual plan that reduces emissions from five categories of sources of dust on a farm: Requires growers to write and adhere to an annual plan that reduces emissions from five categories of sources of dust on a farm: *unpaved roads and equipment storage and traffic areas, traffic areas, *land preparation, *harvest, *windblown dust, and *burning.")
12
Conservation Management Practice (CMP) Program 1.Is mandatory for all farms over 100 acres. 2.Growers will have to write a bi-annually certified plan that shows how they are reducing on-field PM-10 emissions. 3.Growers have to apply at least one CMP in five categories: unpaved roads and equipment and storage areas, cultural operations, harvest operations, windblown dust, burning. 4.Concentrated Animal Feeding Operators (CAFOs) will have to include dust reduction from animal movement and manure management as well as any farming operations.
 will have to include dust reduction from animal movement and manure management as well as any farming operations..")
13
Conservation Management Practices CMPs Growers Farm Bureaus EPA Air District Commodity Groups NRCSRCDs

14
Conservation Management Practices CMPs for reducing emissions fall into several broad categories: a. Practices that reduce or eliminate the need to disturb the soil; disturb the soil; b. Practices that protect the soil from wind; c. Equipment modifications that physically produce less dust; produce less dust; d. Applying dust suppressants; e. Reducing speed on unpaved roads; f. Alternative practices to waste burning; and g. Actions that reduce pesticide application.

15
Environmental Quality Incentives Program (EQIP)
")
Similar presentations

>")


 Thompson G. Pace, PE U.S. EPA Research Triangle Park, NC.>")

 Seyed Sadredin Director of Permit Services San Joaquin Valley APCD November 4, 2003.>")


 Total Annual VOC Emissions: 413.0 t/d Ag contribution (21.2%): 87.4 t/d Total Mobile Sources (86.7%):>")


