Download presentation
Presentation is loading. Please wait.

1
Economic Growth Productivity and Competitiveness

2
explaining productivity growth What drives growth in living standards? Is it… Competitiveness (the terms of trade); Sectoral shifts; Foreign investment; Capital intensity; The New Economy; Or… Technology and innovation (Total Factor Productivity).
; Sectoral shifts; Foreign investment; Capital intensity; The New Economy; Or… Technology and innovation (Total Factor Productivity)..")
3
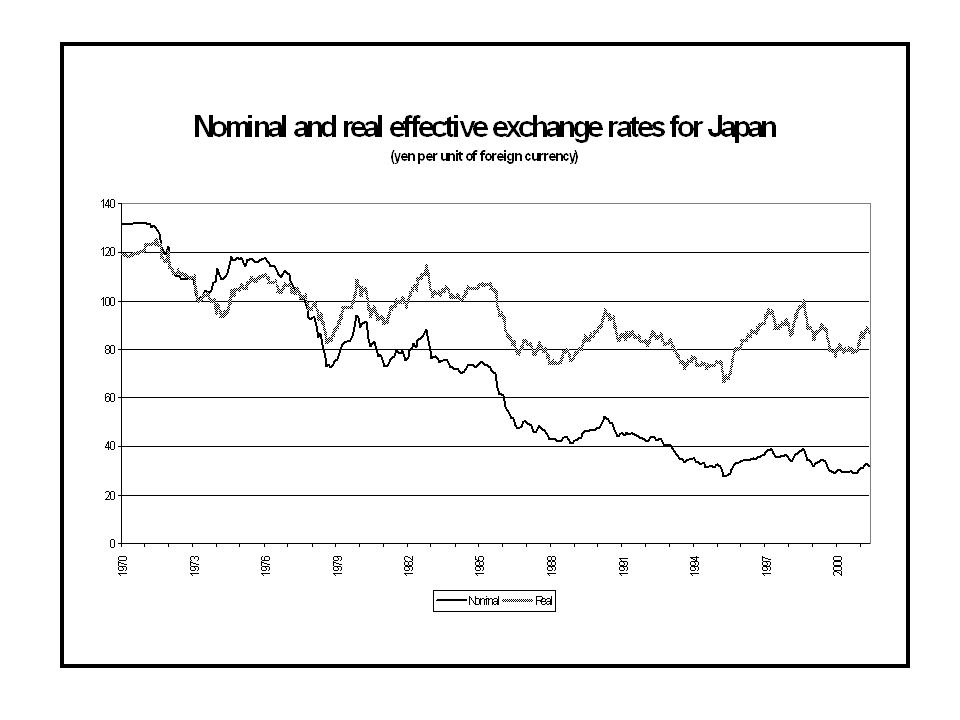
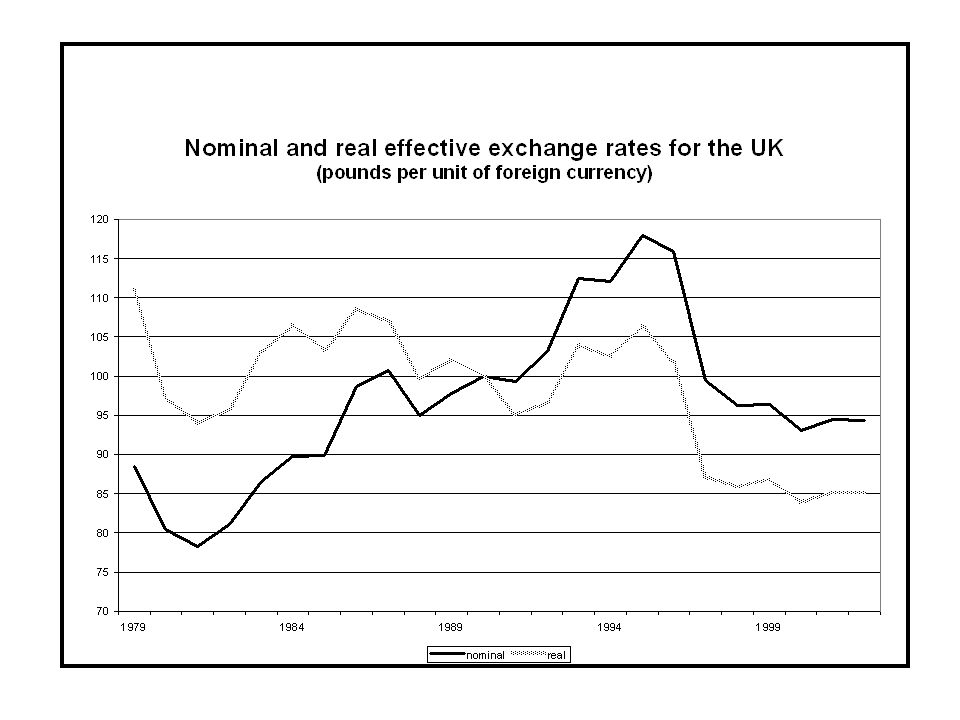
competitiveness and terms of trade The nominal exchange rate is E UK = £/$ The real exchange rate is the relative price of foreign goods in terms of domestic goods, R UK = E UK * (P w /P UK ) This can be thought of as the nominal exchange rate doubly deflated by foreign and domestic goods prices. As long as goods prices (P w and P UK ) move closely together, the nominal and real exchange rate move together. If foreign prices rise faster than domestic prices, the real exchange rate will depreciate. The terms of trade is T UK = 1/R UK = (P UK /P w )/E UK The real exchange rate (and hence the terms of trade) is determined in the long-run by relative inflation rates and by the relative supply and demand for tradeable goods. When relative Purchasing Power Parity holds, the nominal exchange rate will move to cancel out the effect of different inflation rates, leaving the real exchange rate unchanged.
 move closely together, the nominal and real exchange rate move together. If foreign prices rise faster than domestic prices, the real exchange rate will depreciate. The terms of trade is T UK = 1/R UK = (P UK /P w )/E UK The real exchange rate (and hence the terms of trade) is determined in the long-run by relative inflation rates and by the relative supply and demand for tradeable goods. When relative Purchasing Power Parity holds, the nominal exchange rate will move to cancel out the effect of different inflation rates, leaving the real exchange rate unchanged..")
4
what determines the real exchange rate? When relative PPP holds, money supply growth and hence inflation leads to changes in the nominal exchange rate, but not in the real exchange rate. When relative PPP holds, the real exchange rate reflects relative supply and demand for tradeables (the terms of trade). For example, a rise in demand for British products will cause the sterling real exchange rate to appreciate.
. For example, a rise in demand for British products will cause the sterling real exchange rate to appreciate..")
7
the terms of trade RS RD

8
export-biased growth RS RD RS’ T1T1 T2T2

9
import-biased growth RS’ RD RS T2T2 T1T1

10
an improvement in export quality RS RD RD’ T2T2 T1T1

11
technology and TFP Growth of output = weighted growth of inputs + growth of total factor productivity Growth of total factor productivity = growth of labour productivity - weighted growth of capital per worker Growth of inputs Capital and labour Materials and energy TFP is a macroeconomic measure of the level of technology. TFP rises due to innovation: Higher quality products New products Better ways to use existing inputs

12
UK manufacturing TFP growth In common with most other OECD economies, manufacturing TFP growth in the UK slowed in the 1970s (from about 2½ per cent per annum in the 1960s to about 0.2 per cent per annum between 1973 and 1979). UK manufacturing TFP experienced an increase in growth in the 1980s, attaining a growth rate of about 3 per cent per annum. Two possible explanations for the slowdown and speedup: Mismeasurement: Capital Scrapping; Labour Hoarding; Single Deflation Bias. Structural Change: Institutional Rigidities and Strong Unions in the 1970s followed in the 1980s by weakening of trade union power, withdrawal of state-subsidies, shedding of below average plants, increased subcontracting and catch-up to international best practice, along with foreign direct investment.

13
decomposition of growth in UK manufacturing

15
UK TFP relative to the USA

17
decomposition of UK growth Growth can be decomposed into two components: ‘within’ and ‘between’. The ‘within’ component shows how much is due to the growth in productivity within individual sectors of the economy; the ‘between’ component shows how much is due to movements of labour and capital between sectors of the economy.

18
share of foreign firms in UK manufacturing

19
foreign direct investment Between 1983 and 1990, the share of foreign-owned enterprises (FOEs) in UK manufacturing rose from 19 per cent to 22 per cent. In 1983, FOEs had a 35 per cent labour productivity advantage, rising to 45 per cent in 1990. However, FOEs tended to be located in high productivity sectors. If they had the same employment mix as UK firms, they would have been 24 per cent more productive in 1983, rising to 31 per cent in 1990. Nick Oulton (1997) argues that once you take into account the higher capital intensity and higher skilled workers in FOEs there is no significant difference in TFP between FOEs and UK firms (except for US owned firms which have a TFP advantage of about 10 per cent). Very little of the productivity growth in the 1980s was due to the shift towards foreign-ownership. Between 1981 and 1991, real labour productivity rose by 3.7% p.a. on average, with 3.63% p.a. accounted for by within sector growth and only 0.06% p.a. accounted for by employment shifts to FOEs. The idea that FDI is caused by differences in technology also has trouble explaining why the UK is a massive outward investor. In the 1990s, both inward and outward direct investment averaged about 1.1 per cent of UK GDP.
 argues that once you take into account the higher capital intensity and higher skilled workers in FOEs there is no significant difference in TFP between FOEs and UK firms (except for US owned firms which have a TFP advantage of about 10 per cent). Very little of the productivity growth in the 1980s was due to the shift towards foreign-ownership. Between 1981 and 1991, real labour productivity rose by 3.7% p.a. on average, with 3.63% p.a. accounted for by within sector growth and only 0.06% p.a. accounted for by employment shifts to FOEs. The idea that FDI is caused by differences in technology also has trouble explaining why the UK is a massive outward investor. In the 1990s, both inward and outward direct investment averaged about 1.1 per cent of UK GDP..")
20
the dog that didn’t bark

21
UK productivity & competitiveness When relative Purchasing Power Parity holds, movements in prices (at home and abroad) affect the nominal exchange rate but not the real exchange rate. In the long-run, the real exchange rate (and the terms of trade) are determined by relative supply and demand for tradeable goods and services. About half of the UK ‘productivity miracle’ in the 1980s was due to mis-measurement and about half was due to an improvement in the supply-side of the economy. Very little of this improvement was due to the effect of foreign direct investment, and surprisingly little was due to the changes in the relative sizes of different sectors of the economy. There is not much sign of a new economy effect on productivity in the UK as yet. In the long-run, living standards are driven by improvements in technology.
 are determined by relative supply and demand for tradeable goods and services. About half of the UK ‘productivity miracle’ in the 1980s was due to mis-measurement and about half was due to an improvement in the supply-side of the economy. Very little of this improvement was due to the effect of foreign direct investment, and surprisingly little was due to the changes in the relative sizes of different sectors of the economy. There is not much sign of a new economy effect on productivity in the UK as yet. In the long-run, living standards are driven by improvements in technology..")
Similar presentations


 A change in the money supply results in.>")

 Lecturer: Dr B. M. Nowbutsing Topic: Open economy macroeconomics.>")


