Download presentation
Presentation is loading. Please wait.

1
Mapping Science and Technology with Heterogeneous Data Analysis Tools for strategic management of innovation – Biotech.Obs Andrei Mogoutov | AGUIDEL Paris - Montreal www.aguidel.com

2
Tools for strategic management of innovation Data collection and management « Biotech » actors using online questionnaires, publications, patents, existing databases, institutional contacts, company websites, news and press releases Services/applications –Positioning of companies, projects, products, patents, publications, research fields –Startup support –Early warning –Partnership network building –Advice on local promotion –Advice on foundation and management of « clusters » –Evaluation of projects –Market and technological studies –Benchmarking, competitiveness –Consultancy for valorization actors –Communication strategy development –Academic research Software solutions: On-line applications, off-line applications, customized solutions, integration of customers data, analytical tools Data analysis: Custom methods for the analysis of complex & heterogeneous datasets, text and data mining, relational analysis, GIS, scientometrics

3
Projects & partners CEA (French Nuclear Energy Commission): Nano/Bio - clusters - Dynamics of Nano-bio-technology field. Biotech Clusters - Genopole Evry – research labs, startups & big pharma Public Health Canada: Clusters of Nanotechnologies in Canada, Obesity issues and research, Regional innovation agencies – “Technopole” Angers INSERM: Evaluation of research laboratories, strategic analysis of neurosciences research, INRA/CNRS: Mapping of controversies and research fields in genetically modified food safety McGill University: Anticancer drugs clinical trials, Microarray R&D, Cancer research worldwide, Cancer and genetics, Standardisation and Migraine research, University of Vienna: Scientometrics of Social Studies of Science Field Big International Foundations: Open Society Institute, WWF Ford foundation, McArthur's foundation, Govcom.org foundation various political, ecological and technological issues Private companies: industry, big pharma, telecoms, medical imaging Investors, business angels

4
../ANALYTICAL DIMENSIONS ANALYTICAL DIMENSIONS/DATA/METHODS/TOOLS

5
Information « Spaces » News Streams Blog Sphere Web Sites E-Communication (Mailing Lists, Forums) Scientific Information Data Bases (Publications, Patents) Offline “Literature” Press archives Surveys/ Interviews Traditional Media (TV, Radio) archives Specific Data Bases Etc ?
 Scientific Information Data Bases (Publications, Patents) Offline Literature Press archives Surveys/ Interviews Traditional Media (TV, Radio) archives Specific Data Bases Etc")
6
Traditions/Methods/Solutions Statistics / Data Mining Textual Analysis Tools / Text Mining Web Cartography Scientometrics Tools for Qualitative Data Analysis Social / Socio-Technical Networks GIS Etc.

7
Heterogeneous Data Sets: Back Office “Offline” Questionnaires Sci publications Existing Databases Press archives Online Data Collection Tools Actor Location Actor Identity Contents Classification Schema Parsing & Matching System NETWORK ORIENTED DATABASE Web Crawler Patents

8
Design of Analytical Solution Back Office - data tables - web crawler - matching tools - tools for textual analysis - tools for data update and control Front Office Middle Office - a layer of analytical queries - pre-defined queries for multilevel - data aggregation and synthetic analysis and indicators - graphical/analytical interfaces (GIS, Relational Mappings, Statistical Charts) - statistical tables, indicators and textual synthesis - integrated querying tools ON-LINEOFF-LINE DATA UPDATEFEED-BACK
 - statistical tables, indicators and textual synthesis - integrated querying tools ON-LINEOFF-LINE DATA UPDATEFEED-BACK")
9
“Online” Data Collection Tool

10
Front Office “Desktop”

11
Scientometrix – Publications and Patents PubMed (Medline) ISI Derwent
 ISI Derwent")
12
/Scientometrics/results (ReseauLu Sci_Metrix) 1 1010 100100 10 00 19841984 19851985 19861986 19871987 19881988 19891989 19901990 19911991 19921992 19931993 19941994 19951995 19961996 19971997 19981998 19991999 20002000 20012001 20022002 20032003
")
13
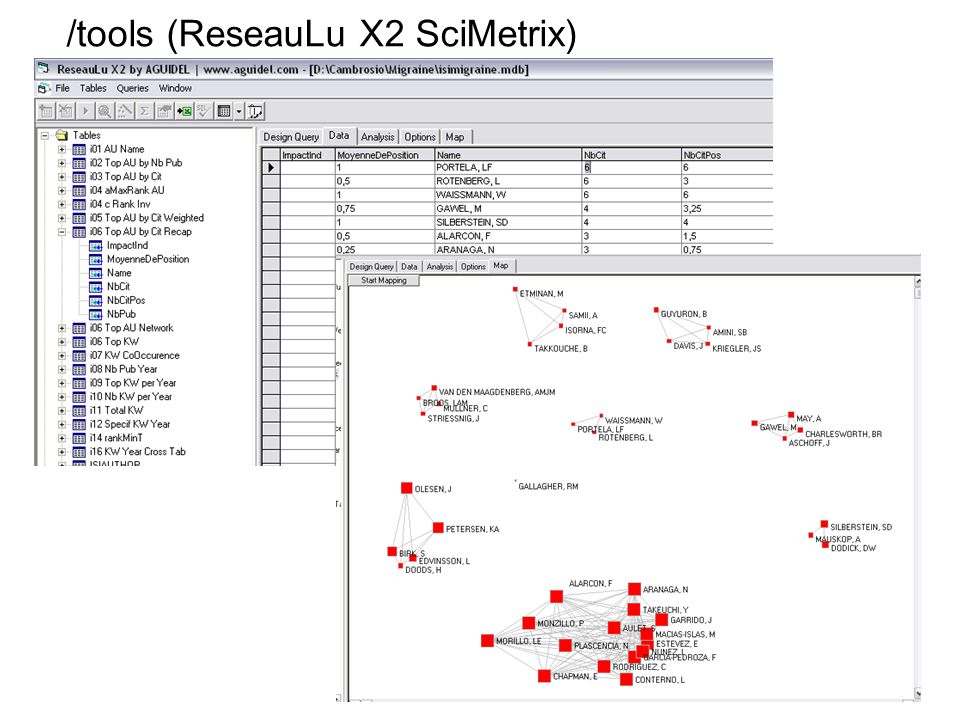
/tools (ReseauLu X2 SciMetrix)
")
15
../Stem Cells - Counts

16
STEM CELLS - AUTHORS NameNb Pub WEISSMAN, IL45 ZSEBO, KM26 ORKIN, SH26 OGAWA, M25 GAGE, FH24 JAENISCH, R22 BRADLEY, A22 ROSSANT, J22 MOORE, MAS21 EAVES, CJ21 WILLIAMS, DA19 LANSDORP, PM19 NISHIKAWA, S18 MULLIGAN, RC18 SMITHIES, O18 HUMPHRIES, RK16 ALT, FW16 DICK, JE16 MAK, TW15 DEXTER, TM15 ARMITAGE, JO15 RAJEWSKY, K14 MORRISON, SJ14

17
Stem Cells Co-Citation

18
STEM CELLS – Collaboration networks

19
STEM CELLS – International Collaboration

20
STEM CELLS – Emerging themes

21
Scientometrix: Early Warning: Strategic Diagrams of Research Community Evolution: biosafety research

22
Heterogeneous Networks Companies & Technologies Scientometrix/ Adds Heterogeneous Networks Companies & Technologies

23
Actor/Networks Scientometrix / Adds: Actor/Networks Pharma Group I Central, Star-like hierarchical networks Pharma Group II Less central, Less hierarchical Platform Tech. Companies Clique-like, complex networks

24
Scientometrix /GIS Spatial Network - Collaboration between Nano- Biotech Clusters

25
Space Biotech Clusters Scientometrix /GIS Space Biotech Clusters Boston Region

26
Space Nano-Biotech Clusters Scientometrix /GIS Space Nano-Biotech Clusters

27
Scientometrix /GIS – Zooming In Canadian Nano-Bio publications by province and by discipline

28
Scientometrix /GIS – Zooming In Number of publications by type, Montreal region

29
Scientometrix /GIS – Zooming In Sub-clusters of the Montreal region, Note the Bio/medicine sub cluster in Laval.

30
Web Cartography III IssueCrawler Project – GovCom.Org, Amsterdam (R Rogers et al)
")
31
Technology transfer: Industrial Partners of INSERM

32
Industrial partners of INSERM: Emerging domains

33
INSERM: international Collaboration

34
Technologies & Companies

35
Network in Time

36
News The North Korean English News Space, Sept. 15 – Nov. 15, 2003. Findings: Whitehouse.gov (press release) couches North Korea in terms of regime change and human rights. The only other outlet that does so is Frontpagemag.org, a site which at the time of this map, extolled surfers to sign and e-petition and help “Stop the Left’s Anti-American Agenda… Help expose terrorists in our midst>” Connecting regime change to war is done by Fox News, Newsweek, and Asia Times online. Thus it is clear that these media outlets are framing regime change in terms of military conflict. Regime Change and Reunification are, basically, disconnected. Thus there is little talk of a German model achievement of Regime Change. The Financial Times subscription service, a strong example of the corporate angle on the issue, presented North Korea only in terms of regime change, notably isolating the issue from conflict, reunification, famine and other issues. Only CNN is able to connect famine and reunification, one of the more practical and meaningful associations between the issues of import in the peninsula. This finding defies conventional wisdom which would have CNN less informed by the stance of regionally located English media outlets.
 couches North Korea in terms of regime change and human rights. The only other outlet that does so is Frontpagemag.org, a site which at the time of this map, extolled surfers to sign and e-petition and help Stop the Left’s Anti-American Agenda… Help expose terrorists in our midst> Connecting regime change to war is done by Fox News, Newsweek, and Asia Times online. Thus it is clear that these media outlets are framing regime change in terms of military conflict. Regime Change and Reunification are, basically, disconnected. Thus there is little talk of a German model achievement of Regime Change. The Financial Times subscription service, a strong example of the corporate angle on the issue, presented North Korea only in terms of regime change, notably isolating the issue from conflict, reunification, famine and other issues. Only CNN is able to connect famine and reunification, one of the more practical and meaningful associations between the issues of import in the peninsula. This finding defies conventional wisdom which would have CNN less informed by the stance of regionally located English media outlets..")
Similar presentations


 Lars H. Backer>")
 Focuses on research of the coupled dynamics of social- ecological systems (SES) and the translation of.>")

>")


