Download presentation
Presentation is loading. Please wait.

1
Ecology Ecology is the study of how organisms interact with each other and with their environment Structure Function Structure includes the distribution and abundance of organisms; Function includes how populations grow and interact

2
Ecology Biotic = Living
Examples: Predation, competition, reproduction (mating) Abiotic = Non-living (Energy & Inorganic) Examples: Temperature, pH, light, water, nutrients Others? Biotic: Prey, parasitism, disease CO2, O2,
 Abiotic = Non-living (Energy & Inorganic) Examples: Temperature, pH, light, water, nutrients. Others Biotic: Prey, parasitism, disease. CO2, O2,")
3
Levels of Ecological Organization
Populations Communities Ecosystems The nature of the community is determined by… Combo of genes – a sample of the population’s total genetic information

4
Levels of Ecological Organization: Population
A group of individuals of the same species living together in one area; interbreeding The nature of the community is determined by… Combo of genes – a sample of the population’s total genetic information

5
Levels of Ecological Organization: Population
A group of individuals of the same species living together in one area; interbreeding The nature of the community is determined by… Combo of genes – a sample of the population’s total genetic information

6
Levels of Ecological Organization: Community
Populations of different species living together in one area; naturally-occurring (e.g., tide pools, ponds, grassland meadows, forest canopy, fallen log, etc)
")
7
Levels of Ecological Organization: Ecosystem
Communities and non-living components of the environment in which they interact Energy and nutrents in one find their way to another, so that ultimately all parts of Earth are interrelated in one whole. E.g. stream ecosystem is strongly influenced by the terrestrial ecosystem through which it flows

8
Population Structure Population size – number of individuals
Population density – number of individuals per unit space (area) Population dispersion – how individuals are distributed e.g. US census
 Population dispersion – how individuals are distributed. e.g. US census.")
9
Population Size Number of individuals
Affects population’s ability to survive Too small – population more likely to go extinct Too large – increased competition (may be bad for individuals but can lead to natural selection!)
")
10
Population Density Number of individuals per unit area
Affects population’s ability to survive Too dense – increased competition (e.g., for resources, food, mates), can lead to reduced fitness, increased potential for disease Too sparse – can be problematic; must find mates! Also, there is safety in numbers, can lead to increased predation Alee affect
, can lead to reduced fitness, increased potential for disease. Too sparse – can be problematic; must find mates! Also, there is safety in numbers, can lead to increased predation. Alee affect.")
11
Population Distribution
How individuals are distributed Nature is patchy! Differences in light, moisture, temperature, wind, etc. exist within a given ecosystem Distribution may be random, uniform, or clumped

12
Random Random – position of each individual is independent of the others Dispersal depends on resource distribution Not common in nature Occurs when individuals do not interact strongly with each other and when they are not affected by nonuniform aspects of their environment; e.g. some species of trees in Panamanian rain forests

13
Uniform Uniform – individuals are evenly spaced
Usually a result of competition for resources Spacing is frequently accomplished by territorial behavior

14
Uniform Example: The uniform distribution of cactus resulting from allelopathy Allelopathy = particular form of interference competition among plants and animals; production and release of chemical substance by one species which inhibits the growth and development of another species; Corals do this too!

15
Clumped Clumped – individuals are aggregated in patches
Occurs frequently in response to uneven distribution of resources Common in nature Many advantages Common because individual animals and plants tend to occur in habitats defined by distinct soil type, moisture, or other aspects of the environment in which they are best adapted

16
Clumped Social interactions may also lead to clumped distribution
Safety in numbers Shared knowledge of others in group Decreased energy in movement Other advantages? (e.g., flock of birds, herd of bison, pride of lions) Common because individual animals and plants tend to occur in habitats defined by distinct soil type, moisture, or other aspects of the environment in which they are best adapted
 Common because individual animals and plants tend to occur in habitats defined by distinct soil type, moisture, or other aspects of the environment in which they are best adapted.")
17
Metapopulation A network of distinct populations that interact with one another by exchanging individuals (immigration and emigration) May prevent long-term extinction Source-sink metapopulations – population in better-suited habitats (source) disperse new individuals to populations in poorer habitats (sink) Marine protected habitats; Whales? Prevent extinction by colonization of empty patches; dispersal; ex: if one patch experiences an endemic disease, etc
 disperse new individuals to populations in poorer habitats (sink) Marine protected habitats; Whales Prevent extinction by colonization of empty patches; dispersal; ex: if one patch experiences an endemic disease, etc.")
18
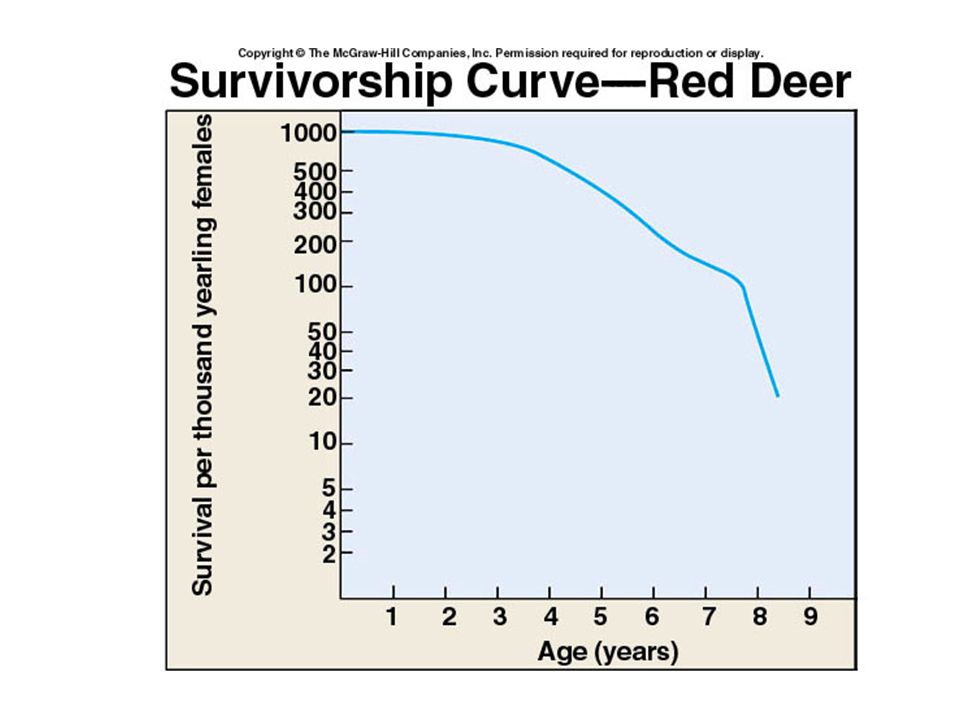
Population Dynamics Survivorship – percentage of original population that survives to a given age Survivorship Curve – a graphical representation of the survivorship at each age Depicts age-specific mortality through survivorship Type I, II, and III

19
Survivorship Curves Plots the number of individuals of a particular age cohort against time Compares populations of one area, time, sex, or species with populations of another Three types of curves: Types I, II, and III

20
Survivorship Curve – Type I
Convex Typical of populations whose individuals tend to live out their physiological life span (high degree of survival at all ages, but experience heavy mortality at the end of their life span) Examples – Red Deer, Humans, Annual Phlox (flowering plant) Plant ornamental, native to southeast US,
 Examples – Red Deer, Humans, Annual Phlox (flowering plant) Plant ornamental, native to southeast US,")
22
Survivorship Curve – Type II
Linear Typical of organisms with constant mortality rates (mortality does not change with increasing or decreasing age) Examples – adult stages of many birds, rodents and some plants
 Examples – adult stages of many birds, rodents and some plants.")
23
Survivorship Curve – Type III
Concave Typical of organisms with extremely high mortality in their early stages of life Examples – many species of invertebrates, fish, some plants

24
Survivorship Curve – Type III

25
Survivorship Curves

26
Population Growth Populations typically maintain a constant size regardless of how many offspring are born No matter how rapidly populations may grow, they eventually reach their carrying capacity (K) – the maximum number of individuals that the population can support Limits include shortages of water, habitat, light, nutrients, etc.
 – the maximum number of individuals that the population can support. Limits include shortages of water, habitat, light, nutrients, etc.")
27
Population Growth The rate of population growth (r) is defined as the difference between the birthrate (b) and the death rate (d) and corrected for the movement of individuals into (i) and out of (e) the population Population growth (r) = (b - d) + (i – e)
 is defined as the difference between the birthrate (b) and the death rate (d) and corrected for the movement of individuals into (i) and out of (e) the population. Population growth (r) = (b - d) + (i – e)")
28
Population Growth Biotic potential – the rate at which the population will increase when no limits are placed on its rate of growth Defined as: dN/dt = riN N = number of individuals in the population dN/dt = the rate of change in its numbers over time ri = the intrinsic rate of natural increase for the population (intrinsic = innate, belonging to something by its very nature)
")
29
Population Growth Biotic potential is exponential; the rate of increase remains constant, the actual number of individuals accelerates rapidly as the size of the population grows Result of unchecked exponential growth is a population explosion Brown tree snake on Guam – eliminated native bird populations; remaining birds extremely patchy in distribution – essentially extinct Castaway in military cargo after WWII from Papua New Guinea – unsure of exact means; only other snake on the island (native) feeds on termites, does not impact bird or human populations
 feeds on termites, does not impact bird or human populations.")
30
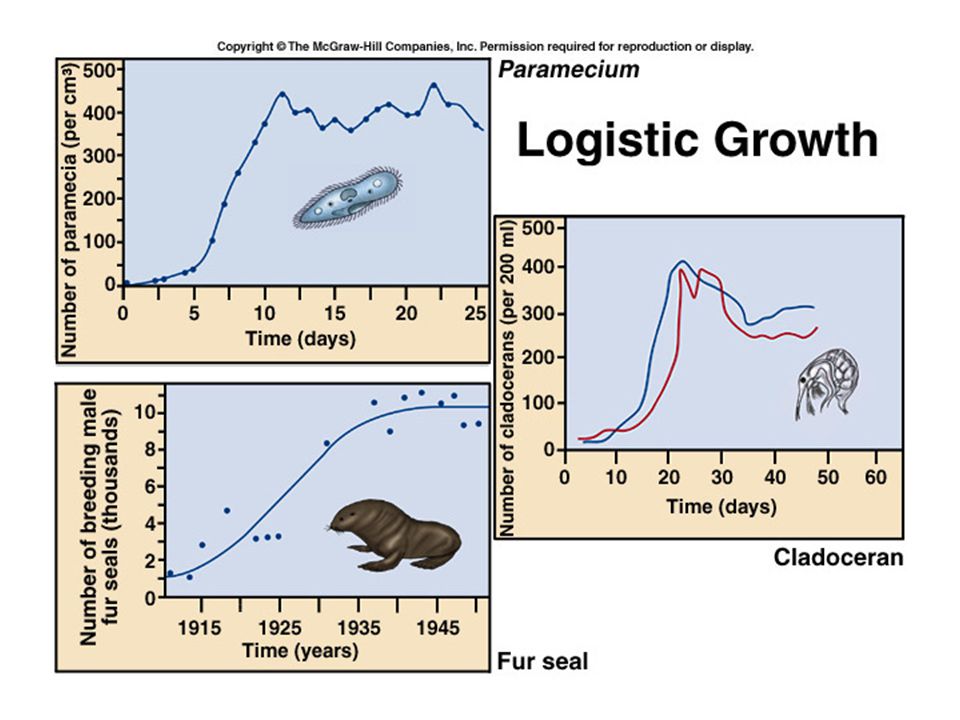
Population Growth As a population approaches its carrying capacity, its rate of growth slows Logistic growth equation: dN/dt = rN ((K – N)/ K) dN/dt = the growth rate of the population r = the intrinsic rate of increase N = the number of individuals present at any given time (K – N)/K = the unused carrying capacity Because fewer resources remain for each new individual to use; can be explained by… The growth rate of the population (dN/dt) is equal to its intrinsic rate of increase (r) multiplied by the number of individuals present at any given time (N), and adjusted for the amount of resources available by multiplying by the fraction of K, the carrying capacity still unused The growth rate of the population is equal to its intrinsic rate of increase, r, multipled by the number of individuals present at any given time, N, and adjusted for the amount of resources available by multiplying by the fraction, K – the carrying capacity still unused
/ K) dN/dt = the growth rate of the population. r = the intrinsic rate of increase. N = the number of individuals present at any given time. (K – N)/K = the unused carrying capacity. Because fewer resources remain for each new individual to use; can be explained by… The growth rate of the population (dN/dt) is equal to its intrinsic rate of increase (r) multiplied by the number of individuals present at any given time (N), and adjusted for the amount of resources available by multiplying by the fraction of K, the carrying capacity still unused. The growth rate of the population is equal to its intrinsic rate of increase, r, multipled by the number of individuals present at any given time, N, and adjusted for the amount of resources available by multiplying by the fraction, K – the carrying capacity still unused.")
32
Two Models of Population Growth

34
Human populations exhibit exponential growth
Substantial growth occurred following the industrial revolution (late 1800’s) despite major ‘collapses’ in earlier history … which significantly lowered the death rate
 despite major ‘collapses’ in earlier history. … which significantly lowered the death rate.")
35
Limits to Population Growth
Resource limitation Food, Habitat Predation Parasitism, Disease Anthropogenic Impacts – invasive species, habitat destruction, pollution, hunting How about a little exercise???

36
Community Ecology Study of interactions among populations Niche
the functional role of a species in the community, including activities and relationships total of all the ways an organism uses resources in its environment Food consumption, space utilization, temperature range, etc An organisms place and function, not to be confused with Nitzche

37
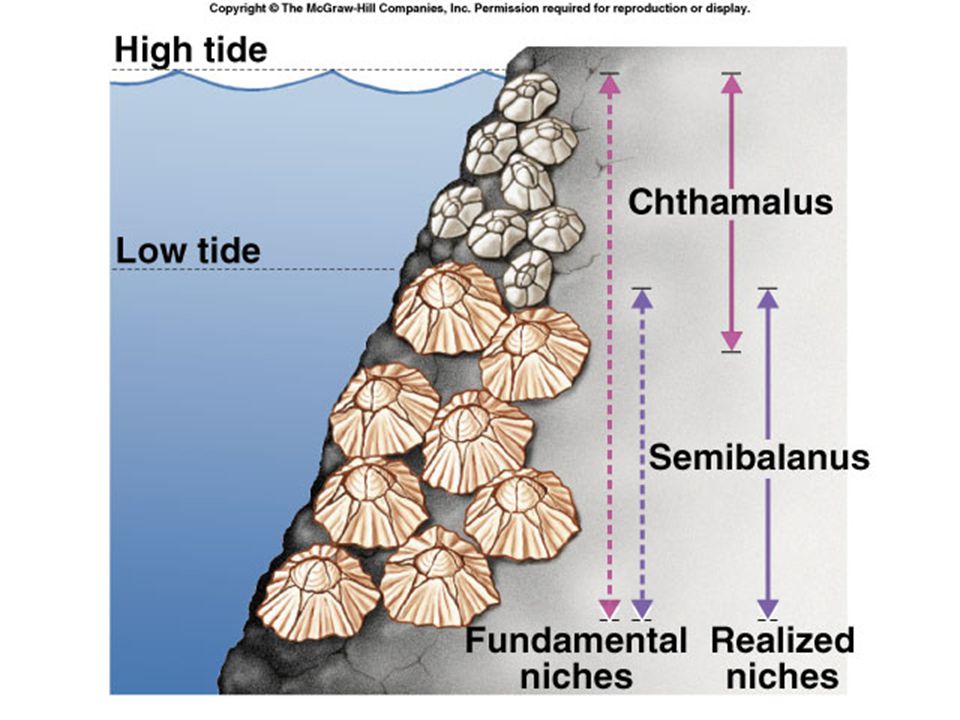
Fundamental and Realized Niche
Fundamental niche – the entire niche that a species is capable of using, based on its physiological tolerance limits and resource needs Realized niche – the actual set of environmental conditions, including the presence or absence of other species, in which the species can establish a stable population

38
Community Ecology Habitat Physical location
Provides shelter, food, places of rest May involve imprinting – a form of associative learning linking individuals to their place of birth or seasonal range

39
Competition Struggle between organisms to utilize the same resource when the resource is limited Can occur between species or within species Especially strong when niches overlap Can restrict the niche of species (and lead to natural selection…)
")
40
Competition Interference competition – physical interactions over access to resources

41
Competition Examples of competition: Fighting to defend territory
Displacing an individual from a particular location A fraction of individuals obtain all the resources they need; the remaining individuals get less and produce no offspring, or die Usually aggressive in animals Shading of vegetation, production of toxins in addition to consumption/use of resources

42
Interspecific Competition
Interspecific competition – occurs when 2 different species attempt to use the same resource, and there is not enough of the resource to satisfy both Cheetahs and lions for example – niche overlap, lions eat food killed by cheetahs

43
Competition Intraspecific competition – competition within a species
Elephant seal harems, Grasshoppers, trees

45
Competition for niche occupancy
Classic study of barnacles by J.H. Connell Scotland coast Semibalanus balanoides inhabits deeper water (lower level of substrate); Chthamalus stellatus inhabits shallower water (higher level of substrate) S. balanoides not usually exposed to air; C. stellatus frequently exposed to air at low tide In the deeper zone S. balanoides can always outcompete C. stellatus
; Chthamalus stellatus inhabits shallower water (higher level of substrate) S. balanoides not usually exposed to air; C. stellatus frequently exposed to air at low tide. In the deeper zone S. balanoides can always outcompete C. stellatus.")
46
Competition for niche occupancy
When S. balanoides were removed, C. stellatus was capable of occupying the deeper zone When C. stellatus was removed, S. balanoides was NOT capable of occupying the shallow-water habitat (exposure to air, higher temperatures) Functional niche of C. stellatus includes shallow and deeper water Functional and realized niche of S. stellatus identical Realized niche of C. stellatus much narrower because can be outcompeted by S. balanoides
 Functional niche of C. stellatus includes shallow and deeper water. Functional and realized niche of S. stellatus identical. Realized niche of C. stellatus much narrower because can be outcompeted by S. balanoides.")
47
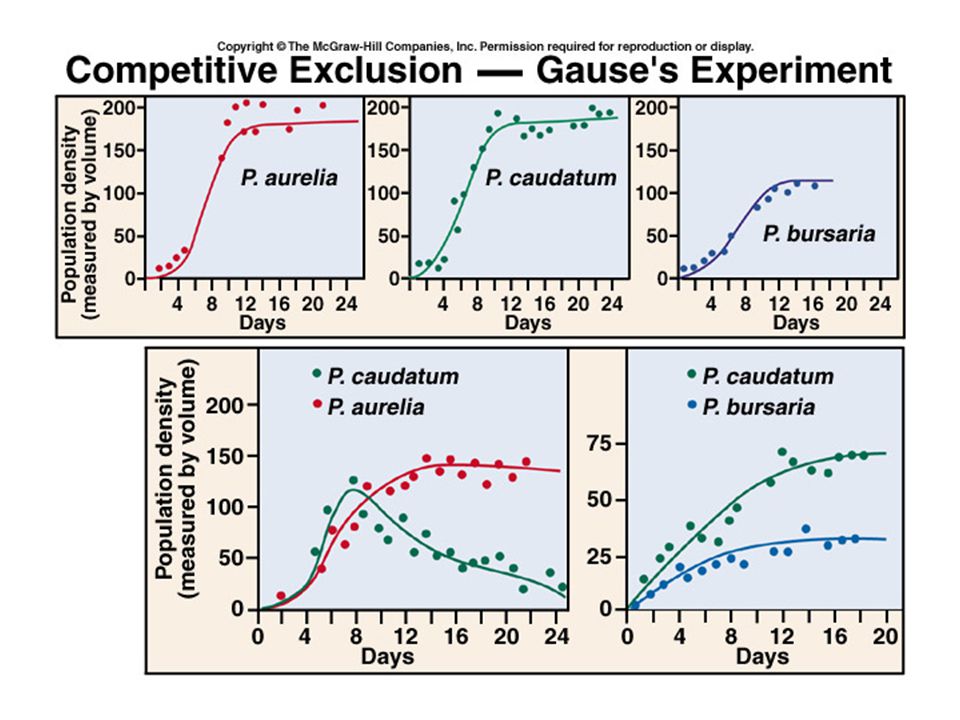
Competitive Exclusion
Principle of Competitive Exclusion – when two or more species coexist using same resource, one must displace or exclude the other Hypothetical Gradients exist within any (shared) habitat; fundamental niches may overlap, but realized niches may differ Usually detrimental to both species over long term
 habitat; fundamental niches may overlap, but realized niches may differ. Usually detrimental to both species over long term.")
49
Competition Niche overlap can lead to
Resource partitioning – the differentiation of niches that enables two similar species to coexist within a community Character displacement – the tendancy for characteristics to be more divergent in sympatric populations of two species than in allopatric populations of the same two species Hereditary changes evolve that bring about resource partitioning

50
Resource Partitioning
Anoles lizards on Caribbean islands Copyright © 2002 Pearson Education, Inc., publishing as Benjamin Cummings

51
Character Displacement
Allopatric species – species that do not occur together Sympatric species – species occur together Example – Darwin’s finches

52
Character Displacement
Niche overlap drives natural selection! Brought about by selective effects of competition Differences among species are accentuated where they co-occur Can lead to sympatric speciation!

53
Predation Predation – one living organism serves as a food source for another Prey evolves defenses, predators evolve adaptations to overcome prey defenses, prey evolves further, and so on…. An arms race ensues (and is in constant motion)
")
54
Predation Plant defenses against herbivores (and visa versa)
Morphological: thorns, spines, plant hairs Chemical: Secondary compounds (allelopathy) Green caterpillars of the cabbage white butterfly; mustard oils protect plant against most herbivores, caterpillars are able to break down the compounds
 Green caterpillars of the cabbage white butterfly; mustard oils protect plant against most herbivores, caterpillars are able to break down the compounds.")
55
Predation Animal defenses against predators
Behavioral: Fleeing, Hiding, Self-defense, Noises, Mobbing, “Flight or fight” Physical: Camouflage – cryptic coloration, deceptive markings Mechanical: includes spines and shells Chemical: Odors and toxins

56
Behavioral defenses

57
Physical defenses Physical – Camouflage (Pygmy seahorses)
")
58
Physical defenses Physical – Camouflage (Shrimp fish, cryptic frog, walking sticks)
")
59
Camouflage continued…
Camouflage may occur seasonally (arctic fox, ermine, hare)
")
60
Physical - Disruptive markings
Add zebra and polar bear

61
The Superstar of them all, the Mimic Octopus!

62
Mechanical defenses

63
Chemical defenses Chemical – may be incorporated from food they eat (milkweed and monarch butterfly)
")
64
Predation Aposematic coloration – warning indicated by coloration, anti-predator adaptation to advertise toxins Toxins don’t do you any good if you have to get eaten first! Sometimes warning is of unpalatability, and other times depicts danger Skunks advertise too!

65
Aposematic coloration

66
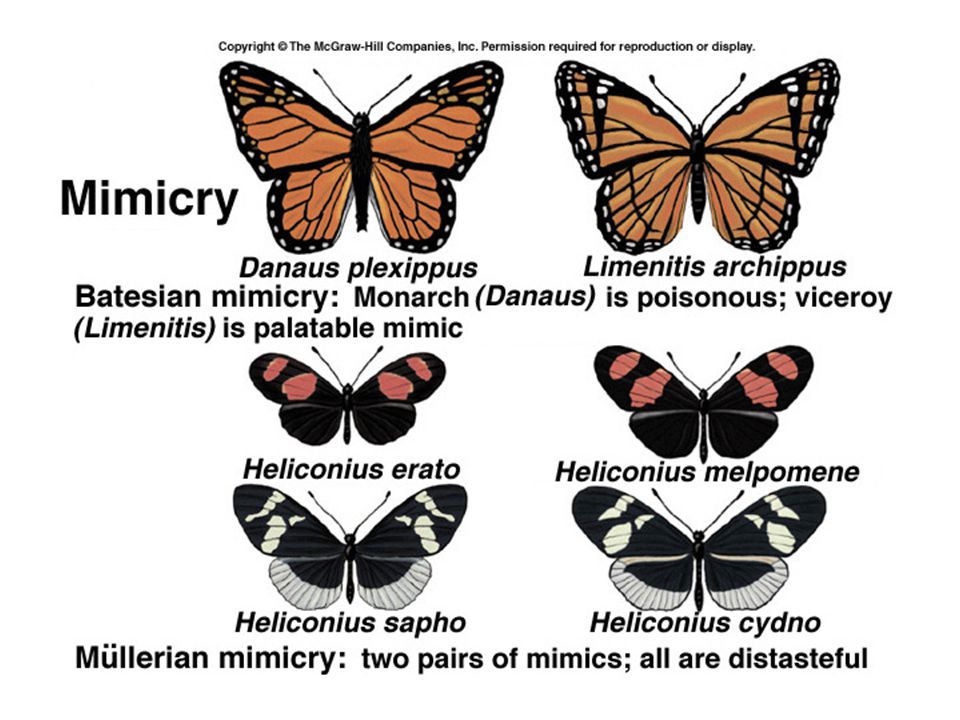
Mimicry Batesian mimicry – a mimicry system in which palatible organisms mimic the morphological characteristics of (an often unrelated) noxious species Named for Henry Bates; English naturalist who observed many mimics in Amazon Scarlet king snake – red on black, won’t hurt jack; red on yellow, kill a fellow
 noxious species. Named for Henry Bates; English naturalist who observed many mimics in Amazon. Scarlet king snake – red on black, won’t hurt jack; red on yellow, kill a fellow.")
67
Mimicry Toxic species must not kill predator
Predator must remember negative encounter and learn from the experience Mimics must overlap geographically with toxic species Scarlet king snake – red on black, won’t hurt jack; red on yellow, kill a fellow

68
Mimicry Monarch and Viceroy butterflies – Monarch caterpillars feed on milkweed (toxic plant); incorporate toxins into body; Viceroy mimics
; incorporate toxins into body; Viceroy mimics.")
70
Mimicry Müllerian mimicry – when two or more unpalatable species resemble each other All organisms are toxic and converge upon a common morphological warning system Minimizes losses by predation (predators have memory)
")
71
Predation Can promote species diversity (drives natural selection)
Predator feeds on superior competitor; most successful organism will be most abundant, predators will often select the most abundant prey, especially in plants Return of wolves to Yellowstone restored native vegetation, which benefits the elk population!

72
Predation Predation reduces competition
Without predators, sick and weak individuals of the population will survive May pass on (weak) characteristics to offspring reducing fitness potential of the gene pool
 characteristics to offspring reducing fitness potential of the gene pool.")
73
Predation Keystone species – a species that has a disproportionate effect on its environment relative to its abundance Plays a critical role in its ecosystem by maintaining the structure of the ecological community

74
Predation Keystone species – Sea otter

75
Keystone Species – Sea Otter

76
Coevolution and Interspecific Interactions
Coevolution – reciprocal evolutionary adaptations of two interacting species When one species evolves, it exerts selective pressure on the other to evolve to continue the interaction May occur within species – if a female selects a male with an extreme characteristic, selection will fuel development of characteristic – may be detrimental! Peacock tail

Similar presentations