Download presentation
Presentation is loading. Please wait.

1
25 Years of HIV – Africa and beyond Carol Ciesielski, MD
Centers for Disease Control and Prevention Chicago Dept of Health

2
Simian Immunodeficiency Virus (SIVcpz )
Origins of HIV-1 Simian Immunodeficiency Virus (SIVcpz ) HIV-1 1930s Leap to Humans
 HIV s. Leap to Humans.")
3
Origins of HIV-1 HIV remained unnoticed in isolated populations.
In 1960s-70s; changing social structures, migrations to cities from rural areas, building roads, commercial trucking, wars, jobs far from home. Transmission amplified by urbanization: reuse of needles in health care settings, sex workers along truck routes, job migrations 1930s –leap to human from chimpanzees ~ 1st human case from Kinshasa 1959

4
Already 30% gay men in San Francisco HIV+

5
Leading causes of death globally, 2001
Rank % of total 1 Ischaemic heart disease 2 Cerebrovascular disease 3 Acute lower respiratory infections 4 HIV/AIDS 5 Chronic obstructive pulmonary disease 6 Perinatal conditions 7 Diarrhoeal diseases 8 Tuberculosis 11 Malaria 12.7 9.9 7.1 4.8 4.2 4.0 3.0 1.9 Source: The World Health Report 2000, WHO

6
HIV Transmission Sexual: Blood: blood or blood/tissue products
Heterosexual ♂♀ >> ♀ ♂ Male to male Blood: blood or blood/tissue products Injection drug use Medical injections Perinatal (Vertical): mother to child
: mother to child.")
7
Highest Risk Populations
Men who have Sex with Men (MSM) Injecting Drug Users Sex workers and their clients Concentrated vs generalized epidemics Concentrated (low level) HIV concentrated in high risk groups Generalized - >1% of population HIV+; HIV penetrated into general population (mostly heterosexual spread)
 Injecting Drug Users. Sex workers and their clients. Concentrated vs generalized epidemics. Concentrated (low level) HIV concentrated in high risk groups. Generalized - >1% of population HIV+; HIV penetrated into general population (mostly heterosexual spread)")
8
Sexual Transmission Accounts for ~ 75% of infections worldwide
Probability of infection through sexual contact lower than through other routes Infectiousness and duration of infectiousness important in epidemic spread 1

9
Factors Facilitating HIV Pandemic
Long Period between Infection and Symptoms (average years) Individual: long period of silent infection & infectivity Community: Prevalence >> incidence resulting in an insidious epidemic HIV persists for life time of human host
 Individual: long period of silent infection & infectivity. Community: Prevalence >> incidence resulting in an insidious epidemic. HIV persists for life time of human host.")
10
Global Spread ~65 million persons have been infected
~25 million deaths

11
Global HIV Epidemic, 2005

12
HIV Prevalence -# of persons HIV infected (38.6 million)
HIV Incidence (Number of new infections each year) HIV related deaths 4.1 million 2.8 million
 HIV related deaths. 4.1 million. 2.8 million.")
13
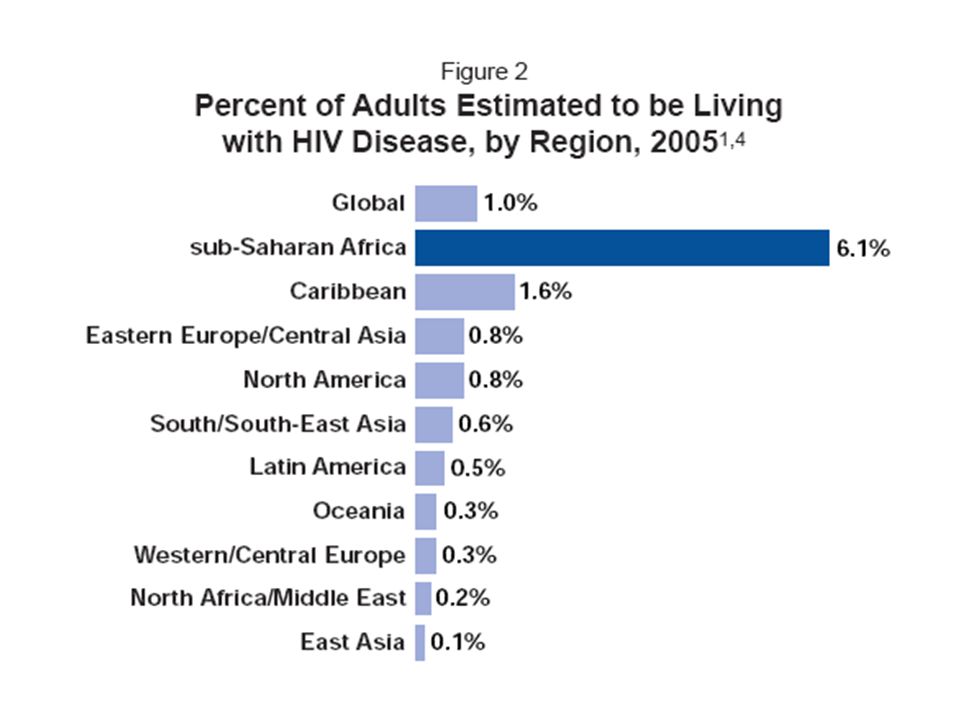
Estimated HIV prevalence in Adults,by Global Region (2005)
HIV cases Epidemic (estimate) began Australia, Europe, N America million s, 80s Latin America, Caribbean million s, 80s Africa million s,80s Asia million late 1980s Eastern Europe million s Global Total million
 began. Australia, Europe, N America 2.0 million 1970s, 80s. Latin America, Caribbean 2.0 million 1970s, 80s. Africa 24.5 million 1970s,80s. Asia 8.3 million late 1980s. Eastern Europe 1.5 million 1990s. Global Total 38.6 million.")
17
A Global View of HIV Infection 38.6 million people living with HIV
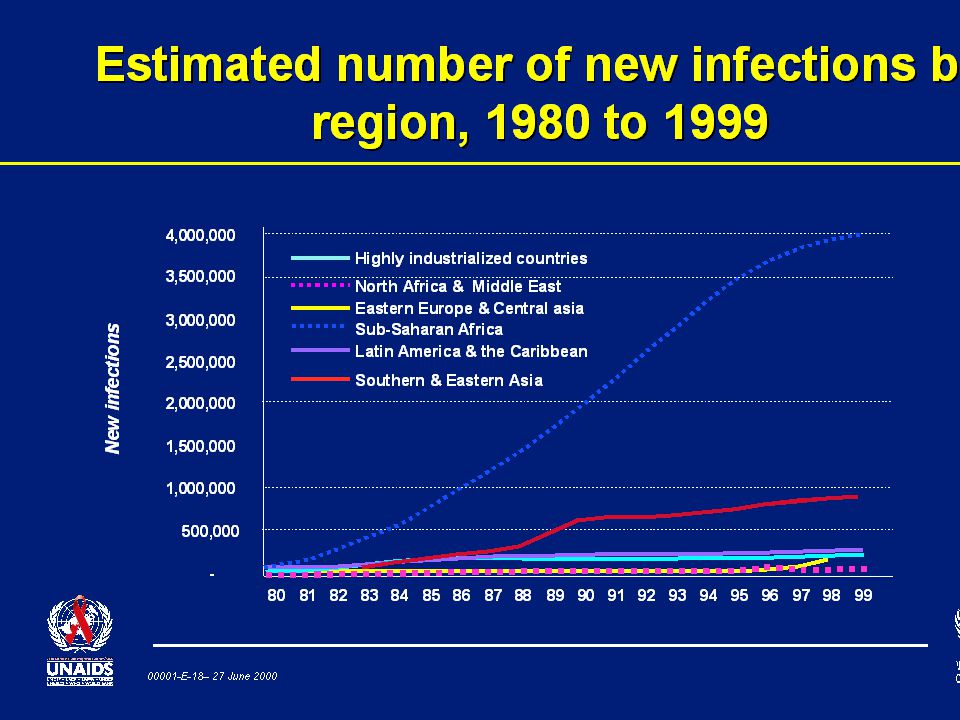
4.1 million new infections 2005

18
HIV Epidemic in Sub-Saharan Africa, 1985-2005
2.7 million new infections, 2 million deaths st AIDS case

19
38.6 million 4.1 million 2.8 million

20
Leading causes of death in Africa, 2001
Rank % of total 1 HIV/AIDS 2 Acute lower respiratory infections 3 Malaria 4 Diarrhoeal diseases 5 Perinatal conditions 6 Measles 7 Tuberculosis 8 Cerebrovascular disease 9 Ischaemic heart disease 10 Maternal conditions 20.6 10.3 9.1 7.3 5.9 4.9 3.4 3.2 3.0 2.4 Source: The World Health Report 2000, WHO

21
HIV Prevalence (%) in Adults in Africa, 2005
Adult Prevalence Rate

22
HIV prevalence among 15–24 year-old men and women, selected countries in sub-Saharan Africa, 2001–2005 Sources: Demographic and Health Surveys. ORC Macro (Ghana, Burkina Faso, Mali, United Republic of Tanzania, Cameroon, Lesotho, Kenya, Zambia); Department of Health, Uganda HIV/AIDS sero-behavioural survey 2004/2005 (Uganda); Ministry of Health and Child Welfare, Zimbabwe National Family Planning Council, National AIDS Council , and CDC, The Zimbabwe Young Adult Survey (Zimbabwe); Pettifor AE, et al. HIV and sexual behaviour among young South African: a national survey of year olds (South Africa). 5 10 15 20 Ghana 2003 Burkina Faso 2003 Mali 2001 Tanzania 2003 Cameroon 2004 Uganda 2004/05 Kenya 2003 Zambia 2002 South Africa 2002 Lesotho 2004 Zimbabwe 2001/02 % HIV prevalence AIDS epidemic update, December Fig 3 Women Men
; Department of Health, Uganda HIV/AIDS sero-behavioural survey 2004/2005 (Uganda); Ministry of Health and Child Welfare, Zimbabwe National Family Planning Council, National AIDS Council , and CDC, The Zimbabwe Young Adult Survey (Zimbabwe); Pettifor AE, et al. HIV and sexual behaviour among young South African: a national survey of year olds (South Africa) Ghana Burkina Faso Mali Tanzania Cameroon Uganda 2004/05. Kenya Zambia South Africa Lesotho Zimbabwe 2001/02. % HIV prevalence. AIDS epidemic update, December Fig 3. Women. Men.")
24
Southern Africa Global epicenter
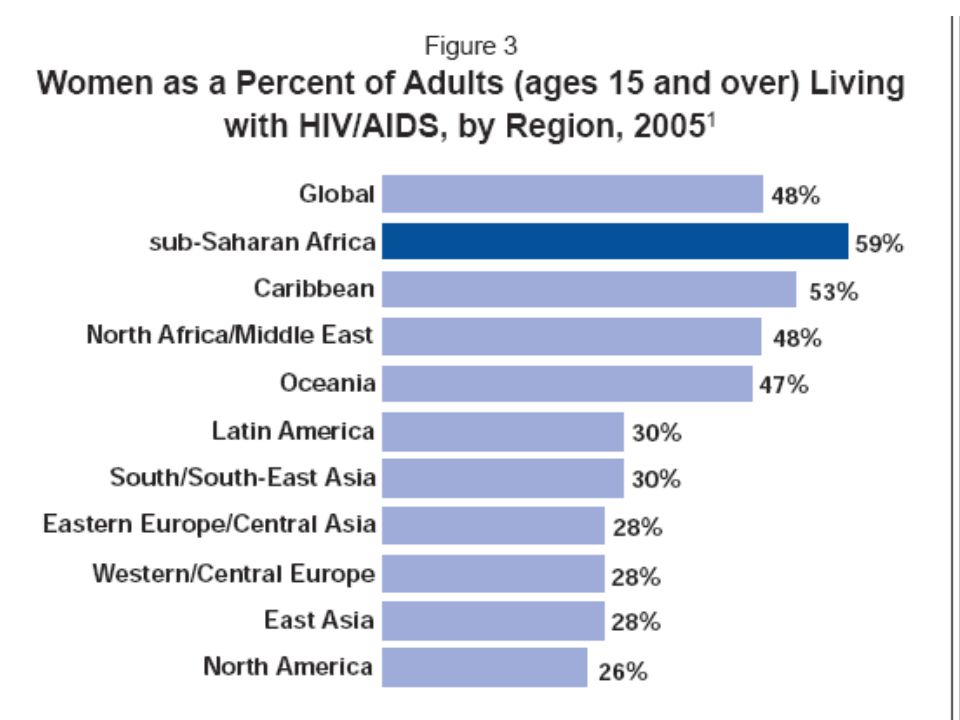
All 7 countries in Southern Africa have adult prevalence rates near or above 20% (Swaziland >33%). 33% of HIV infected persons 43% of all HIV + children <15 live here 52% of all HIV + women (>14 years of age) 1/3 of all AIDS deaths
. 33% of HIV infected persons. 43% of all HIV + children <15 live here. 52% of all HIV + women (>14 years of age) 1/3 of all AIDS deaths.")
25
HIV Prevalence (%) among pregnant women attending antenatal clinics in Southern Sub-Saharan Africa,
 among pregnant women attending antenatal clinics in Southern Sub-Saharan Africa,")
26
Africa -Economic Impact of HIV in Hardest Hit Countries
Annual per capita growth in half of the countries is falling by %. By 2010 GDP may drop by 8%. By 2020 GDP could drop more than 20%. In several countries, 53% of all illnesses among workers are AIDS-related. 7 million farm workers have died from AIDS. 85% of teacher deaths are from AIDS.

27
South Africa 57% are women
2nd highest number of persons living with HIV/AIDS in the world ~ 5.5 million/population 45 million; ~19% HIV+ 60%-70% military HIV+ 57% are women in year olds, females are 3 x more likely to be infected than males

28
HIV prevalence among pregnant women in South Africa, 1990 to 2001
5 10 15 20 25 30 HIV prevalence (%) 1990 ‘91 ‘92 ‘93 ‘94 ‘95 ‘96 ‘97 ‘98 ‘99 ‘01 2000 Source: Department of Health, Republic of South Africa
 ‘91. ‘92. ‘93. ‘94. ‘95. ‘96. ‘97. ‘98. ‘99. ‘ Source: Department of Health, Republic of South Africa.")
29
Number of people who died from HIV/AIDS
in sub-Saharan Africa, 2,500 Thousands 2,000 1,500 1,000 500 1980 1983 1986 1989 1992 1995 1998 2001 Source: UNAIDS, 2002

32
Projected population structure with and
without the AIDS epidemic, Botswana, 2020 80 Projected population structure in 2020 75 70 Males Females 65 Deficits due to AIDS 60 55 Age in years 50 45 40 35 30 25 20 15 10 5 140 120 100 80 60 40 20 20 40 60 80 100 120 140 Population (thousands) Source: US Census Bureau, World Population Profile 2000
 Source: US Census Bureau, World Population Profile")
34
Sub-Saharan Africa Poverty –health care infrastructure and accessibility Migration for jobs –miners, long distance truck drivers Young girls having relationships with older men (more likely to be HIV+) Armed conflicts/displacements Political leadership – Successes in several countries including Uganda, Botswana, Nigeria Severe economic consequences –loss of skilled and nonskilled workers, farmers, decreased food supply, lack of educational opportunities
 Armed conflicts/displacements. Political leadership – Successes in several countries including Uganda, Botswana, Nigeria. Severe economic consequences –loss of skilled and nonskilled workers, farmers, decreased food supply, lack of educational opportunities.")
35
Has Epidemic Peaked in Sub Saharan Africa?
Adult prevalence stable in many countries Stable or declining prevalence ? Leveling off vs increase in deaths

36
World’s fastest growing epidemic- started in late 1990’s— 1
World’s fastest growing epidemic- started in late 1990’s— 1.6 million living with HIV, 270,000 newly infected in 2005 75% infections in persons <30 years of age Eastern Europe

37
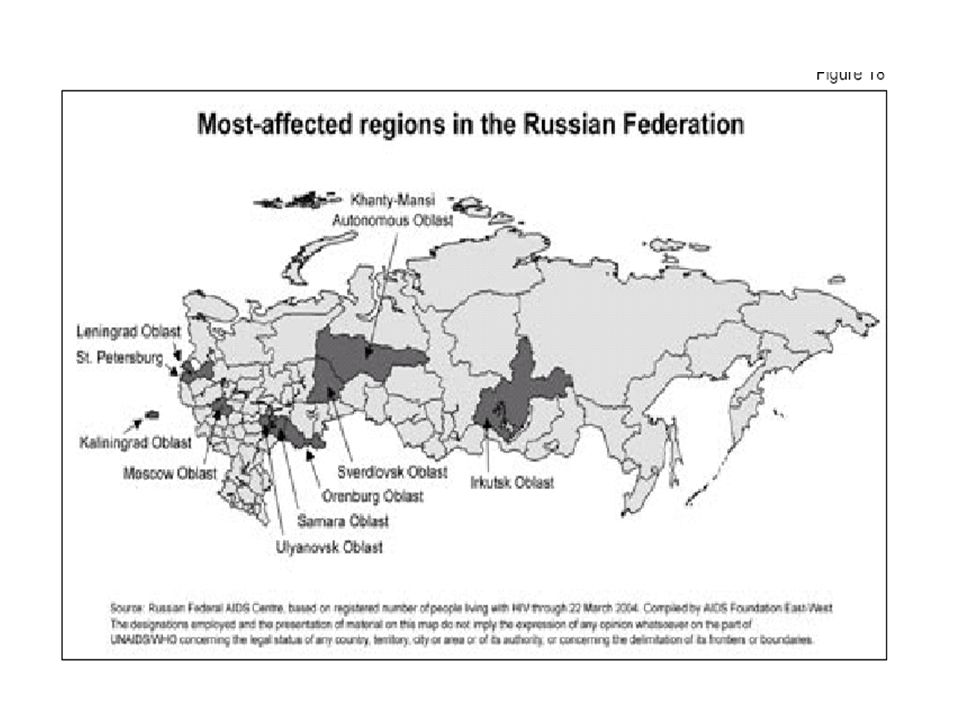
Eastern Europe Most affected countries are Russia and Ukraine
0.8% population infected Fueled by large numbers of IDUs’—estimated 1% -2% population injects drugs (up to 3,400,000) 5%-8% men <30 have injected drugs Inject in groups, promoting multiple reuse of injecting equipment and transmission of HIV
 5%-8% men <30 have injected drugs. Inject in groups, promoting multiple reuse of injecting equipment and transmission of HIV.")
38
Russia: 860,000 infected Predictions of 5-8 million infected by 2010

39
Newly diagnosed HIV infections per million population
in Eastern European and Central Asian countries, 1996—2003 Source: (1) HIV /AIDS Surveillance in Europe, EuroHIV mid-year report 2003, no (2) AIDS Foundation East West 200 400 600 800 1,000 1,200 1993 1994 1995 1996 1997 1998 1999 2000 2001 2002 2003 New HIV infection per million population Estonia Russian Federation Ukraine Belarus Moldova, Republic of Latvia Kazakhstan Uzbekistan Kyrgyzstan 2004 Report on the Global AIDS Epidemic (Fig 9)
 HIV /AIDS Surveillance in Europe, EuroHIV mid-year report 2003, no. 69. (2) AIDS Foundation East West ,000. 1, New HIV. infection. per million. population. Estonia. Russian Federation. Ukraine. Belarus. Moldova, Republic of. Latvia. Kazakhstan. Uzbekistan. Kyrgyzstan Report on the Global AIDS Epidemic (Fig 9)")
40
St. Petersburg, Russia, Rate of HIV per 100,000 Population

42
Drug Use in Saratov Oblast
Drug use was a major problem in May 2000. The drug market is expanding rapidly as dealers enlist younger people into use and distribution. Over the past four years the average age of drug initiation reportedly has dropped from to

43
Prevalence of syphilis among pregnant women
attending antenatal clinics in the Moscow region, 1993 to 1997 800 700 600 Prevalence per 100,000 500 400 300 200 100 1993 1994 1995 1996 1997 Source: Borisenko KK et al. Int J STD & AIDS, 1999, 10:

44
Sex Workers in St. Petersburg Russia Observations
Motivations: quick money for survival needs, including food, lodging and medicine; obtain money for luxuries; support a drug habit; to travel abroad and meet potential marital partners. Initiation into sex work usually through friends and occasionally through applications to Internet agencies. Sex work in Russia in high demand, widespread and reaches deep into society. The social backgrounds of sex workers are highly varied; some from very poor backgrounds; others from high socioeconomic status families.

45
Ukraine Estimated HIV prevalence 1.4% of population,
Fueled by IDUs, sex workers High proportion of sex workers HIV+ 42% newly diagnosed HIV in 2004 were females

46
Epidemic in Eastern Europe is Maturing
Increasing sexual transmission (6% infections in % in 2004) HIV + in pregnant women increased from <0.01% in 1998 to 0.11% 2003. Recent surveys ->80% male IDUs didn’t use condoms regularly in last month Continued growth sex industry, rising number women migrating for work
 HIV + in pregnant women increased from <0.01% in 1998 to 0.11% Recent surveys ->80% male IDUs didn’t use condoms regularly in last month. Continued growth sex industry, rising number women migrating for work.")
47
How HIV Spreads out of High Risk Populations
IDUs are sexually active Many sex workers also inject drugs Most male clients of sex workers have other sexual partners, including wives & steady girlfriends HIV infection filters gradually from injecting drug users & commercial sex workers to their regular sex partners who may have no other risk of exposure to the virus

48
High Proportion of Men who Inject Drugs are also Clients of Sex Workers. Most do not Use Condoms

49
HIV/AIDS in Asia 60% of world’s population 8.3 million infected
There is no “Asian HIV epidemic”; much diversity in the nature, pace, and severity of the HIV epidemic across Asia, between and within countries. Areas of rapid increases in HIV (China, Vietnam, Indonesia); Areas of sustained epidemic levels (India, Myanmar); areas of HIV declines (Thailand, Cambodia), and low prevalence countries (Laos, Pakistan, Sri Lanka, Phillippines).
; Areas of sustained epidemic levels (India, Myanmar); areas of HIV declines (Thailand, Cambodia), and low prevalence countries (Laos, Pakistan, Sri Lanka, Phillippines).")
50
Transmission of HIV in Asia
Most infections occur through unsafe commercial sex injecting drugs with contaminated equipment

51
What do Asian epidemics look like?
FSW Clients MSM IDUs Low or no risk males Low or no risk females Multiple interlinked & interrelated epidemics in higher risk populations and their immediate sex partners In Africa, HIV has spread mainly through casual heterosexual relationships in the population at large. In contrast, Asian epidemics consist almost entirely of multiple interlinked and interrelated epidemics in higher risk populations and their immediate sexual partners. The key populations involved include: Injecting drug users – epidemics among injectors have played a key role in China, Vietnam, and Malaysia Men who have sex with men – while this has been largely an ignored epidemic in Asia, recent HIV surveys in Jakarta, Bangkok and Phnom Penh have all found roughly one in seven of these men infected with HIV. Sex workers and their clients – this is by far the largest component of the epidemics in Asia and the source of most male heterosexual infections. And finally we have the “low risk” female partners of these higher risk men. It is worth noting that over 80% of women infected in Asia have no risk behavior at all by conventional definitions – they contracted HIV in what they thought was a “monogamous” relationship with their husbands. The term “general population spread” (by which I mean the “boyfriend-girlfriend” driven transmission we see in Africa) really doesn’t apply in Asia, because female sexuality is extremely constrained. But does this concentration of HIV in higher risk populations and their immediate partners mean that Asian epidemics will naturally be quite limited in their extent? ~10% Asian men go to sex workers
 really doesn’t apply in Asia, because female sexuality is extremely constrained. But does this concentration of HIV in higher risk populations and their immediate partners mean that Asian epidemics will naturally be quite limited in their extent ~10% Asian men go to sex workers.")
52
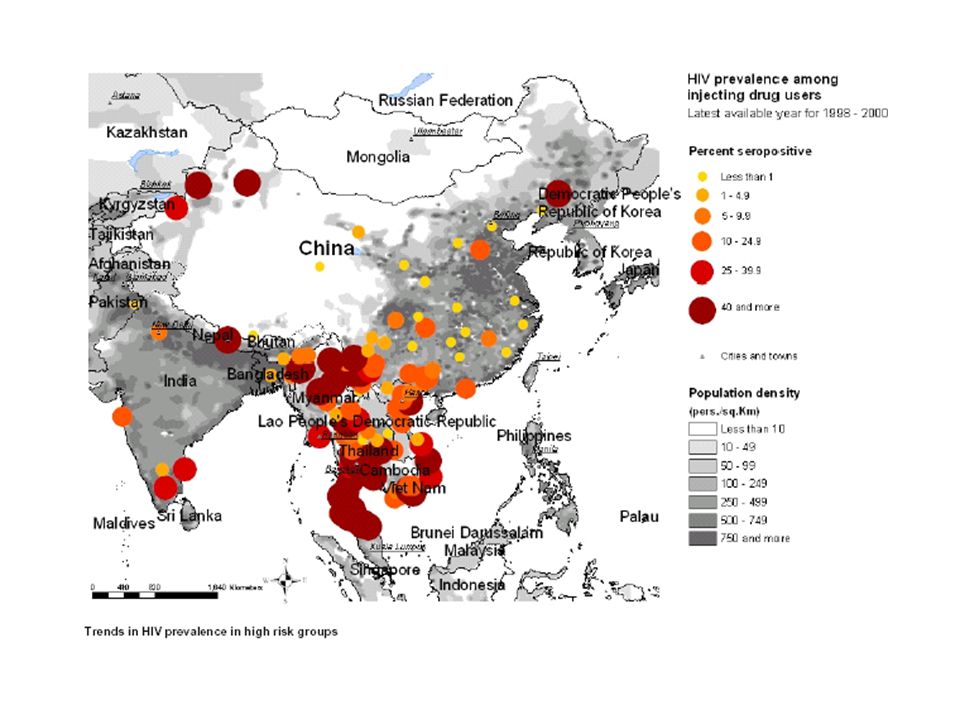
HIV prevalence in Asia, 2003 Spread through IDUs, sex workers
2.0% – 5.0% 1.0% – 2.0% 0.5% – 1.0% 0.1% – 0.5% 0.0% – 0.1% trend data unavailable outside region When it comes to the HIV/AIDS epidemic, Asia is a land of true diversity and contrast. A number of countries, for example Burma, Cambodia and Thailand shown in darker blue here, have high adult HIV levels of 2 to 3 percent. Others such as Bangladesh, Laos and the Philippines have some of the lowest rates of HIV in the world. But as time goes on, fewer and fewer countries fall in this category and several countries such as China, Indonesia and Vietnam have epidemics in transition – they have experienced recent and dynamic changes in their epidemics after an extended period of low prevalence. But despite strong evidence that HIV continues to spread in most Asian countries, complacency seems to be setting in. Outside of Thailand and Cambodia surveillance is often poor or incomplete, national responses to the epidemic remain weak, and the coverage of prevention programs is extremely limited. In the next few minutes, I’d like to speak with you about: •What drives Asian epidemics and why we see major differences around the region, •Where these epidemics are likely to go, and •What analysis of epidemic dynamics tells us we should do about it. Spread through IDUs, sex workers

53
Southeast Asia adult HIV prevalence, 2003
Myanmar 1.2% (330,000) Vietnam 0.4% (220,000) Laos 0.1% (1,700) Thailand 1.5% (570,000) Cambodia 2.6% (170,000) Malaysia 0.4% (52,000) Singapore 0.2% (4,100) Adult HIV prevalence (Numbers of HIV+ cases) Source: WHO
 Vietnam 0.4% (220,000) Laos 0.1% (1,700) Thailand 1.5% (570,000) Cambodia 2.6% (170,000) Malaysia 0.4% (52,000) Singapore 0.2% (4,100) Adult HIV prevalence (Numbers of HIV+ cases) Source: WHO.")
54
Expanding HIV/AIDS Epidemic in China
1985 1995 1989 1998 Source: UNAIDS 650,000 HIV+ in 2004; 80% IDU & commercial sex

55
Estimated that ~10% of Asian Men Buy Sex
Percent of Men Buying Sex in Previous 12 Months among Men in High Risk Occupations and the General Population Estimated that ~10% of Asian Men Buy Sex High risk occupations =truck drivers, police, sailors, migrant workers

57
HIV in Asia vs. Africa Prevalence in Asia lower but populations larger
1 percent in India or China = 10 million people Effective intervention “easier” in Asia Focus on IDUs, MSM, sex workers and clients Lower prevalence and growing economies make early identification (testing) and effective treatment (HAART) possible
 and effective treatment (HAART) possible.")
58
Focusing on persons 25 to 44 years old emphasizes the importance of HIV disease among causes of death. Compared with rates at other ages, the rate of death due to HIV disease is relatively high in this age group, but rates of death due to other causes are relatively low. Of all deaths due to HIV disease, about 70% have occurred among persons 25 to 44 years old. HIV disease was the leading cause of death among persons 25 to 44 years old in 1994 and In 1995, HIV disease caused about 32,000 deaths, or 20% of all deaths in this age group (based on ICD-10 rules for selecting the underlying cause of death). The rank of HIV disease fell to 5th place from 1997 through 2000, and to 6th place in 2001 and The spike in the rate of death due to homicide in 2001 resulted from the terrorist attack on September 11. In 2002, HIV disease caused about 7,500 deaths, or 6% of all deaths in this age group.
. The rank of HIV disease fell to 5th place from 1997 through 2000, and to 6th place in 2001 and The spike in the rate of death due to homicide in 2001 resulted from the terrorist attack on September 11. In 2002, HIV disease caused about 7,500 deaths, or 6% of all deaths in this age group.")
59
HIV/AIDS Treatment Antiretroviral Therapy (ART), available 1996 by 1997, death, hospitalizations, OIs declined by 60-80%
, available 1996 by 1997, death, hospitalizations, OIs declined by 60-80%")
60
Antiretroviral therapy coverage for adults, Developing World, end 2005
1.3 million people on treatment: 10 20 30 40 50 60 % Source: UNAIDS/WHO, 2004 Antiretroviral therapy coverage for adults, Developing World, end 2005 Africa Asia Latin America and the Caribbean Eastern Europe and Central Asia North Africa and Middle East 2004 Report on the Global AIDS Epidemic (Fig 33)
")
61
Challenges HIV testing -only 10% of 39 million persons HIV + are aware of their infection Affordable HIV treatment HIV prevention Education and awareness Overcome stigma and discrimination

63
Impact of HAART-Behaviors
HIV is now a manageable chronic illness, no longer a death sentence HIV+ persons less concerned about transmitting HIV to HIV - partners —mistaken belief that nondetectable viral load means that they are not infectious to others ↑ in unprotected sex, ↑ in STIs and ↑ in HIV transmission

64
Percentage of young people aged 15–24 years
who correctly identified major ways of preventing the sexual transmission of HIV*, 2003 10 20 30 40 50 60 % Source: Demographic and Health Surveys. ORC Macro (Burkina Faso, Cameroon, Ghana, Kenya, Madagascar, Mozambique and Nigeria); Tanzania HIV/AIDS Indicator Survey , TACAIDS, NBS, and ORC Macro (UR Tanzania). *Using condoms and limiting sex to one faithful, uninfected partner, who reject the two most common local misconceptions about HIV transmission, and who know that a healthy looking person can transmit HIV. Burkina Faso Cameroon Ghana Kenya Madagascar Mozambique Nigeria UR Tanzania AIDS epidemic update, December Fig 4 Female Male
; Tanzania HIV/AIDS. Indicator Survey , TACAIDS, NBS, and ORC Macro (UR Tanzania). *Using condoms and limiting sex to one faithful, uninfected partner, who reject the two most common local misconceptions about HIV transmission, and who know that a healthy looking person can transmit HIV. Burkina Faso. Cameroon. Ghana. Kenya. Madagascar. Mozambique. Nigeria. UR Tanzania. AIDS epidemic update, December Fig 4. Female. Male.")
65
Factors Facilitating Pandemic of HIV
Long Period between Infection and Symptoms Individual: long period of silent infection & infectivity Community: Prevalence >> incidence resulting in an insidious epidemic HIV persists for life time of human host Stigma/Discrimination Modes of transmission (sex and drugs) High case fatality rate Fear of contagion Linked to poverty -competing priorities
 High case fatality rate. Fear of contagion. Linked to poverty -competing priorities.")
Similar presentations


 287-5193>")

>")


>")


