Download presentation
Presentation is loading. Please wait.

1
Educational Action Research Todd Twyman Summer 2011 Week 2

2
Statistics “Statistics means never having to say you’re certain”

3
Is It By Chance…? Claim: Aspirin reduces heart attack risk 11,034 in control group received a placebo 11,034 in treatment group received aspirin 189 in control group had a heart attack 104 in treatment group had a heart attack Is the study’s claim justified? Is the study’s claim justified? Is aspirin really the reason of reduced heart attack? Is aspirin really the reason of reduced heart attack? Could the results have happened by chance? Could the results have happened by chance?

4
Statistics “The science of decision making in a world full of uncertainty,” Robi Polikar “The science of decision making in a world full of uncertainty,” Robi Polikar Help us: Help us: Understand how likely it is that the observations collected from a sample also apply to the entire population. Understand how likely it is that the observations collected from a sample also apply to the entire population. Judge whether differences observed among experimental groups reflect “real” differences. Judge whether differences observed among experimental groups reflect “real” differences.

5
Purpose of Statistics Make generalized decisions about a population by analyzing a sample from the population Make generalized decisions about a population by analyzing a sample from the population Population: the entire set of people/items/etc. Population: the entire set of people/items/etc. Sample: small subset that is selected from the population Sample: small subset that is selected from the population

6
Types of Statistical Analyses Descriptive Statistics Descriptive Statistics Measures of Central Tendency: Measures of Central Tendency: Mean, Median, and Mode Mean, Median, and Mode Measures of Variability Measures of Variability Standard Deviation Standard Deviation

7
Types of Statistical Analyses Inferential Statistics Inferential Statistics Relationship between two performances Relationship between two performances Correlation Correlation Differences between two or more categories Differences between two or more categories Nominal data Nominal data Percentages or chi square Percentages or chi square Difference between two or more means Difference between two or more means Analysis of Variance (AOV) Analysis of Variance (AOV) T-test T-test
 Analysis of Variance (AOV) T-test T-test")
8
Types of Data Categorical (Nominal): classifies data into categories or groups with specific characteristics Categorical (Nominal): classifies data into categories or groups with specific characteristics Ordinal: organizes data in an order, intervals are not assumed to be equal Ordinal: organizes data in an order, intervals are not assumed to be equal Interval (Scale): continuous, quantitative data that fall along a number line Interval (Scale): continuous, quantitative data that fall along a number line
: classifies data into categories or groups with specific characteristics Categorical (Nominal): classifies data into categories or groups with specific characteristics Ordinal: organizes data in an order, intervals are not assumed to be equal Ordinal: organizes data in an order, intervals are not assumed to be equal Interval (Scale): continuous, quantitative data that fall along a number line Interval (Scale): continuous, quantitative data that fall along a number line")
9
Descriptive Statistics Statistic: a measure of a characteristic of the sample Statistic: a measure of a characteristic of the sample Descriptive Statistic: Summary and description of collected data. Descriptive Statistic: Summary and description of collected data. Displays: Displays: Histograms, boxplots, scatterplots Histograms, boxplots, scatterplots Summaries: Summaries: Mean, median, mode Mean, median, mode Standard deviation Standard deviation

10
Test scores Histogram

11
Central Tendency Income Mean : Balancing point Median : Divides equally Mode: Most frequent score

12
Central Tendency Mean: arithmetic average Mean: arithmetic average Median: score that divides the sample in two Median: score that divides the sample in two If the sample has an even number of data points, average the middle two values If the sample has an even number of data points, average the middle two values Mode: the most common score in the sample Mode: the most common score in the sample

13
1

14
2

15
Calculating Central Tendency For the following data, find the mean, median, and mode: 11 15 16 16 9 16 17 16 13 12 Mean: 11+15+16+16+9+16+17+16+13+12 = 14.1 Mean: 11+15+16+16+9+16+17+16+13+12 = 14.110 Median: 9 11 12 13 15 16 16 16 16 17 = 15.5 Median: 9 11 12 13 15 16 16 16 16 17 = 15.5 Mode: 16 Mode: 16

16
Measures of Variability Standard deviation Standard deviation Measures the extent to which scores in a distribution deviate from the mean Measures the extent to which scores in a distribution deviate from the mean Always report standard deviation when you report mean score or we will know nothing about your distribution! Always report standard deviation when you report mean score or we will know nothing about your distribution!

17
Measures of Variability Distribution of data influences the decisions Distribution of data influences the decisions Example: Find the means Example: Find the means Scores: 50, 50, 50, 50, 50 Scores: 50, 50, 50, 50, 50 Mean = 50 Mean = 50 Scores: 3, 75, 100, 12, 60 Scores: 3, 75, 100, 12, 60 Mean = 50 Mean = 50

18
Standard Deviation Scores with a high standard deviation suggest that your data set is highly variable: Scores with a high standard deviation suggest that your data set is highly variable: Your measure is not very reliable Your measure is not very reliable And/or student scores are highly variable And/or student scores are highly variable

19
Standard Deviation When the scores are pretty tightly bunched together and the bell curve is steep, the SD is small. When scores are spread apart and the bell curve is relatively flat, the SD is quite large.

20
The Normal Curve In a normal curve, most scores fall somewhere in the middle. The more extreme the score, the further from the middle it will be, indicating its rarity.

21
The Normal Curve Characteristics of the Normal Curve –Test scores cluster in the middle, fewer scores are in the tails –Curve can continue to infinity. Thus, right and left tails never touch baseline (zero).
..")
22
The Normal Curve Characteristics of the Normal Curve –50% of scores fall above the mean. –50% of scores fall below the mean. 50% mean

23
The Normal Curve Characteristics of the Normal Curve –34.1% of the population will score between the mean and 1 SD above or below the mean. –They are within one standard deviation of the mean. 34%

24
The Normal Curve Characteristics of the Normal Curve –13.6% of the population will score between 1 and 2 SDs from the mean. –They are within two standard deviations of the mean 13.6%

25
The Normal Curve Characteristics of the Normal Curve –2.1% of the population will score between 2 and 3 SDs from the mean. –They are within three standard deviations of the mean. 2.1%

26
Calculating Mean & SD

27
Boxplots Definition: A way of displaying the variation in scores graphically The median of a set of data separates the data into two equal parts and is always marked on a Box and Whiskers Plot.

28
Boxplots The box indicates the range of scores between the 25 th and 75 th percentiles. The whiskers indicate the highest and lowest scores in the data set.

29
Boxplots But what does it mean? What information about your students’ reading performance data does this graph give you?

30
Boxplots 1/4 of your students read fewer than 8.5 pages. 1/4 of your students read 8.5 - 12 pages. 1/4 of your students read 12 - 14 pages. 1/4 of your students read more than 14 pages.

31
What decisions can you make? When would you calculate the mean, median, mode during your teaching? When would you calculate the mean, median, mode during your teaching? How might you use visual displays to understand the data? How might you use visual displays to understand the data?

32
Inferential Statistics Draw conclusions or generalizations from a sample with observed properties about the population itself. Draw conclusions or generalizations from a sample with observed properties about the population itself. Sample Population Inferential Statistics

33
Analyzing Categorical Data Percentages Always report raw data with percentages Always report raw data with percentages Example: Example: 55% of the subjects were male (n = 4) 55% of the subjects were male (n = 4) 55% of the subjects were male 55% of the subjects were male (n = 12,392)
 55% of the subjects were male (n = 4) 55% of the subjects were male 55% of the subjects were male (n = 12,392)")
34
Analyzing Categorical Data Chi Square Used to evaluate whether the proportions of individuals who fall into categories of a variable are equal to the hypothesized values. Used to evaluate whether the proportions of individuals who fall into categories of a variable are equal to the hypothesized values. Nominal data (counts) Nominal data (counts) Ordinal data (fail, pass, etc.) Ordinal data (fail, pass, etc.)
 Nominal data (counts) Ordinal data (fail, pass, etc.) Ordinal data (fail, pass, etc.).")
35
Chi Square Weak Reader Strong Reader Marginal Totals Pass143448 Fail26632 Marginal Totals 40 80

36
Analyzing Interval Data Correlation Coefficients Correlation Coefficients Descriptive Descriptive Significance - different from zero? Significance - different from zero? T-test T-test Significance - was effect due to chance? Significance - was effect due to chance? Analysis of Variance Analysis of Variance Significance - was effect due to chance? Significance - was effect due to chance?

37
Correlations Explore strength of relationships Explore strength of relationships Use continuous variables Use continuous variables Can be positive or negative Can be positive or negative The size of the coefficient (r) indicate the strength of the correlation The size of the coefficient (r) indicate the strength of the correlation No implication of causation! No implication of causation!

38
Correlation Coefficients Correlation coefficient (r) Takes a value between -1 and +1
 Takes a value between -1 and +1")
39
Correlation Coefficients OSATORFVOCAB OSAT1.590.84 ORF.591.12 VOCAB.84.121

40
Positive and negative correlation Creatinine clearance (ClCr)- measure of kidney function ClCr Body Weight (Kg) Positive ClCr Age (Years) Negative 35 70 10530 60 90 Correlation is present in both cases
- measure of kidney function ClCr Body Weight (Kg) Positive ClCr Age (Years) Negative Correlation is present in both cases")
41
Interpreting r R = +1.0R = +0.95 R = 0 R = -0.5R = -1.0 Perfect positive correlation Partial positive correlation Partial negative correlation Perfect negative correlation No correlation

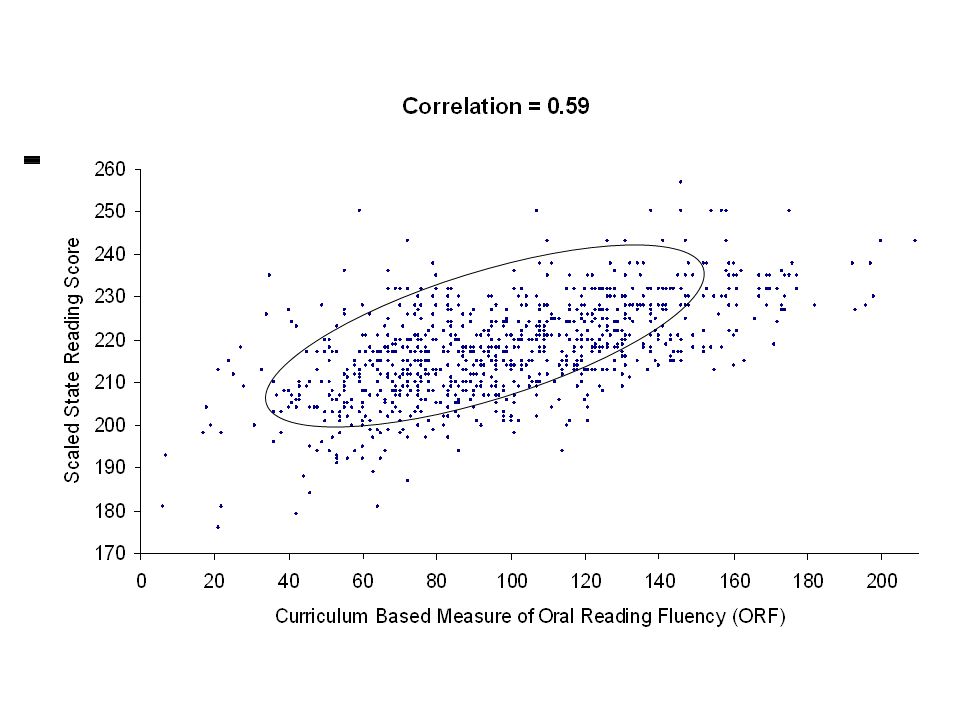
42
© Roland Good III

45
Your Turn… Identify a research question from your teaching experience that would be appropriately analyzed using correlation. Identify a research question from your teaching experience that would be appropriately analyzed using correlation.

46
T-tests & AOV Test for statistical significance of difference between means Test for statistical significance of difference between means Assumptions Assumptions Random samples (robust if n > 30) Random samples (robust if n > 30) From Normal distribution From Normal distribution Equal std deviations (robust if n1 n2) Equal std deviations (robust if n1 n2) Independent samples Independent samples
 Random samples (robust if n > 30) From Normal distribution From Normal distribution Equal std deviations (robust if n1 n2) Equal std deviations (robust if n1 n2) Independent samples Independent samples")
47
T-tests & AOV Could the difference between the two groups be due to chance? Could the difference between the two groups be due to chance? Are your groups typical? Are your groups typical? Statistical significance (p-value) tells you the probability such a difference would have been found by pure chance. Statistical significance (p-value) tells you the probability such a difference would have been found by pure chance. p < 0.05 is used most frequently p < 0.05 is used most frequently
 tells you the probability such a difference would have been found by pure chance. Statistical significance (p-value) tells you the probability such a difference would have been found by pure chance. p < 0.05 is used most frequently p < 0.05 is used most frequently.")
48
Significance Level Alpha of.05 is completely arbitrary. Alpha of.05 is completely arbitrary. “I am 90% confident that 75% of researchers do not know what alpha actually means, so how could a “correct” cutoff level be chosen?” (Robin High, UO Computing Center) “I am 90% confident that 75% of researchers do not know what alpha actually means, so how could a “correct” cutoff level be chosen?” (Robin High, UO Computing Center) Lower alpha level, lower the probability of concluding the intervention is effective when it really isn’t (Type I error). Lower alpha level, lower the probability of concluding the intervention is effective when it really isn’t (Type I error).
 I am 90% confident that 75% of researchers do not know what alpha actually means, so how could a correct cutoff level be chosen (Robin High, UO Computing Center) Lower alpha level, lower the probability of concluding the intervention is effective when it really isn’t (Type I error). Lower alpha level, lower the probability of concluding the intervention is effective when it really isn’t (Type I error)..")
49
Effect size The difference between the two means, expressed as a proportion of the standard deviation The difference between the two means, expressed as a proportion of the standard deviation ES =(Me – Mc) / SD ES =(Me – Mc) / SD Assumptions Assumptions Standard deviations are similar Standard deviations are similar Distribution is normal Distribution is normal Reliable measures are used Reliable measures are used Fancy Slides adopted from… www.cem.dur.ac.uk/ebeuk/research
 / SD ES =(Me – Mc) / SD Assumptions Assumptions Standard deviations are similar Standard deviations are similar Distribution is normal Distribution is normal Reliable measures are used Reliable measures are used Fancy Slides adopted from…")
50
(standardised) Average score of person taught ‘normally’ Average score of person taught by experimental method Effect size
 Average score of person taught ‘normally’ Average score of person taught by experimental method Effect size")
51
Effect size = 0.5 1

52
Test Your Skills Do students who chew gum while taking tests perform better than students who do not? What is the relationship between home visits and parent participation at after- school functions?

53
Review What are the 3 types of data? Define and give examples of each. What are the 3 types of data? Define and give examples of each. What are the 3 common measures of central tendency? Define and give examples of each. What are the 3 common measures of central tendency? Define and give examples of each. What is a standard deviation? Why is it important to calculate? What is a standard deviation? Why is it important to calculate?

54
Homework Read Nothing Up My Sleeve: Unveiling the Magic of Statistics (I’ll send it to you ASAP). Read Nothing Up My Sleeve: Unveiling the Magic of Statistics (I’ll send it to you ASAP). Read Glanz, Appendix B Read Glanz, Appendix B
. Read Glanz, Appendix B Read Glanz, Appendix B.")
Similar presentations


 Statistical Analysis of Data Graziano and Raulin Research Methods: Chapter 5 This multimedia product and its contents.>")


 1. Nominal Scale: number is really a name! 1 = male 2 = female.>")

: Analysing data.>")


 David Myers PowerPoint Slides Aneeq Ahmad Henderson State University Worth Publishers, © 2008.>")


>")
