Download presentation
Presentation is loading. Please wait.

1
The Knowledge Economy, Intangible Investment and Growth
Jonathan Haskel Imperial College Business School, Imperial College London British Embassy, Berlin 17th June 2011

2
Can Europe grow out of trouble? The enduring productivity deficit
Revise this Source: EUKLEMS and The Conference Board

3
The R&D deficit… Source: OECD STI indicators

4
…and now with China Source: OECD STI indicators

5
Driving growth in knowledge economies
GDP per worker driven by Physical capital deepening Within the firm: ICT Outside the firm: infrastructure Human capital deepening General education of labour force Immigration Ideas/innovation/intangible capital deepening Use of ideas Within the firm: investment in R&D and non-R&D (software, design, training, branding, organisation) From outside the firm: open innovation
 From outside the firm: open innovation.")
6
So, why is Europe lagging?
Composition Larger public sector in Europe brings average down? Too much financial services? Physical capital? Lower computer adoption? Human capital? Ideas/Innovation/Intangible capital? Low R&D. But is R&D the whole story? No, lower productivity in service sectors Maybe, but manufacturing and measurement isnt a big story Computer adoption is shares of computer capital in value added a bit lower than US Human, well US is terrible….

7
Measuring all intangible investment
Knowledge investment is more than just R&D Software Innovative property Scientific R&D Design Financial services product development Artistic originals Economic competencies Marketing Training Firm organisational capital

8
Intangible/tangible investment varies significantly across countries
Greece, v v low intang investment, much more tang. Compare with the US and Sweden Source: OECD/COINVEST project

9
How does composition of intangible investment vary
How does composition of intangible investment vary? (Investment by intangible asset share in GDP, 2005 selected countries) Sweden and Ja, very R&D intensive US, who are big on R&D, much more on training etc. Source: OECD/COINVEST project
 Sweden and Ja, very R&D intensive. US, who are big on R&D, much more on training etc. Source: OECD/COINVEST project.")
10
Manufacturing is not manufacturing any more…
Note that manufacturing is not manufacturing any more But.. Ge intang is a lot in manufacturing Source: COINVEST

11
Knowledge is the key to growth (growth accounting, 1995-06)
Source: OECD/COINVEST project

12
Policy?

13
Strict employment protection correlated with low intangible investment…
Source: COINVEST

14
…as is many days to start a business.
Source: COINVEST

15
Government R&D can help…
Source: COINVEST

16
…and note that strictness positively correlated with tangibles. ….
Source: COINVEST

17
Implications Key importance of knowledge Policy : what not to do
Knowledge = Intangibles and TFP = major contributors to growth It’s not just R&D Manufacturing is not manufacturing any more Policy : what not to do Stop obsessing about manufacturing and just R&D Policy: what to do All investment needs long term tax and regime certainty. Bank regulation? Government Science Budgets and public R&D will help Employment regulation Part of overall social contract Helps tangibles, hurts intangibles So the choice: do we want growth from catch-up or innovation?

18
spares

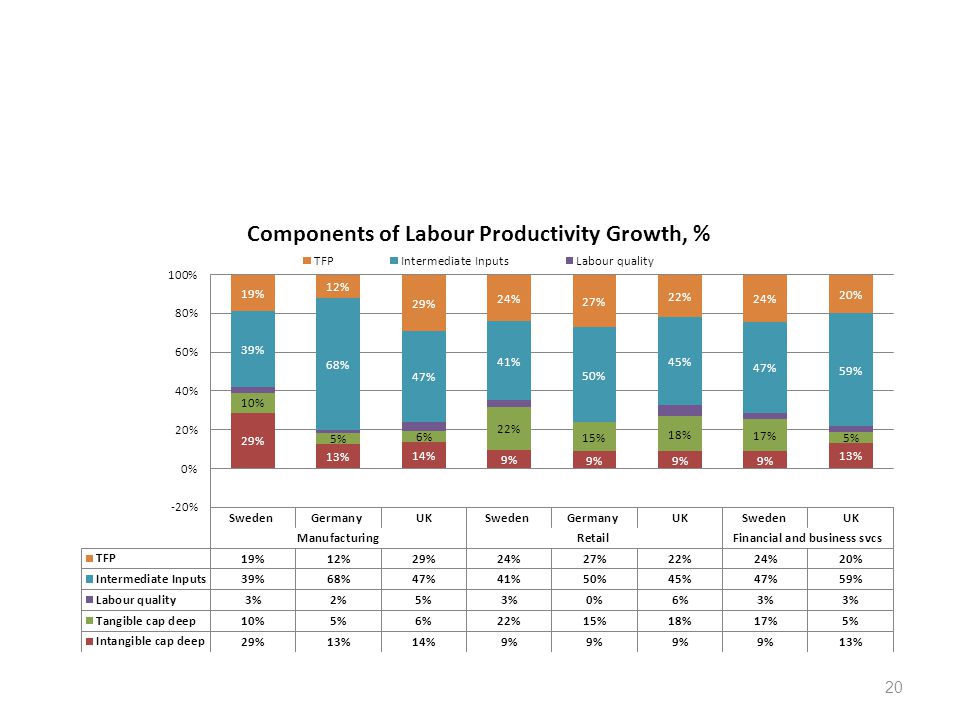
19
Manufacturing: Ge leads, but mostly intermediates. Sw intangible based
Retail: Sw leads. TFP important FinBizServices: UK lead, intangibles important

21
Let us present the variation from the CHS baseline for each modified asset in the countries listed above. The different intangible asset estimates within countries could be ascribed to two major differences. First, different sources might have been used for same asset in the CHS and Coinvest data versions. Generally, when those differences are quite small we consider them negligible. Second, different assumptions apply in the estimates of the assets.

22
Richer country can afford intangible investment, or is at the higher end of the supply chain (higher-value-added activities). Source: Hao et al. (2009) for Germany, France, Italy and Spain; CHS (2009) for the US , Marrano et al. (2009) for the UK, Jalava et al. (2007) for Finland, Fukao et al. (2009) for Japan, Edquist (2009) for Sweden, Van Rooijen-Horsten et al. (2008) for the Netherlands and Barnes and McClure (2009) for Australia. GDP per capita is from the Total Economy Database of The Conference Board. 22
 for Germany, France, Italy and Spain; CHS (2009) for the US , Marrano et al. (2009) for the UK, Jalava et al. (2007) for Finland, Fukao et al. (2009) for Japan, Edquist (2009) for Sweden, Van Rooijen-Horsten et al. (2008) for the Netherlands and Barnes and McClure (2009) for Australia. GDP per capita is from the Total Economy Database of The Conference Board. 22.")
23
Sweden and UK are most intangible intensive….with Germany following…..
Note: market sector value added is adjusted for intangible spending and excludes real estate NACE code 70 Source: Coinvest and Euklems 23 23

24
In which industries do countries invest of their intangible capital
In which industries do countries invest of their intangible capital? Ge most intangible investment in manufacturing, UK in services Figure 13 reports intangible and tangible investment as a share of value added in three industries for UK, Germany and Sweden in year Value added has been adjusted to include intangible investment.

25
Intangible contributions Retail: similar; Mfr: Sweden high; Finance: UK high

26
An innovation gap?

Similar presentations

>")


 “European R&D Benchmarking (2002)” Science, Technology and Innovation Policy Student Presentations Students: Miguel.>")
 “European Innovation Scoreboard (2002)” Master in Eng. and Technology Management Science, Technology and Innovation.>")


