Download presentation
Presentation is loading. Please wait.

1
Project funded by the European Commission under the Seventh Framework Programme, Grant No 217512 www.coinvest.org Intangible Assets and Their Contribution to Growth in Germany – Main Findings From a Macro-, Sector- and Micro-Level Perspective Dirk Crass, Georg Licht and Bettina Peters ZEW Centre for European Economic Research, Mannheim London Dissemination Conference, 23rd September 2010

2
Main Tasks of ZEW Within COINVEST Collecting time series of intangible capital and exploring its contribu- tion to economic growth in Germany using growth accounting methods at the macro level ●Focus on sensitivity analysis using alternative data sources Collecting time series of intangible capital and performing growth accounting at the sector level Assessing the impact of various (not all) types of intangible capital on productivity using German firm-level data
 types of intangible capital on productivity using German firm-level data")
3
Structure 1. Intangibles and Their Contribution to Growth at the Macro Level 2. Intangibles and Their Contribution to Growth at the Sector Level 3. Impact of Intangibles on Productivity Growth at the Micro Level

4
Structure 1. Intangibles and Their Contribution to Growth at the Macro Level 2. Intangibles and Their Contribution to Growth at the Sector Level 3. Impact of Intangibles on Productivity Growth at the Micro Level

5
Intangible Assets: Benchmark Estimates Computerized information ●Computer software: EU KLEMS ●Computerized databases: EU KLEMS (NACE K724) Innovative property ●R&D, including social sciences and humanities: GERD (Eurostat) ●Mineral exploration: German national accounts ●Copyright and license costs (Creative Industries): German national accounts ●New product development costs in the financial industry: STAN (OECD) ●New architectural and engineering designs: EU KLEMS Economic competencies ●Brand equity: EU KLEMS, SBS (Eurostat), World Magazine Trends, ●Firm-specific human capital: LCS 2004, CVTS 2005, EU KLEMS ●Organizational structure: Annual Survey of the European Management Consultancy Market, Structure of Earning Survey 2002 (Eurostat)
 Innovative property ●R&D, including social sciences and humanities: GERD (Eurostat) ●Mineral exploration: German national accounts ●Copyright and license costs (Creative Industries): German national accounts ●New product development costs in the financial industry: STAN (OECD) ●New architectural and engineering designs: EU KLEMS Economic competencies ●Brand equity: EU KLEMS, SBS (Eurostat), World Magazine Trends, ●Firm-specific human capital: LCS 2004, CVTS 2005, EU KLEMS ●Organizational structure: Annual Survey of the European Management Consultancy Market, Structure of Earning Survey 2002 (Eurostat)")
6
Intangible Assets: Sensitivity Analysis Computerized information ●Computer software: EU KLEMS Nov2009 Release ●Computerized databases: Turnover tax statistics (72.4) Innovative property ●R&D, including social sciences and humanities: ANBERD (Eurostat) ●Mineral exploration: Turnover tax statistics (45.12) ●Copyright and license costs: Turnover tax statistics (92.11) ●New product development costs in the financial industry: MIP ●New architectural and engineering designs: Turnover tax statistics (74.2) Economic competencies ●Brand equity: ZAW, MIP, Turnover tax statistics (74.13) ●Firm-specific human capital: MIP, IW ●Organizational structure: Turnover tax statistics (74.14.1), Structure of earnings survey, EU KLEMS Nov2009
 Innovative property ●R&D, including social sciences and humanities: ANBERD (Eurostat) ●Mineral exploration: Turnover tax statistics (45.12) ●Copyright and license costs: Turnover tax statistics (92.11) ●New product development costs in the financial industry: MIP ●New architectural and engineering designs: Turnover tax statistics (74.2) Economic competencies ●Brand equity: ZAW, MIP, Turnover tax statistics (74.13) ●Firm-specific human capital: MIP, IW ●Organizational structure: Turnover tax statistics ( ), Structure of earnings survey, EU KLEMS Nov2009")
7
Advantage of Alternative Data Sources Turnover Tax Statistics ●Census from the data of the tax authorities that covers nearly all economic sectors with high quality. It is not based on a sample survey such as the structural business statistics. ●Annual data since 1996 (before that on a biennial basis). ●Unlike SBS no structural break in the year 2000. ●Disaggregated data e.g. on market research (74.13.1) and public opinion polling (74.13.2) available. ●Used for: Computerized databases, mineral exploration, copyright and license costs, new architectural and engineering designs, brand equity, purchased organizational structure.
. ●Unlike SBS no structural break in the year ●Disaggregated data e.g. on market research ( ) and public opinion polling ( ) available. ●Used for: Computerized databases, mineral exploration, copyright and license costs, new architectural and engineering designs, brand equity, purchased organizational structure..")
8
Advantage of Alternative Data Sources MIP Mannheim Innovation Panel ●Part of Community Innovation Surveys ●Representative survey ●Annual survey in Germany (EU: 4/2 years), started in 1993 ●Extrapolation of figures, based on appr. 5000-6000 firms per year ●Training Allows industry break-down for vocational training Only direct training costs. Indirect costs are estimated using the proportion of direct to indirect costs provided by IW (av. every 3 years) ●Question on innovation expenditure in the financial industry ●Covers internal and external marketing expenditures beyond advertising ●Used for: Brand equity, new product development costs in the financial industry, and firm-specific human capital
 ●Question on innovation expenditure in the financial industry ●Covers internal and external marketing expenditures beyond advertising ●Used for: Brand equity, new product development costs in the financial industry, and firm-specific human capital.")
9
Advantage of Alternative Data Sources IW (Institute of the German Economy) ●Survey data (every three years) ●Direct and indirect training costs. ●Indirect costs: number of training hours * average wage ●Proportion of direct costs to total costs: on average 35% ●Indirect costs used for: Firm-specific human capital. ZAW (Central Association of the German Advertising Industry) ●Publicly available time series data since the mid eighties. ●Broad coverage of all advertising activities and media channels. ●Allows a distinction between net advertising expenditure (media revenues) and gross advertising expenditures (also exp. for the design/production of adv. content and material). ●Unlike SBS no structural break in the year 2000. ●Used for: Brand equity.
 ●Publicly available time series data since the mid eighties. ●Broad coverage of all advertising activities and media channels. ●Allows a distinction between net advertising expenditure (media revenues) and gross advertising expenditures (also exp. for the design/production of adv. content and material). ●Unlike SBS no structural break in the year ●Used for: Brand equity..")
10
Intangible Investment by Category

11
Intangible Investment as Share of GDP in Germany

13
Intangible Inv. as Share of GDP in Germany, 2004 – Comparison of Data Sources

15
Comparison of Data Sources: New Product Development Costs in the Financial Industry

16
Comparison of Data Sources: Brand Equity

17
Decomposition of Aggregate Labour Productivity, 1997-2006

18
Structure 1. Intangibles and Their Contribution to Growth at the Macro Level 2. Intangibles and Their Contribution to Growth at the Sector Level 3. Impact of Intangibles on Productivity Growth at the Micro Level

19
Distribution of Intangible Investments Across Industries Increasing trend until 2001 Decrease since 2001 Stable distribution across industries over time

20
Distribution of E conomic Competences Across Industries

21
Distribution of I nnovative Property Across Industries Concentrated in two industries Increasing overall trend, but stable distribution across industries.

22
Distribution of Computerized Information Across Industries Increasing trend until 2001 Shift in distribution from manufac- turing towards business services

23
Distribution of Intangible Investments by Sector, 2004

25
Proportion of Intangible to Tangible Investments by Sector

26
Intangible Investment by Sector as Share of Sector Value Added

27
Contributions to Labour Productivity at the Sector Level

28
Growth Accounting in Manufacturing and Fin.& Bus.Services by Period

29
Decomposition of Lab.Prod. by Intangible Assets

30
Structure 1. Intangibles and Their Contribution to Growth at the Macro Level 2. Intangibles and Their Contribution to Growth at the Sector Level 3. Impact of Intangibles on Productivity Growth at the Micro Level

31
Motivation At the micro level: ●Much evidence on productivity enhancing effects of R&D ●But only scarce evidence on the effect of other types of intangibles investments at the firm level Research question: Do all types of investments in intangible assets enhance productivity at the firm-level? Analysis based on panel data (MIP) for German companies from 2006- 2008 (5117 firms, 7552 observations).
 for German companies from (5117 firms, 7552 observations)..")
32
Estimation Approach Cobb-Douglas production function ●With Q: output, L: labour, K: physical capital, M: material, λ: exogenous technological change, u: error term ●RD: R&D capital, NI: non-R&D related innovation capital, TR: human capital, MKT: marketing As log specification: Estimation Methods: Pooled OLS, FE (fixed effects), FD (first difference estimation, i.e productivity growth)
, FD (first difference estimation, i.e productivity growth)")
33
Knowledge-related Intangible Input Factors R&D: ●log (R&D expenditure / employee) Non-R&D related innovation: ●log (expenses for external knowledge, design, market introduction, training and product preparation related to innovation / employee) Marketing: ●log (marketing expenditure / employee) ●Note: to avoid double accounting we correct for market expenditure for innovation projects (based on industry average in prior wave) Training: ●log (training / employee) ●Note: to avoid double accounting we correct for training expenditure for innovation projects (based on industry average in prior wave) Organisational innovation: ●4 dummies for whether the firm has introduced new practices, workplace organisation, knowledge management and external relationships
 Non-R&D related innovation: ●log (expenses for external knowledge, design, market introduction, training and product preparation related to innovation / employee) Marketing: ●log (marketing expenditure / employee) ●Note: to avoid double accounting we correct for market expenditure for innovation projects (based on industry average in prior wave) Training: ●log (training / employee) ●Note: to avoid double accounting we correct for training expenditure for innovation projects (based on industry average in prior wave) Organisational innovation: ●4 dummies for whether the firm has introduced new practices, workplace organisation, knowledge management and external relationships")
34
Additional Explanatory Variables Traditional input factors: ●Labour : log (# employees) Note: to avoid double counting we correct the total number of employees for R&D employees ●Physical capital: log (tangible assets / employee) Note: tangible assets are direct information from the survey ●Material: log (material expenses / employees) Control variables: ●East Germany: dummy whether firm is located in East Germany ●Export intensity: exports / sales ●Group: company is part of a group (0/1) ●Time dummies ●Industry dummies
 Note: to avoid double counting we correct the total number of employees for R&D employees ●Physical capital: log (tangible assets / employee) Note: tangible assets are direct information from the survey ●Material: log (material expenses / employees) Control variables: ●East Germany: dummy whether firm is located in East Germany ●Export intensity: exports / sales ●Group: company is part of a group (0/1) ●Time dummies ●Industry dummies")
35
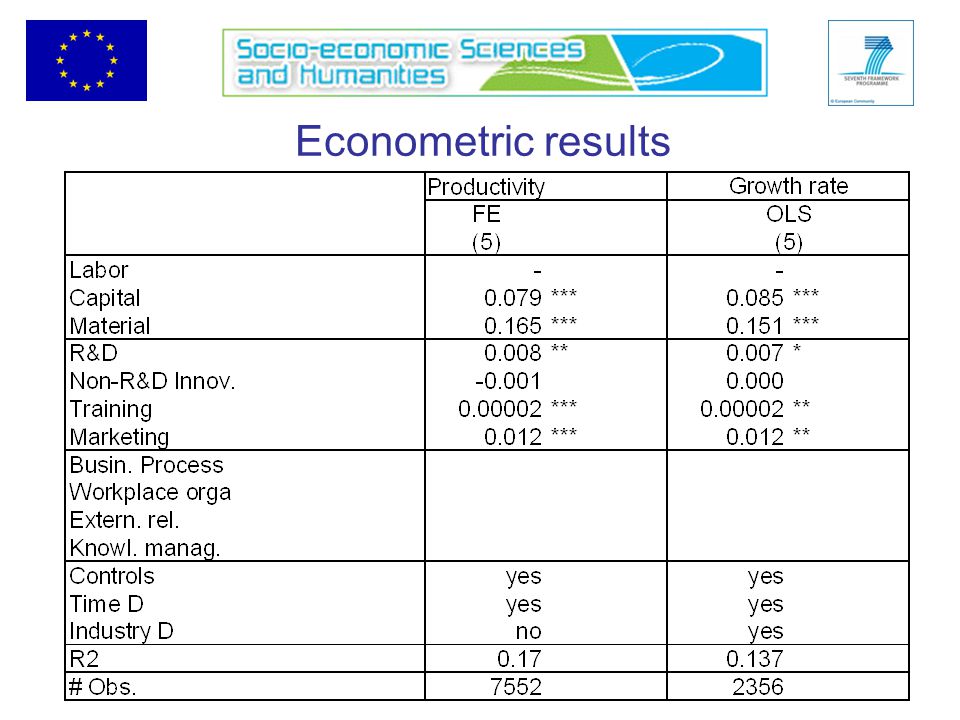
Main Findings From Micro Work We confirm strong positive productivity effects for R&D, marketing and training. Effects of marketing are highest, even higher than those of R&D (in the short term). Only weak evidence for positive productivity effects of non-R&D related innovation assets like design, licenses and product preparation. Mixed productivity effects of firms increasing their organizational capital by introducing organisational innovations: ●positive effect for business practices ●but not for workplace organisation
. Only weak evidence for positive productivity effects of non-R&D related innovation assets like design, licenses and product preparation. Mixed productivity effects of firms increasing their organizational capital by introducing organisational innovations: ●positive effect for business practices ●but not for workplace organisation.")
36
Back-Up Slides

37
Structure 1. Intangibles and Their Contribution to Growth at the Macro Level 2. Intangibles and Their Contribution to Growth at the Sector Level 3. Impact of Intangibles on Productivity Growth at the Micro Level

38
Econometric results

40
Descriptive statistics

41
Intangible Investment by category (in % of total intang. investment)
")
Similar presentations


>")


http://halaszg.ofi.hu.>")

 Fred Joutz (George Washington University) September.>")


 “European Innovation Scoreboard (2002)” Master in Eng. and Technology Management Science, Technology and Innovation.>")