Download presentation
Presentation is loading. Please wait.

1
Intangible Investment and Economic Growth in Japan Presented at the 3 rd World KLEMS Conference at Tokyo on May 19 th Tsutomu Miyagawa (Gakushuin University and RIETI) Konomi Tonogi (Kanagawa University) Shoichi Hisa (Kanagawa University)
 Konomi Tonogi (Kanagawa University) Shoichi Hisa (Kanagawa University)")
2
IT industries and Intangibles in Japan Jorgenson, Ho, and Stiroh (2005), Inklaar, O’Mahony and Timmer (2005), Fukao, et al. (2012): IT industries are key sectors of economic growth in advanced countries. In Japan, the value added growth and TFP growth in the IT industries have surpassed those in non-IT industries. The growth strategies in Japan have strengthened the utilization in IT.
: IT industries are key sectors of economic growth in advanced countries. In Japan, the value added growth and TFP growth in the IT industries have surpassed those in non-IT industries. The growth strategies in Japan have strengthened the utilization in IT..")
4
IT industries and Intangibles in Japan contd. The Economic Report of the President in the US in 2007 emphasized complementarities between IT investment and intangible investment. Corrado, Hulten and Sichel (2009) (hereafter referred to as CHS) measured aggregate intangible investment in the US. Following their approach, we measure the aggregate intangible investment in advanced countries. However, to examine the complementarities between IT investment and intangibles, we need to measure intangible investment by industry. →Chun et al. (2012), Miyagawa and Hisa (2013), Niebel et al. (2013), Crass et al. (2014).
 (hereafter referred to as CHS) measured aggregate intangible investment in the US. Following their approach, we measure the aggregate intangible investment in advanced countries. However, to examine the complementarities between IT investment and intangibles, we need to measure intangible investment by industry. →Chun et al. (2012), Miyagawa and Hisa (2013), Niebel et al. (2013), Crass et al. (2014)..")
5
The Measurement of Intangible Investment by Industry in Japan Following the CHS approach, we extended the intangible investment series developed by Chun et al. (2012) and Miyagawa and Hisa (2013) to 2010 by using the JIP database and other primary statistics. The current version of intangible investment data can be found at the following website: http://www.rieti.go.jp/en/database/JIP2011/ind ex.html#04-6.
 and Miyagawa and Hisa (2013) to 2010 by using the JIP database and other primary statistics. The current version of intangible investment data can be found at the following website: ex.html#")
6
The Measurement of Intangible Investment by Industry in Japan contd. Revised points of 2014 version of Intangible Investment data. (1)As JSNA started to publish data on own account software investment as well as custom and packaged software investment, we use the JSNA data to construct computerized information as much as we can. (2)Copyright and license costs →Entertainment and artistic originals.
As JSNA started to publish data on own account software investment as well as custom and packaged software investment, we use the JSNA data to construct computerized information as much as we can. (2)Copyright and license costs →Entertainment and artistic originals..")
7
The Measurement of Intangible Investment by Industry in Japan contd. The amount of intangible investment in the 2000s is about 40 trillions of JPY. It has declined since the Leaman Shock. In particular, investment in economic competencies has declined since 2000, due to the harsh restructuring that occurred after the financial crisis in Japan. Intangible investment in the IT industries accounts for over 60% of total intangible investment.

8
Estimated Intangible Investment in Japan

9
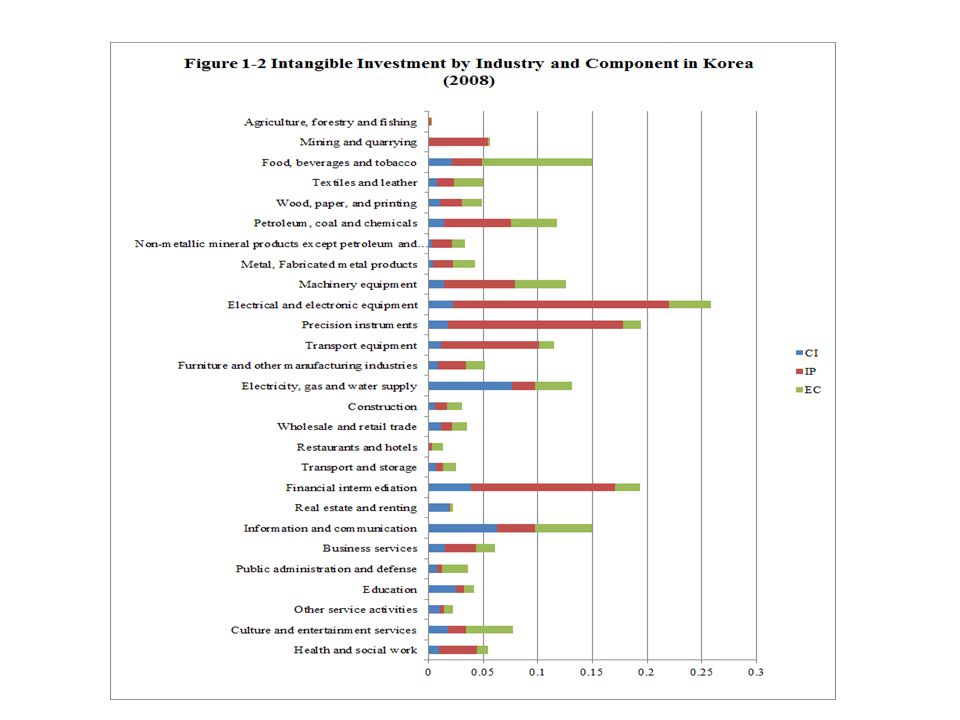
Comparison of Intangible Investment between Japan and Korea The ratio of intangible investment to GVA in Japan is greater than Korea. However, the gap between Japan and Korea has contracted since 1990. In some service industries, the intangible investment/GVA ratios in Korea have surpassed those in Japan. In particular, investment in computerized information in service industries is greater than that in Japan.

10
Intangible Investment/GVA Ratio in Japan and Korea

11
Intangible Investment/GVA Ratio by Industry in Japan and Korea

14
Capital Stock in Intangibles in Japan When we construct capital stock in intangibles using the perpetual inventory method, we use two types of depreciation rates; the first type follows Corrado et al. (2013) and the second type is measured from our own survey on intangibles. As Japanese firms expect stock in innovative property to deteriorate rapidly, depreciation rates of assets in innovative property are larger than those measured by Corrado et al. (2013).
 and the second type is measured from our own survey on intangibles. As Japanese firms expect stock in innovative property to deteriorate rapidly, depreciation rates of assets in innovative property are larger than those measured by Corrado et al. (2013)..")
15
Depreciation rates for intangible assets

16
Capital Stock in Intangibles in Japan contd. The amount of intangible assets in Japan is 167 trillions of JPY, when we use the depreciation rates developed by Corrado et al. (2013). However, the amount of intangible assets using alternative depreciation rates is 124 trillion of JPY in 2010 due to the decrease in assets in innovative property. In both cases, the growth rate in capital stock in intangibles has slowed down since 1990. In particular, the growth rate in economic competencies turned negative in the 2000s. In some service industries, the growth rates in intangibles also turned negative in the 2000s.
. However, the amount of intangible assets using alternative depreciation rates is 124 trillion of JPY in 2010 due to the decrease in assets in innovative property. In both cases, the growth rate in capital stock in intangibles has slowed down since In particular, the growth rate in economic competencies turned negative in the 2000s. In some service industries, the growth rates in intangibles also turned negative in the 2000s..")
17
Capital Stock in Intangible Assets in Japan (Corrado et , al.’s case)
")
18
Capital Stock in Intangible Assets in Japan (based on the Japanese survey)
")
20
Growth Accounting with Intangibles When we conduct growth accounting with intangibles, the role of intangible assets on economic growth has increased since 1995. In particular, accumulation in intangibles plays a key role in economic growth in the service sector and the IT industries. We find that the effects of intangibles on economic growth are concealed in capital accumulation and TFP growth in traditional growth accounting.

21
Growth Accounting with Intangibles and a Traditional Growth Accounting

22
Growth Accounting with Intangibles contd. International comparison of growth accounting shows that the contribution of intangibles to labor productivity growth in Japan is the lowest in advanced countries. The growth strategy in Abenomics published last year emphasized that the government supports investment in tangible assets aggressively. However, the Japanese government should support intangible as well as tangible investment to restore the Japanese economy through change in industrial structure.

23
International Comparison of Growth Accounting

24
Thank you for your attention!

Similar presentations


 Hyunbae Chun (Sogang University) Keun Hee Rhee (Korea Productivity Center) The First World.>")
>")


 Gaaitzen J. de Vries GGDC and Faculty of Economics.>")
 IN COLLABORATION.>")


 Masahiro.>")