Download presentation
Presentation is loading. Please wait.

1
Land and Food Resources II

2
Review of Logging Methods

3
Menominee Forestlands as a Model Menominee tribal people once controlled about 1 million acres of land in Northeast Wisconsin and Michigan's Upper Peninsula; treaties in the 1850s confined the tribe to their current Reservation lands, totaling 235,000 acres. Longest running operation for sustained-yield forestry in the nation. Densest, most diverse forests in Great Lakes.

4
Menominee Forestlands as a Model Tribe recognized that their future depended on the forest and embarked on a course of sustained yield management to avoid forest exploitation and preserve Tribal existence. In order to survive off of their limited land base, the Tribe decided that it must harvest timber, but must maintain and perpetuate the forest resources for future generations.

5
Menominee Forestlands as a Model Long-term yields: 1. Maintain the mix of hardwoods (sugar maple, beech, hemlock, basswood). 2. Mimicking fire- succession. 3. Cutting the worst first. The basic concept used was to harvest timber from one end of the reservation to the other in such a manner that when done, the first areas cut would be ready for cutting again.
. 2. Mimicking fire- succession. 3. Cutting the worst first. The basic concept used was to harvest timber from one end of the reservation to the other in such a manner that when done, the first areas cut would be ready for cutting again..")
6
Menominee Forestlands as a Model Tribe considers itself a part of the ecosystem and the Tribe's survival depends on managing and protecting the forest ecosystem. The Tribe's land ethic and management philosophy contain the 3 components of a sustainable system. 1. 1.It must be sustainable for future generations. Must cut trees across the Reservation at a rate that there will always be timber ready to cut. 2. 2.The forest must be cared for properly to provide for the needs of people. Must conserve the productive capacity of the land in order to sustain the Tribe's economy. 3. 3.Keep all the pieces of the forest. Must maintain diversity.

7
U.S. Forest Service (USFS) USFS supplies cheap logs to the nations timber industry. Charges for timber sales have not been enough to repay management costs, cleanup of logging debris, and replanting of forests. Charges for timber sales have not been enough to repay management costs, cleanup of logging debris, and replanting of forests. In 1997, the net loss on U.S. Forest Service timber sales was $1.2 billion. (This estimate includes road-building costs.) Of 104 National Forests, 83 lost money on timber sales.
 Of 104 National Forests, 83 lost money on timber sales..")
8
U.S. Forest Service (USFS) In the past 40 years, USFS has made 340,000 miles of roads (10 times the interstate highway system). Value of Road-less Areas: 1. Supply clean drinking water 2. Decreases habitat fragmentation (lynx, wolverines, and marten, pygmy owls, trillium). 3. Provide habitat that is resistant to invasion by exotic species. 4. Provides unique recreational opportunities 4. Provides unique recreational opportunities.
 In the past 40 years, USFS has made 340,000 miles of roads (10 times the interstate highway system). Value of Road-less Areas: 1. Supply clean drinking water 2. Decreases habitat fragmentation (lynx, wolverines, and marten, pygmy owls, trillium). 3. Provide habitat that is resistant to invasion by exotic species. 4. Provides unique recreational opportunities 4. Provides unique recreational opportunities..")
9
National Protected Areas

10
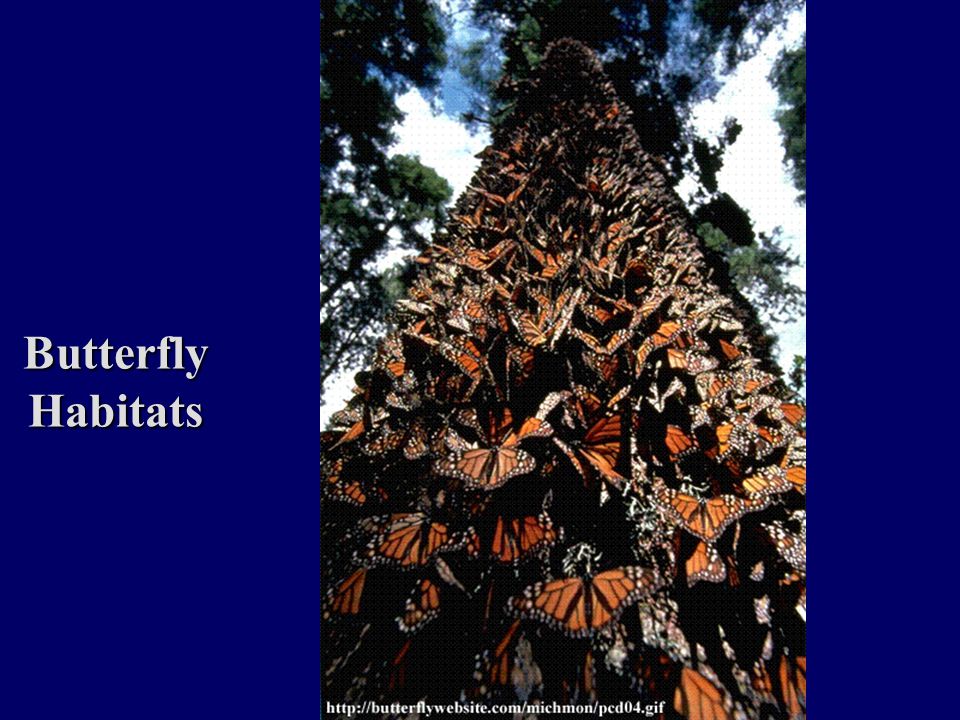
Butterfly Habitats

12
Pacific Northwest - Temperate Rainforest Include Redwoods, Red Cedar, Douglas fir, Hemlock, and Sitka spruce. Forests are complex and diverse. Vaux’s swift and marbled murrelet live nowhere else. Now, less than 10% of the forest remains, with 80% scheduled to be cut. In 1989 environmentalists sued, using the Endangered Species Act and the Spotted Owl as their defense.

13
150,000 people in Pacific Northwest are employed because of forest products. Logging jobs are disappearing (recreation jobs may provide more jobs). Loss mainly due to mechanization, shipping of raw lumber to Japan mill, and harvested of 90% of forests.
. Loss mainly due to mechanization, shipping of raw lumber to Japan mill, and harvested of 90% of forests..")
14
Wetlands Wetlands are transitional areas between terrestrial and aquatic ecosystems. Wetlands provide not only habitat for wildlife but also aid in the recharging of the groundwater and reducing the effects of changes in river level by providing flood zones.

15
Wetlands and Forests

16
Wetlands - Economics Wetlands are important from an economic standpoint. It is estimated that the bottomland hardwood and cypress swamps of the Southeastern part of the United States are worth over $8 billion. Waterfowl hunters spend over $600 million annually in pursuit of wetland-dependent birds, with a large percentage of this money going directly to wetland habitat protection.

17
Wetlands – Flood Control Wetlands play an important role in flood control. It is estimated that storm and flood damage exceeds $1 billion annually in the United States. Wetlands intercept storm waters, thereby moderating sharp runoff peaks to slower discharges over longer periods of time. Wetland vegetation serves to stabilize landforms and protect development.

18
Wetlands – Water Quality Wetlands have been shown to remove organic and inorganic nutrients and toxic materials from the water that flows across them. Wetlands remove sediments, and remove or filter excess nutrients. These wetlands improve water quality just as a water treatment plant costing millions of dollars to build.

19
Wetlands - Destruction Wetlands are most endangered by agriculture, fossil fuel exploration and exploitation, construction of energy projects (e.g., dams), and development. Wetlands are shrinking in the USA at about 117,000 acres per year. About 75% of remaining USA wetlands in private ownership.

20
How is Land Distributed Globally? Not that long ago, natural areas were considered essentially limitless. Now, emphasis is on preservation of natural areas. How much of that 37% is enough?

21
What Is To Be Done? 1.Encourage reassessment of taxes on private agricultural land near urban centers. 2.Require thorough public review and planning of land use. Review procedures of long-standing. 3.Balance interests in management of Federal lands. Wise-use movement Environmental movement

23
Food Crops and Biodiversity Human beings have used about five thousand species of plants as food, but only 150 or so have entered world commerce. Fifteen crops provide most of the world's food, and three crops - wheat, rice, and maize - account for roughly 60 percent of the calories and 56 percent of the protein that humans consume directly from plants.

24
Food Crops and Biodiversity Forty percent of an estimated 2,300 species of cultivated plants belong to just four families: Graminae (grasses), Leguminosae (legumes), Rosaceae (apples, pear, etc.), and Solanaceae (potatoes). The grass family - including such crops as wheat, rice, maize, barley, sorghum, millet, oats, and rye - provides some 80 percent of calories consumed by humans.

25
Origins of Major Food Crops Many of the major food crops originated in regions that are not particularly species rich. Crops were domesticated in warm temperate and subtropical zones and in tropical mountainous regions. Wheat and barley were first grown in the steppes and woodlands of southwestern Asia, and the origin of maize has been traced to the seasonally dry central highlands of Mexico. The highlands of Peru contributed the tomato and potato (though the tomato was probably first cultivated in Mexico).
..")
26
Origins of Major Food Crops Most important food crops appear to have originated where seasons are pronounced. In part this is due to the tendency of plants in seasonal environments to store nutrients during the growing season. Often, these reserves are what human eat. Much of the world's agriculture is based on introduced crops.

27
Origins of Major Food Crops In developing countries in the Americas, only 32 percent of production is of crops of American origin. The comparable figure for African developing countries is 30 percent of crop production is native plants. Only in Asian developing countries is most production - 70 percent - by native species.

28
Origins of Major Food Crops Dependence on introduced species reaches its extreme in Australia, the Mediterranean, northern Europe, northern Asia, and the United States and Canada. In these regions, more than 90 percent of production is derived from introduced species. None of the world's fifteen most important food crops are native to Australia or to North America north of Mexico.

29
World Food Issues Amounts (famine) DistributionPoverty Types of food available (malnourishment compared to undernourishment)
 DistributionPoverty Types of food available (malnourishment compared to undernourishment)")
30
Grain Production Conclusion – at the moment supply keeping up with population growth.

31
World Production Major Food Crops

32
Regional Differences in Food Production

33
Regional Differences in Food Availability

34
Distribution of Food Most of the 183 countries of the world are now to some degree dependent on food imports. These imports come from cereal surpluses produced in only a few countries that have a relatively low population density and intensive agriculture. For instance, in the period 1989-1991, the United States, Canada, Australia and Argentina provided about 81% of net cereal export on the world market

35
Differences in Food Usage Rice, which has origins in either India or China, is the eighth most important crop in the developed world (by weight). However, rice is by a factor of two the leading crop in the developing world, and it is the most important source of calories in tropical developing countries.

36
Cassava is a high- yield, starchy, low protein (<1%) staple. Similarly to rice, cassava (manioc) - native to tropical America - is not grown in developed countries but is the fourth most important crop in the developing world (by weight) and provides more than half of the caloric requirements for over 420 million people in 26 tropical countries. Differences in Food Usage
 - native to tropical America - is not grown in developed countries but is the fourth most important crop in the developing world (by weight) and provides more than half of the caloric requirements for over 420 million people in 26 tropical countries. Differences in Food Usage.")
37
Food Resources - Figures Over the past 20 years World food production has increased by 2.1% per year. There is enough food globally to give everyone 2,700 calories per day. The minimum requirement is 2,100 calories per day and malnourishment is considered to be anything lower than 1,800 calories per day. In the developing countries of the world one in five people do not have enough food to meet their daily requirements.

38
Take Home Message One person dies each and every second from starvation and its related diseases. Three-quarters of those are children under the age of five. Three children died in the time it took you to read this short paragraph. Global food production outstrips the population!!!!! Yet, 800 million people are malnourished!!!!! Yet, 800 million people are malnourished!!!!!

39
Number of Undernourished People (1969-1997) Undernourished people (millions) 1969-711979-811990-921995-97 Sub-Saharan Africa 89126164180 Near East & North Africa 45222633 East & South-East Asia 504406283241 South Asia 267338299284 Latin America & Caribbean 54465953 Industrialized countries n/an/a98 Countries in transition n/an/a2026 TOTALS959938860825 Source: FAO (1999)
 Undernourished people (millions) Sub-Saharan Africa Near East & North Africa East & South-East Asia South Asia Latin America & Caribbean Industrialized countries n/an/a98 Countries in transition n/an/a2026 TOTALS Source: FAO (1999)")
40
Distribution of Malnourishment

41
Farming

42
General Types of Agriculture In highly developed countries the main type of agriculture is high-input agriculture (i.e., lots of energy, fertilizers, pesticides) which produces high yields. In developing countries practice subsistence agriculture, which does not produce enough surplus crops to sell or to store for later need. USA Grain Yields

43
Types of Subsistence Agriculture Slash and burn (aka shifting agriculture) Nomadic herding - mainly in the areas of Northwest Asia, the Middle East, North Africa and the Arctic Tundra. Polyculture

44
Genetic Diversity in Food Crops Genetic diversity can enhance crop production. Several varieties can be planted in the same field to minimize crop failure, and new varieties can be bred to maximize production or adapt to adverse or changing conditions As important as genetic diversity is to increasing yields, it is at least as important in maintaining existing productivity because of factors like coevolution. Over 400 species of pests now resist one or more pesticides, and the proportion of U.S. crops lost to insects has approximately doubled - to 13 percent - since the 1940s, even though pesticide use has increased.

45
History of Plant Breeding An Assyrian relief carving from 870 B.C. showing artificial pollination of date palms. For several thousand years, farmers have been altering the genetic makeup of the crops they grow. Human selection for features such as faster growth, larger seeds or sweeter fruits has dramatically changed domesticated plant species compared to their wild relatives.

46
Genetically Modified (GM) Crops Most new genetic engineering techniques initially involve single-gene modifications of species, and in many cases such modifications are less useful than the multiple-gene changes that result from traditional breeding programs. Maize Maize genetically modified to produce Bt protein Bt protein kills the corn borer insect

47
Biodiversity of Food

48
Risks of High-Yielding Crop Varieties Whereas traditional mixed farming systems produce modest but reliable yields, planting a single modern crop variety over a large area can result in high yields but the crop may be extremely vulnerable to pests, disease and severe weather. The results may be substantial loss of yield (e.g., the 1970 loss of more than 15% of corn crop to a fungus). Single crop agriculture has a history of producing famines when an organism of opportunity destroys that crop.
. Single crop agriculture has a history of producing famines when an organism of opportunity destroys that crop..")
49
Loss of Crop Diversity

50
Problems with Genetic Uniformity Genetic diversity provides the variation within species that allows populations to adapt to changes in climate and other local environmental conditions. Without a constant infusion of new hardy genes into our crop species, pests and diseases could quickly get out of hand. Already more than 400 species of crop pests have developed resistance to one or more of the pesticides used to control them.

51
National Plant Germplasm System (NPGS) NPGS is a cooperative effort by public (State and Federal) and private organizations to preserve the genetic diversity of plants. The NPGS acquires, preserves and distributes crop germplasm. There is also a National Animal Germplasm Program under development.

52
Approximately 99% of the world food supply is derived from terrestrial ecosystems with the percentage from aquatic systems shrinking. The availability of arable land at world level is less than 0.27 ha per capita, lower than it has ever been in history, and much less than the average of 0.7 ha per capita in the United States. Note that 0.5 ha per capita has been suggested as the minimum requirement for a diverse diet of animal and plant food products Sources of Food

53
Fisheries Basic problem with ocean fisheries is the issue of the tragedy of the commons. No single nation may legislate or enforce policies.

54
Fish Farms (Aquaculture) Are fresh water and marine water facilities. Approximately 1/3 of the shrimp consumed globally are from aquaculture sources. More than 50% of salmon consumed is raised on fish farms.

55
Fish Farms (Aquaculture) Farmed fish are frequently fed on meal made from wild-caught fish. In 2000, Goldburg co- authored a paper revealing that 1.9 kilograms of wild fish were on average required to produce every 1 kg of fish farmed in 1997.

Similar presentations