Download presentation
Presentation is loading. Please wait.

1
Predicting Mathematics-Related Educational and Career Choices Mina Vida and Jacquelynne Eccles University of Michigan Acknowledgements: This research was funded by grants from NIMH, NSF, and NICHD to Eccles and by grants from NSF, Spencer Foundation and W.T. Grant to Eccles and Barber. The authors want to thank Bonnie Barber, Margaret Stone, Laurie Meschke, Lisa Colarossi, Deborah Jozefowicz, and Andrew Fuligni for their role in study design, data collection, and data processing.

2
M/S/E undergraduate majors In 2000, women represented * 50% of M/S/E degree recipients * 77% of psychology majors * 56% of biology majors * 54% of social science majors Source: Science and Engineering Degrees: 1966-2000

3
Bachelor’s degrees in 2000 PercentsWomenMen Total M/S/E 28.036.9 Physical 0.81.6 Engineering 1.78.8 Math/CS 2.26.2 Earth 0.20.5 Biological 6.56.8 Social 8.69.7 Psychology 8.03.3 Source: NSF 02-327

4
Participation in M/S/E careers In 1997, women represented * 23% of all scientists and engineers * 63% of psychologists * 42% of biologists * 10% of physicists/astronomers * 9% of engineers Source: National Science Foundation, 2000

7
MSALT Sample General Characteristics School based sample drawn from 10 school districts in the small city communities surrounding Detroit. Predominantly White, working and middle class families Approximately 50% of sample of youth went on to some form of tertiary education Downsizing of automobile industry caused major economic problems while the youth were in secondary school

8
Specific Sample Characteristics for Analyses Reported Today Those who participated at Wave 8 (age 25) Female N = 791 Male N = 575 Those who completed a college degree by Wave 8 Female N = 515 Male N = 377
 Female N = 791 Male N = 575 Those who completed a college degree by Wave 8 Female N = 515 Male N = 377")
9
Predicting # of Honors Math Classes.15.14.12.13.25.18 Gender Self-Concept Of Ability In Math (R 2 =.06) Self-Concept Of Ability In Math (R 2 =.06) Interest In Math (R 2 =.02) Interest In Math (R 2 =.02) Number of Honors Math Courses (R 2 =.19) Number of Honors Math Courses (R 2 =.19) Math Aptitude Math Aptitude Utility of Math (R 2 =.04) Utility of Math (R 2 =.04)
 Self-Concept Of Ability In Math (R 2 =.06) Interest In Math (R 2 =.02) Interest In Math (R 2 =.02) Number of Honors Math Courses (R 2 =.19) Number of Honors Math Courses (R 2 =.19) Math Aptitude Math Aptitude Utility of Math (R 2 =.04) Utility of Math (R 2 =.04)")
10
Predicting # of Physical Science Classes (sex, DAT) Number of Physical Science Courses (R 2 =.15) Number of Physical Science Courses (R 2 =.15) Gender Math Aptitude Math Aptitude.34.16
 Number of Physical Science Courses (R 2 =.15) Number of Physical Science Courses (R 2 =.15) Gender Math Aptitude Math Aptitude.34.16")
11
Predicting # of Physical Science Classes.08.10.16.15.29.12.32 Gender Self-Concept Of Ability In Math (R 2 =.11) Self-Concept Of Ability In Math (R 2 =.11) Interest In Math (R 2 =.02) Interest In Math (R 2 =.02) Number of Physical Science Courses (R 2 =.21) Number of Physical Science Courses (R 2 =.21) Math Aptitude Math Aptitude Utility of Math (R 2 =.04) Utility of Math (R 2 =.04).11.13
 Self-Concept Of Ability In Math (R 2 =.11) Interest In Math (R 2 =.02) Interest In Math (R 2 =.02) Number of Physical Science Courses (R 2 =.21) Number of Physical Science Courses (R 2 =.21) Math Aptitude Math Aptitude Utility of Math (R 2 =.04) Utility of Math (R 2 =.04).11.13")
12
New Analyses: Within Sex Discriminant Function Analyses Use 12 th grade Domain Specific Ability SCs and Values to predict College Major at age 25 Use age 20 General Ability SCs and Occupational Values to predict College Major at age 25

13
New Within Sex Discriminant Function Analyses: Part 2 Use 12 th grade Domain Specific Ability SCs and Values to predict Occupations at age 25 Use age 20 General Ability SCs and Occupational Values to predict Occupations at age 25

14
Time 1 Measures Math/Physical Science Self-Concept of Ability Math/PS Value and Usefulness Biology Self-Concept of Ability Biology Value and Usefulness English Self-Concept of Ability English Value and Usefulness High School Grade Point Average

15
Sex Differences in Domain Specific Self Concepts and Values

16
Time 2 Measures: Ability-Related Math/Science General Ability Self Concept Intellectual Ability Self Concept High School Grade Point Average

17
Time 2 Measures: Occupational Values Job Flexibility Mental Challenge Independence Working with People Autonomy

18
Time 2 Measures: Comfort with Job Characteristics Business Orientation: Comfort with tasks associated with being a supervisor People Orientation: Comfort working with people and children

19
Sex Differences in General Self Concepts and Values

20
Time 3 Measures Final College Major Occupation at Age 25: Coded into Global Categories based on Census Classification Criteria

21
Sex Differences in College Majors

22
Sex Proportions in College Majors

23
Sex Differences in Occupations

24
Sex Proportions in Occupations at 25

25
Predicting Women’s Math/Engineering/Physical Science (M/E/PS) and Biological Science College Major from Domain Specific SCs and Values at 18
 and Biological Science College Major from Domain Specific SCs and Values at 18")
26
Predicting Women’s M/E/PS and Biological Science College Major from General Self-Concepts and Values at 20

27
Predicting Men’s M/E/PS and Biological Science College Major from Domain Specific SCs and Values at 18

28
Predicting Men’s M/E/PS and Biological Science College Major from General Self-Concepts and Values at 20

29
Predicting Social Science vs All Other Majors from Domain Specific SCs and Values at 18

30
Conclusion 1: Strong support for the predictive power of constructs linked to the Expectancy Value Model. Domain Specific SCs and Values push both women and men towards the related majors Some evidence that more general values can also push people away from M/S/PS majors and towards Biology-Related majors

31
Next Step Do Within Sex Discriminant Function Analysis comparing Choice of Math/Science Major with Specific Alternative Major

32
Predicting M/E/PS vs. Biology Major From Domain Specific SCs and Values at 18

33
Predicting M/E/PS vs. Biology Major From General Self-Concepts and Values at 20

34
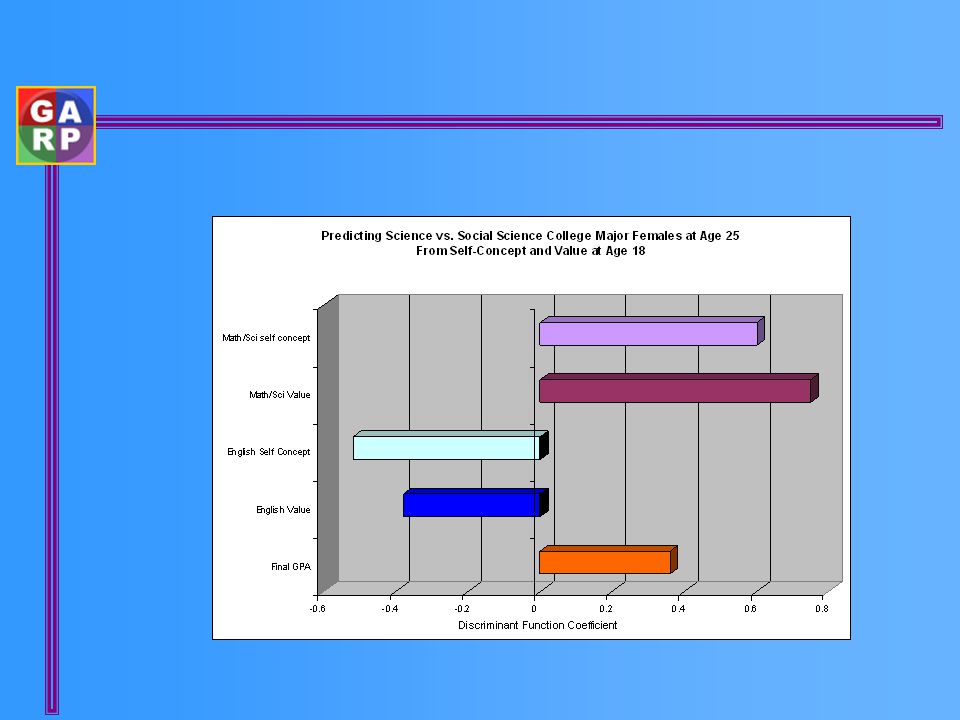
Predicting M/E/PS vs. Social Science Major From Self-Concepts and Values at 18

35
Predicting M/E/PS vs. Social Science Major From General Self-Concepts and Values at 20

36
Predicting M/E/PS vs. Business College Major From Self-Concepts and Values at 18

37
Predicting M/E/PS vs. Business College Major From General Self-Concepts and Values at 20

38
Conclusions 2 Even stronger support for both the push and pull aspects of the Eccles et al. Expectancy Value Model Strong evidence that valuing having a job that allows one to work with and for people pushes individuals away from M/E/PS majors and pulls them toward the Biological Sciences

39
New Analyses 2 Now lets shift to the second set of analyses: those linking self concepts and values from ages 18 and 20 to actual occupations at age 25

40
Predicting M/E/PS vs Biology Occupations at 25 from Self Concepts and Values at 18

41
Predicting M/E/PS vs Biology Occupation at 25 from General Self Concepts and Values at 20

42
Predicting M/E/PS vs Business Occupations at 25 From Self Concepts and Values at 18

43
Predicting M/E/PS vs Business Occupation at 25 from General Self Concepts and Values at 20

44
Final Conclusions

45
Thank You The End

47
Women and Men in Physical Science/Math versus Business Occupations

48
Predicting Science vs. College Major at 25 From Self-Concepts and Values at 20

Similar presentations


>")


: PACE Findings PACE Meeting at AAAS March 17 & 18, 2010 Funded by the Alfred P. Sloan Foundation.>")


, Pamela Davis-Kean (co-PI), and Oksana Malanchuk University of Michigan.>")