Download presentation
Presentation is loading. Please wait.

1
Viewing Changes Monitoring with Treemaps Steve Betten Catherine Plaisant Ben Bederson

2
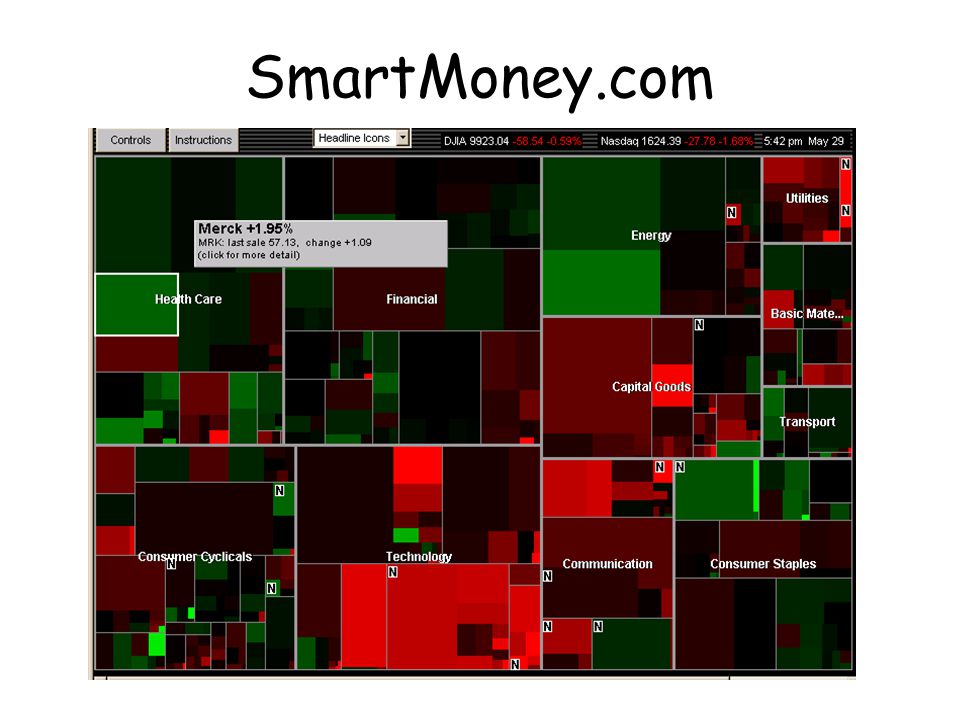
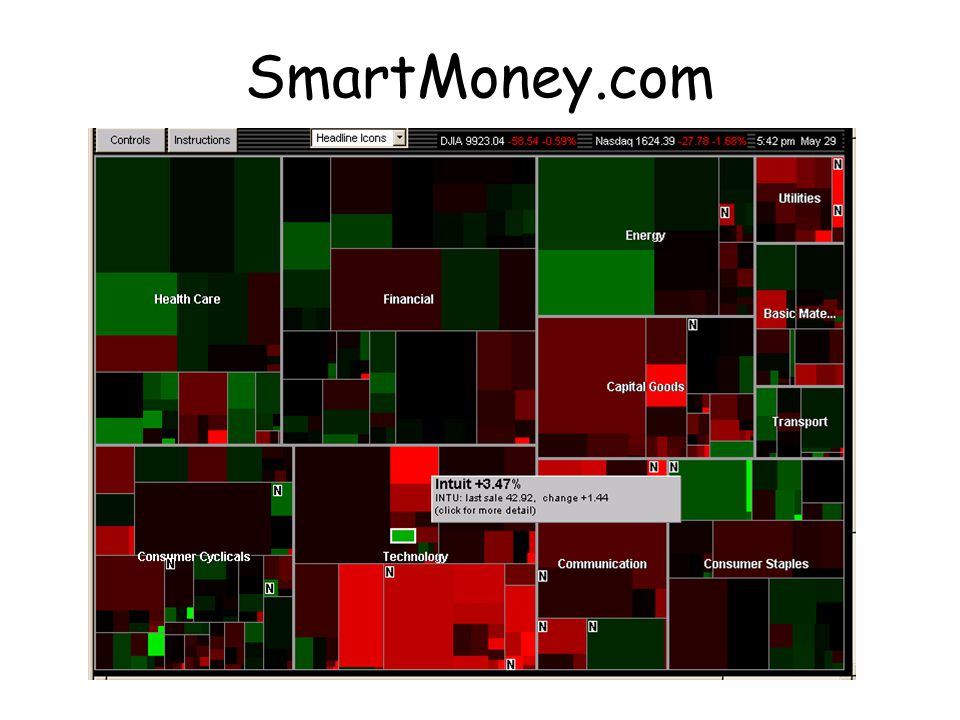
SmartMoney.com

5
A different emphasis SpaceTree Treemap

6
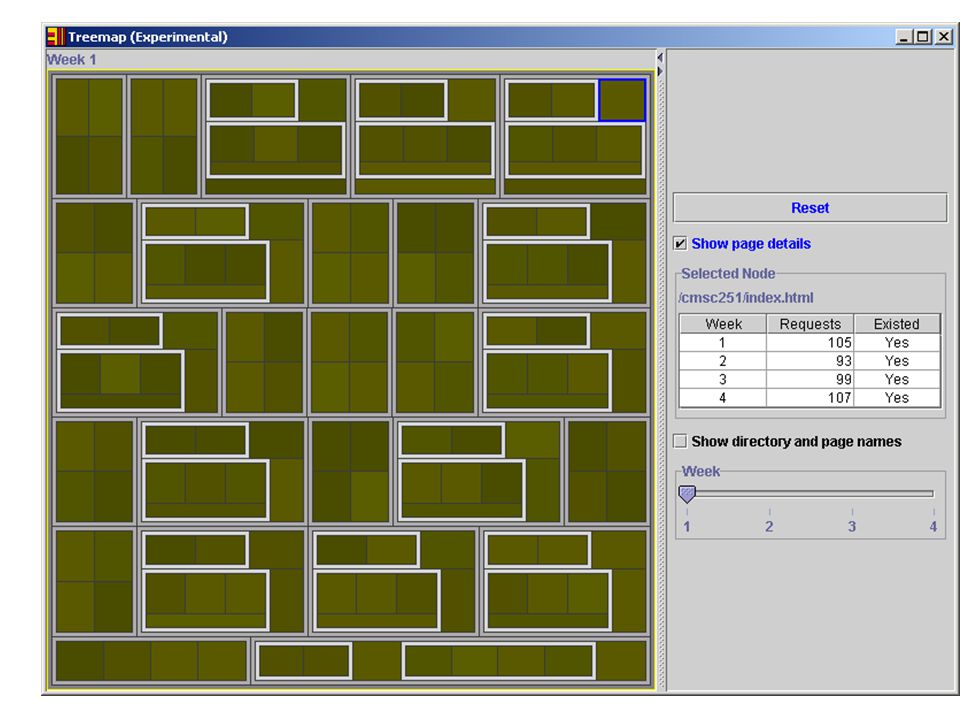
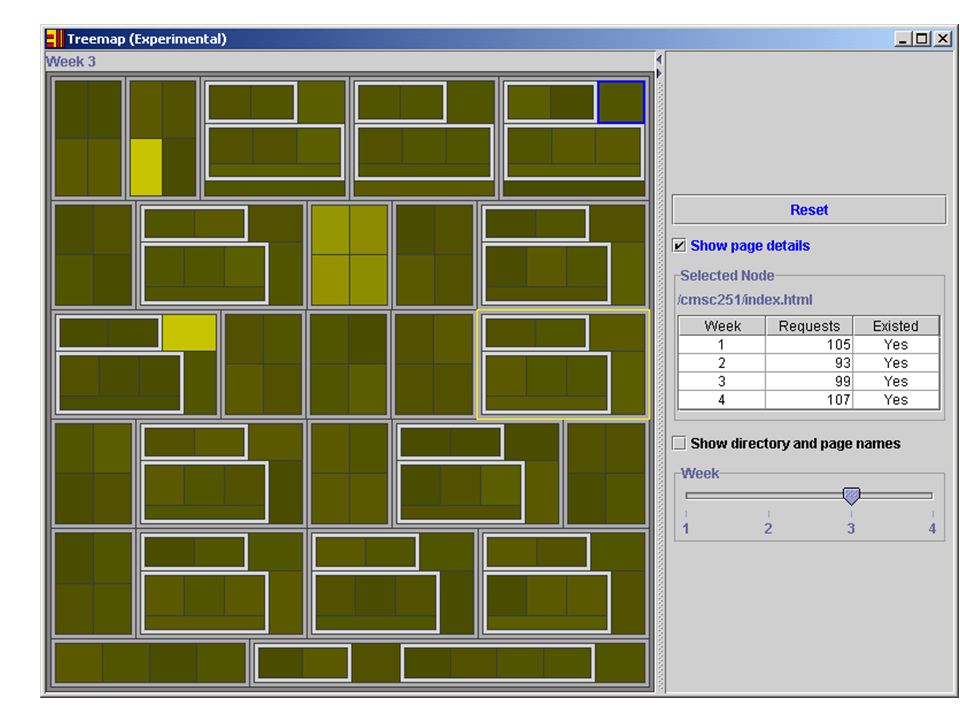
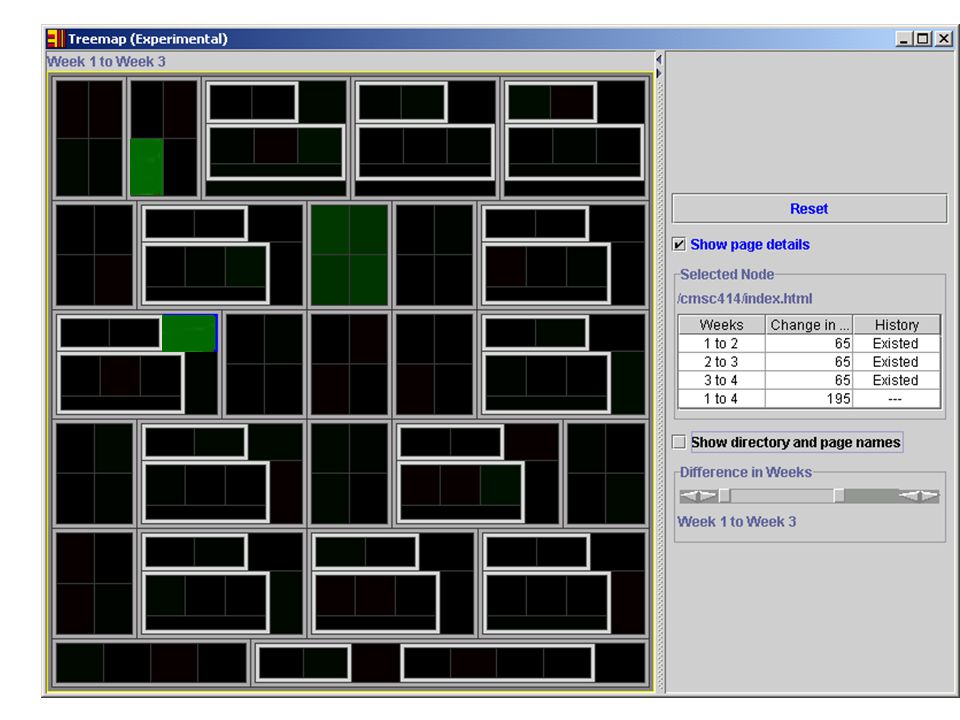
180 Pages on a Web Server (1 week) brightness = number of requests, no size coding i.e. layout stable as long as no page is added/removed

7
Treemaps for Monitoring Selected application: web site monitoring Monitoring: –Look for patterns in web page requests over consecutive time periods Attribute value changes Simplification: only one attribute (mapped to color) –Look for web pages that were created or deleted during those weeks Topology changes What are our options?
 –Look for web pages that were created or deleted during those weeks Topology changes What are our options")
8
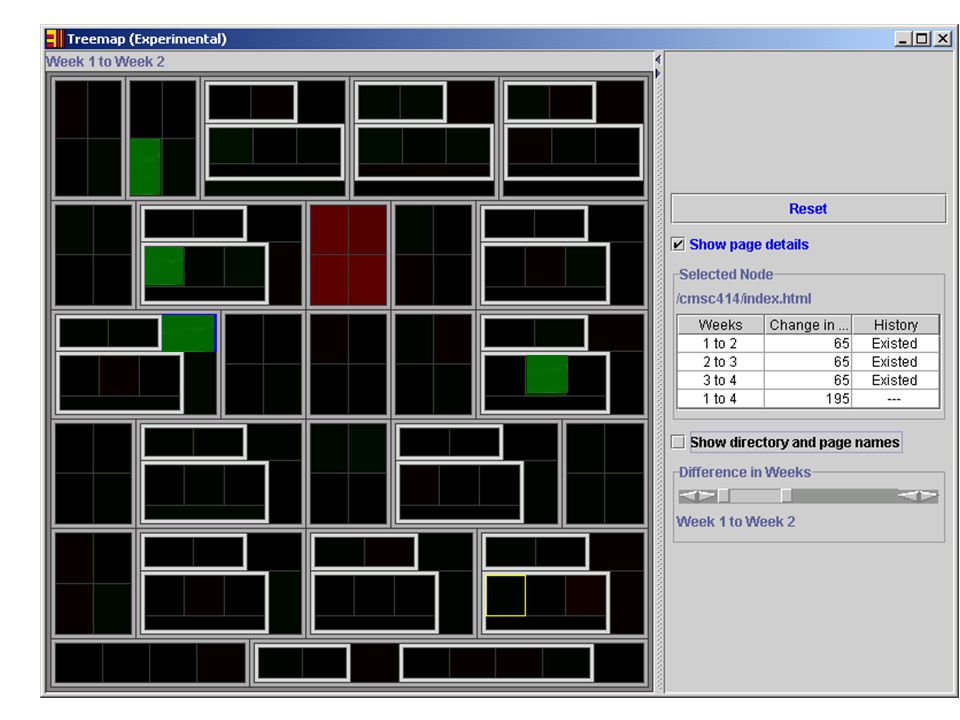
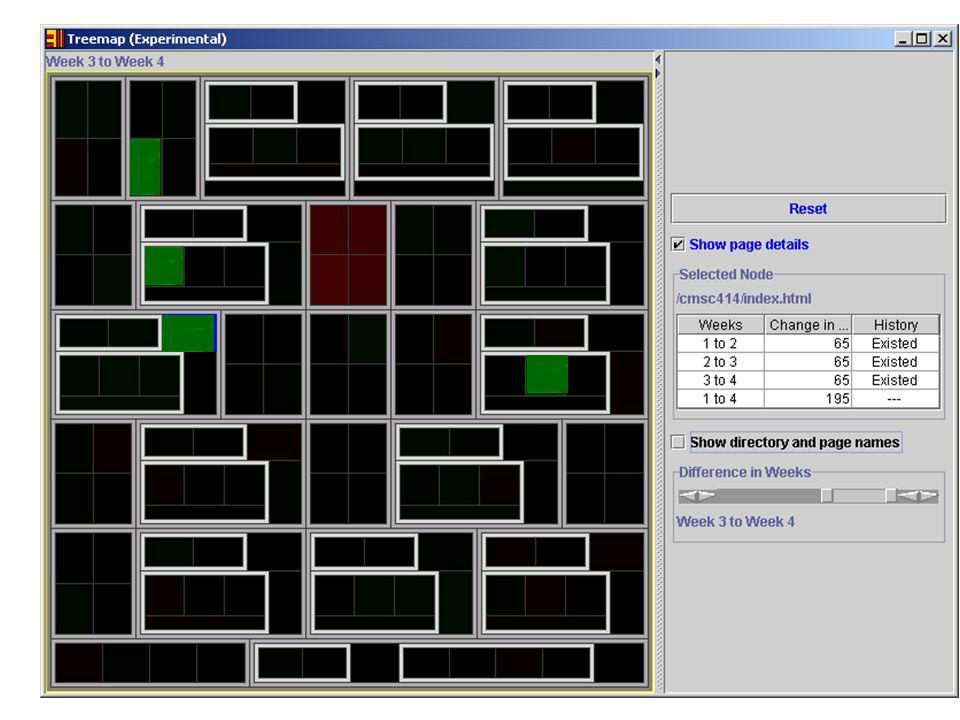
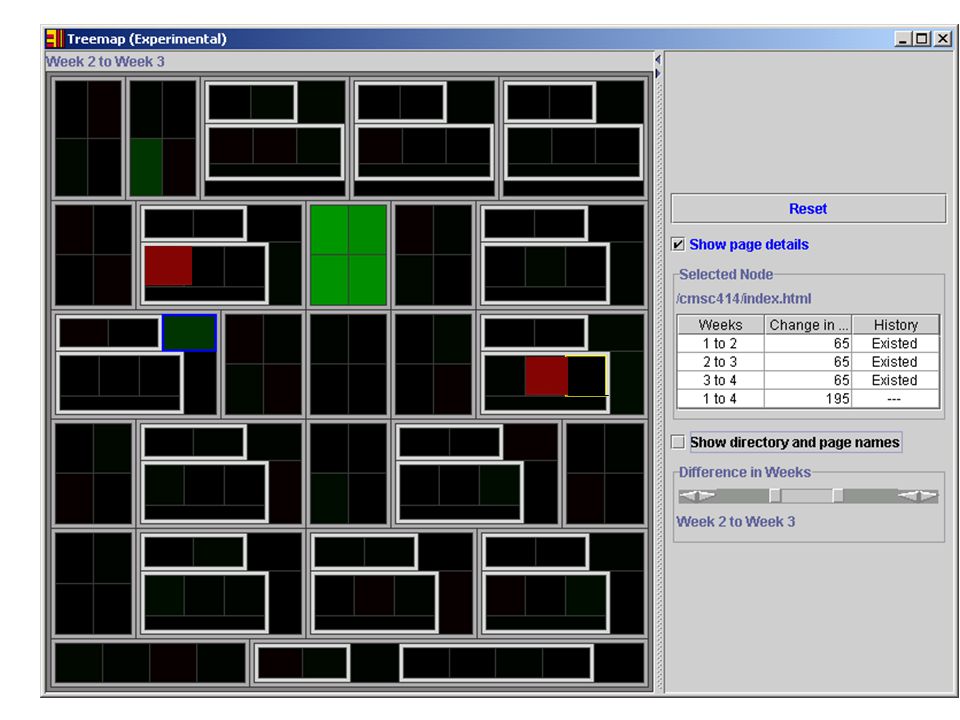
Choice of attribute “Value” “Difference of values” Change is immediately visible OK for 2 periods only Not clear what happen when users need to integrate colors changes over several periods. Might be more intuitive but requires to look at 2 values green = increase; red = decrease (brighter = more change) brighter = more requests
 brighter = more requests.")
9
Time vs. Space Multiplexing “All-at-once”“Slider” More pixels per page Generalizes to any number of periods Less need to interact All data available on one screen Fewer pixels per webpage

10
Main Experiment All-at-onceSlider Value Difference of values

11
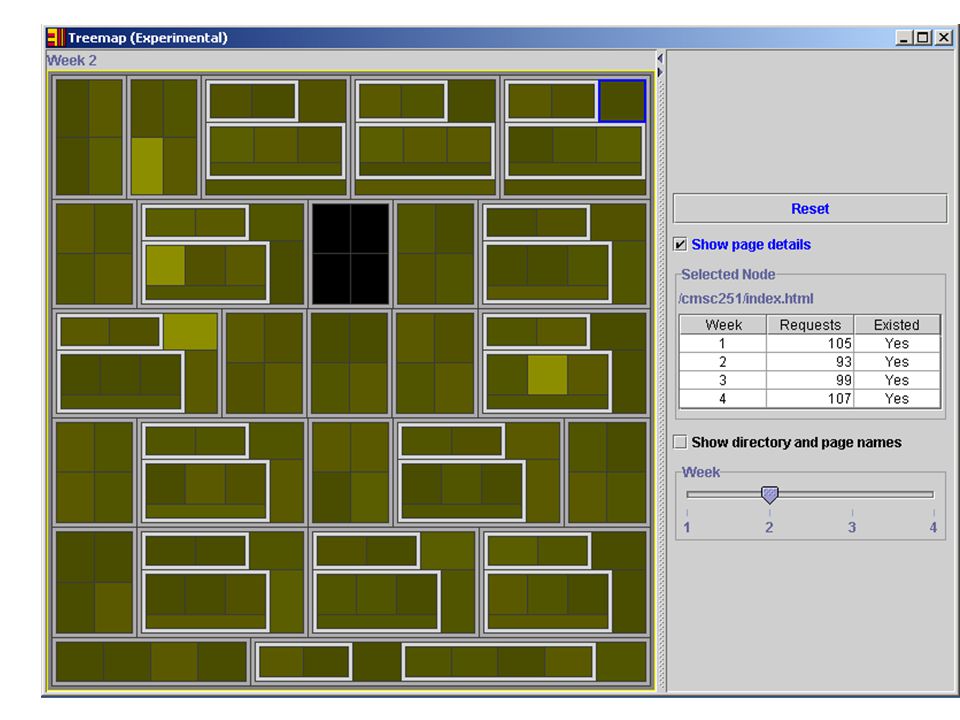
Additional small study looking at Page Creation/Deletion “Show only when existing” –Leads to layout shift –Intuitive: does not show pages that did not exist! “Always show” –Always show pages (colored black when non existing) –Precludes using size coding In both cases, small icons can show location of changes
 –Precludes using size coding In both cases, small icons can show location of changes.")
12
Procedure 12 subjects (CS students) –Each subject tested each version Training –10 min Treemap + 10 min each version Eight timed tasks Total duration: about 1 hour 30 minutes Computer generated datasets –Most pages have small changes –A small number of pages have significant changes
 –Each subject tested each version Training –10 min Treemap + 10 min each version Eight timed tasks Total duration: about 1 hour 30 minutes Computer generated datasets –Most pages have small changes –A small number of pages have significant changes")
13
Tasks 1.Determine if all the pages in a directory grew in popularity (2 tasks) 2.Find pages with specific patterns of requests e.g. up-down-up (2 tasks) 3.Find deleted pages 4.Find created pages and determine if they were popular the first time they existed 5.Determine if a specific page grew in popularity every week (with no pages added i.e. no possible layout shifts) 6.Same as 5 with some pages added ( i.e. possible layout shift)
 3.Find deleted pages 4.Find created pages and determine if they were popular the first time they existed 5.Determine if a specific page grew in popularity every week (with no pages added i.e. no possible layout shifts) 6.Same as 5 with some pages added ( i.e. possible layout shift).")
14
Results For many questions, users perform equally well using any combination When searching for patterns (e.g. up-down-up) –“Difference of values” faster than “value” –“Slider” faster than “all-at-once” In tasks where pages were created/deleted –“Always show” faster than “show only when existing” –Subjects strongly disliked layout shifts
 – Difference of values faster than value – Slider faster than all-at-once In tasks where pages were created/deleted – Always show faster than show only when existing –Subjects strongly disliked layout shifts.")
15
Results For many questions, users perform equally well using any combination When searching for patterns (e.g. up-down-up) –“Difference of values” faster than “value” –“Slider” faster than “all-at-once” In tasks where pages were created/deleted –“Always show” faster than “show only when existing” –Subjects strongly disliked layout shifts
 – Difference of values faster than value – Slider faster than all-at-once In tasks where pages were created/deleted – Always show faster than show only when existing –Subjects strongly disliked layout shifts.")
16
Main Experiment All-at-onceSlider Value Difference of values

20
Value and Slider (Week 4)
")
24
Results For many questions, users perform equally well using any combination When searching for patterns (e.g. up-down-up) –“Difference of values” faster than “value” –“Slider” faster than “all-at-once” In tasks where pages were created/deleted –“Always show” faster than “show only when existing” –Subjects strongly disliked layout shifts
 – Difference of values faster than value – Slider faster than all-at-once In tasks where pages were created/deleted – Always show faster than show only when existing –Subjects strongly disliked layout shifts.")
25
Results For many questions, users perform equally well using any combination When searching for patterns (e.g. up-down-up) –“Difference of values” faster than “value” –“Slider” faster than “all-at-once” In tasks where pages were created/deleted –“Always show” faster than “show only when existing” –Subjects strongly disliked layout shifts
 – Difference of values faster than value – Slider faster than all-at-once In tasks where pages were created/deleted – Always show faster than show only when existing –Subjects strongly disliked layout shifts.")
26
Main Experiment All-at-onceSlider Value Difference of values

27
Results For many questions, users perform equally well using any combination When searching for patterns (e.g. up-down-up) –“Difference of values” faster than “value” –“Slider” faster than “all-at-once” In tasks where pages were created/deleted –“Always show” faster than “show only when existing” –Subjects strongly disliked layout shifts
 – Difference of values faster than value – Slider faster than all-at-once In tasks where pages were created/deleted – Always show faster than show only when existing –Subjects strongly disliked layout shifts.")
28
Additional small study looking at Page Creation/Deletion Disliked the layout shifts In both cases users mostly used the small icons to see location of changes

29
Subjective Preference “Difference of values” preferred over “value” –Saves a step (visually determining the difference) –Easier to see hue shifts than intensity changes “All-at-once” v. “slider” –No difference Same pattern of preferences for “ease of learning” Subjects only used details table to check their guesses based on color alone Very few errors Only half of subjects adjusted the time interval in the “difference in values and slider” version User quote: “Different versions are suited to different tasks

32
Conclusions Treemaps can be effective for monitoring Consider using: –“difference of values” instead of “value” –“slider” with an option showing “all-at-once” Avoid size changes To download treemap3.2: www.cs.umd.edu/hcil/treemap3 (future versions will include monitoring capabilities described today) Partial support from Chevron-Texaco Participation of B. Shneiderman and J-D Fekete

Similar presentations


 417-430 Yee-Yin Choong, Gavriel Salvendy Report: Yang Kun, Ou.>")


2 Motivation “If you are not indexed by Google, you do not exist on the Web” --- news.com.>")


>")

