Download presentation
Presentation is loading. Please wait.

1
Chapter 7 Atmospheric Pressure and Wind
Pressure Essentials Atmospheric Patterns of Motion Horizontal Pressure Gradients Cyclones and Anticyclones

3
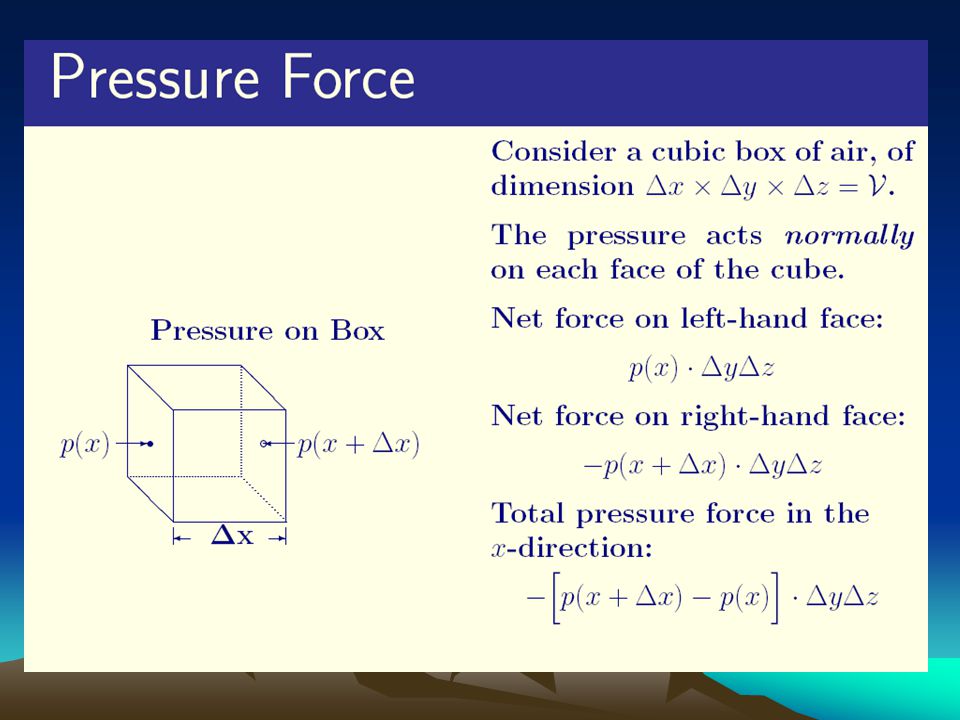
General Concept - Atmospheric (air) pressure: P
Definition: The pressure exerted by the mass of air above a given point. A function of density and temperature - P(sfc) is related to number of air molecules above - P(sfc) > P(h1) P(h1) Recall: in the atmosphere, air pressure decreases with height !! P(sfc)
 is related to number of air molecules above. - P(sfc) > P(h1) P(h1) Recall: in the atmosphere, air pressure decreases with height !! P(sfc)")
4
Pressure Essentials Pressure – force exerted/unit area (weight above you) units - Pascals (Pa) or millibars (mb) Sea level pressure (SLP) = mb Pressure important factor in controlling weather conditions wind, clouds, ppt.
 = mb. Pressure important factor in controlling weather conditions wind, clouds, ppt.")
5
Pressure Essentials (cont.)
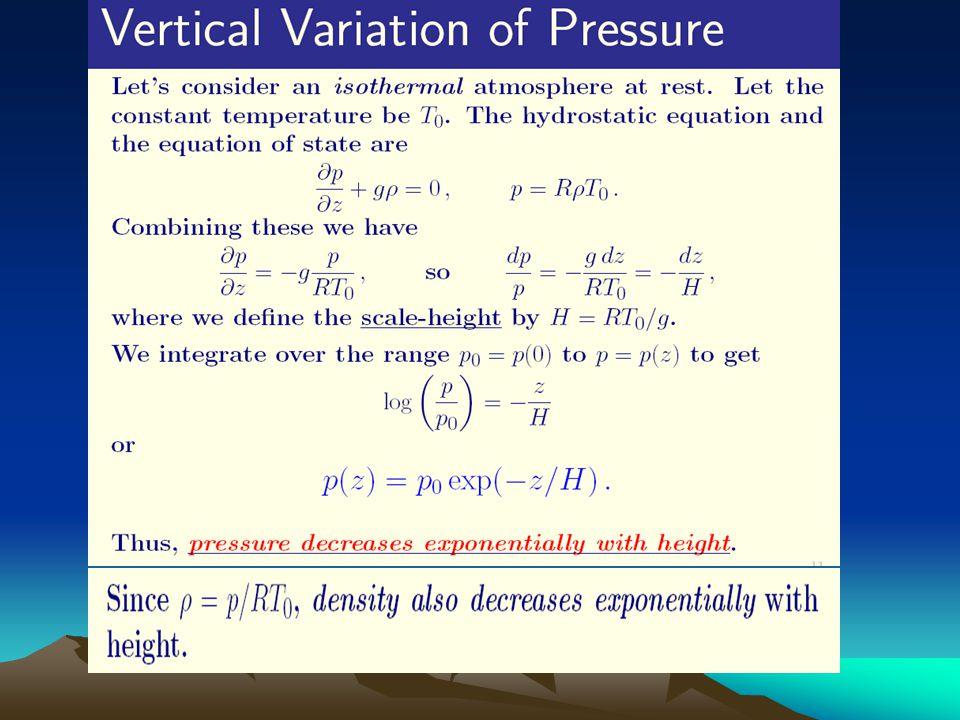
pressure can be increased by: increasing density Increasing temperature atmosphere is mixture of gases partial pressure Dalton’s Law: sum of partial pressures equals total pressure pressure decreases non-linearly with height

6
Vertical and Horizontal Changes in Pressure
Pressure decreases with height Compressibility causes a non-linear decrease with height

7
pressure will be less at P2 than at P1
due to pressure decreasing with height recording stations are reduced to sea level pressure equivalents pressure differences responsible for movement of air equilibrium

8
The Equation of State (Ideal Gas Law)
Pressure = density x temperature x 287 J kg-1 K-1 [ p = ρTR] describes relationships between pressure, temperature, and density at constant temperatures, an increase in air density will cause a pressure increase Under constant density, an increase in temperature will lead to an increase in pressure

9
pressure increased by increasing density (b) or temperature (c)
Molecular movement in a sealed container: pressure increased by increasing density (b) or temperature (c)
 or temperature (c)")
10
The Distribution of Pressure
Pressure maps depict isobars, lines of equal pressure Through analysis of isobaric charts, pressure gradients are apparent Steep (weak) pressure gradients are indicated by closely (widely) spaced isobars A weather map depicting the sea level pressure distribution for March 4, 1994
 pressure gradients are indicated by closely (widely) spaced isobars. A weather map depicting the sea level pressure distribution for March 4,")
11
Pressure Gradients The pressure gradient force initiates movement of atmospheric mass, wind, from areas of higher to areas of lower pressure Horizontal wind speeds are a f(x) of the strength of the pressure gradient
 of the strength of the pressure gradient.")
12
Horizontal Pressure Gradients
Typically only small gradients exist across large spatial scales (4% - continental scale) Smaller scale weather features, such as hurricanes and tornadoes, display larger pressure gradients across small areas
 Smaller scale weather features, such as hurricanes and tornadoes, display larger pressure gradients across small areas.")
17
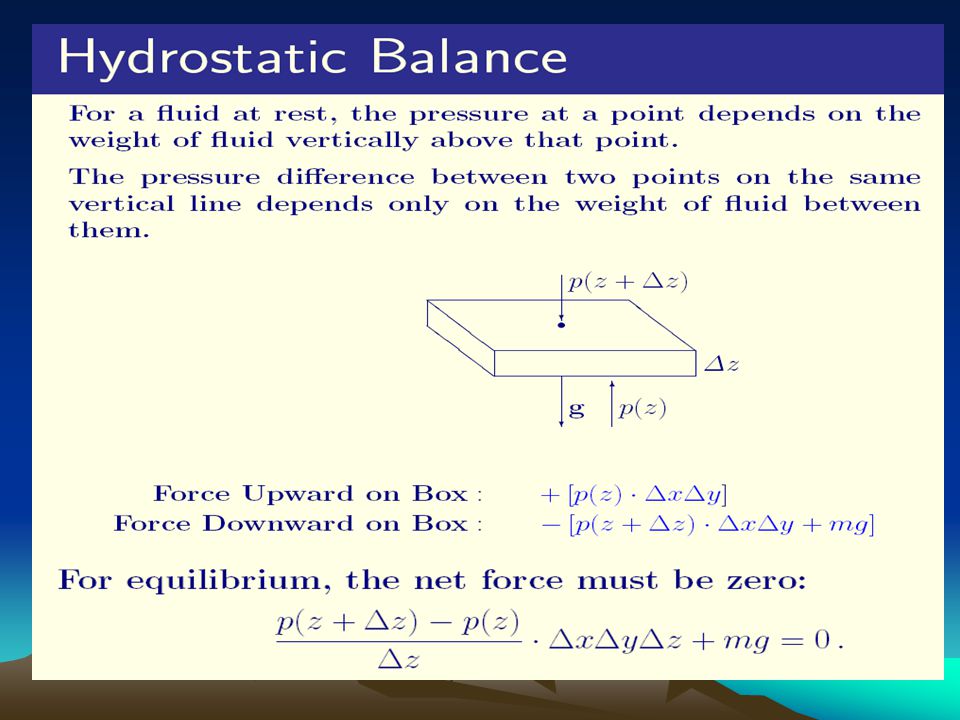
Hydrostatic Equilibrium
explains why air doesn’t continuously blow upward or get pulled downward The downward force of gravity is balanced by a strong vertical pressure gradient (VPG) creates hydrostatic equilibrium Local imbalances initiate various up- and downdrafts The Role of Density in Hydrostatic Equilibrium dense atmosphere experiences greater gravitational force force = mass x acceleration (gravity) to maintain hydrostatic equilibrium balanced by greater vertical pressure gradient force
 creates hydrostatic equilibrium. Local imbalances initiate various up- and downdrafts. The Role of Density in Hydrostatic Equilibrium. dense atmosphere experiences greater gravitational force. force = mass x acceleration (gravity) to maintain hydrostatic equilibrium balanced by greater vertical pressure gradient force.")
18
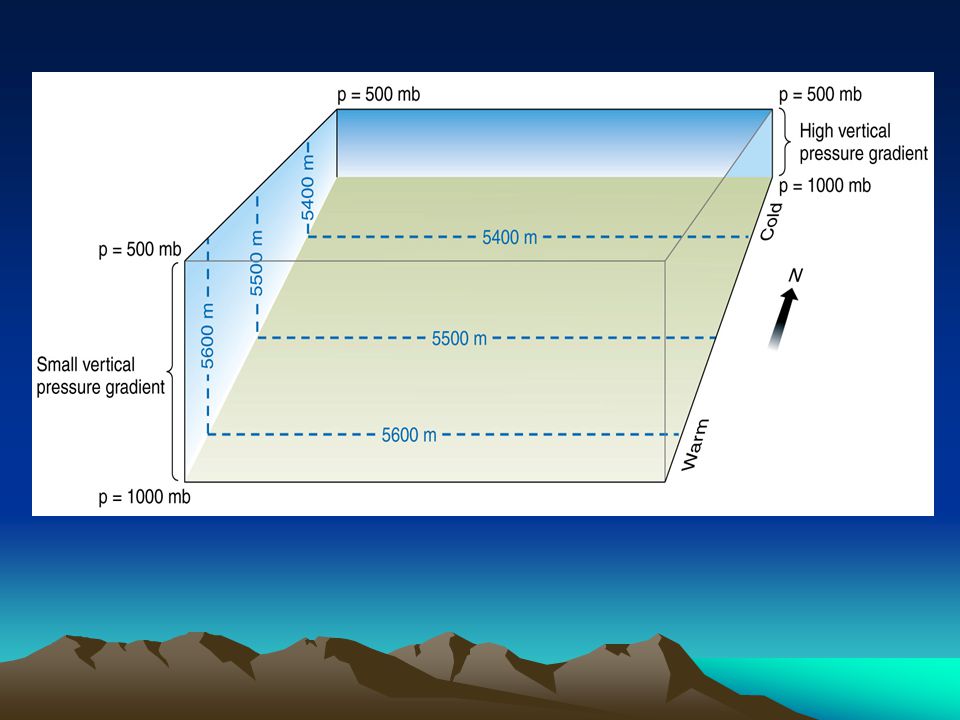
denser the atm, the greater the VPG and
the gravitational force (balance) heating causes density to decrease in a column of air the column contains the same amount of air, but has a lower density to compensate for its greater height the heated column has a lower VPG (the distance between 1000 mb and 500 mb has increased) the rate at which pressure decreases is f(x) of density
 heating causes density to decrease in a. column of air. the column contains the same amount. of air, but has a lower density to. compensate for its greater height. the heated column has a lower VPG (the. distance between 1000 mb and 500 mb. has increased) the rate at which pressure decreases is. f(x) of density.")
22
Height contours indicate the
pressure gradient 10% difference across North America can produce high winds in upper atmosphere 500 mb height contours for May 3, 1995

25
Ridges and troughs in the northern hemisphere

26
Maps depicting troughs, ridges, cyclones, and anticyclones

27
High pressure areas (anticyclones) clockwise airflow in the Northern Hemisphere (opposite flow direction in S. Hemisphere) Characterized by descending air which warms creating clear skies Low pressure areas (cyclones) counterclockwise airflow in N. Hemisphere (opposite flow in S. Hemisphere) Air converges toward low pressure centers, cyclones are characterized by ascending air which cools to form clouds and possibly precipitation In the upper atmosphere, ridges correspond to surface anticyclones while troughs correspond to surface cyclones
 counterclockwise airflow in N. Hemisphere (opposite flow in S. Hemisphere) Air converges toward low pressure centers, cyclones are characterized by ascending air which cools to form clouds and possibly precipitation. In the upper atmosphere, ridges correspond to surface anticyclones while troughs correspond to surface cyclones.")
Similar presentations


>")

