Download presentation
Presentation is loading. Please wait.

1
Feature Oriented Regional Modeling System -- FORMS: An Overview Avijit Gangopadhyay University of Massachusetts Dartmouth Email: avijit@umassd.eduavijit@umassd.edu Funded by NASA and ONR

2
OUTLINE Feature Oriented Regional Modeling System (FORMS) Concept -- Initialization/Synthesis Methodology Applications to different regions
 Concept -- Initialization/Synthesis Methodology Applications to different regions")
3
Gulf Stream Front and Ring Analysis

7
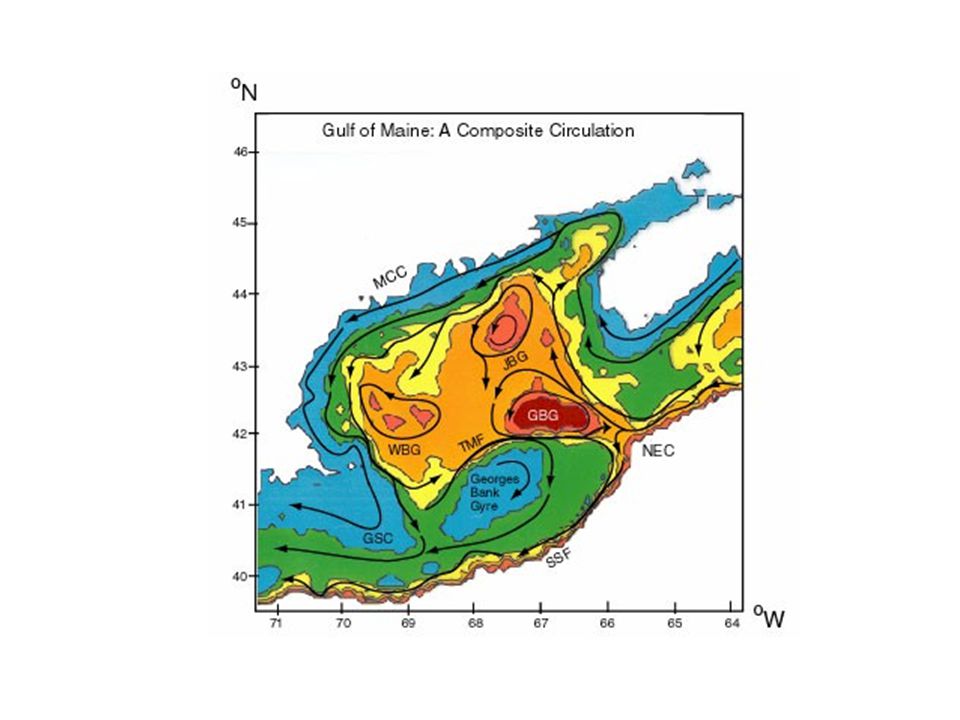
Features in Western North Atlantic Gulf Stream Warm Core Rings Cold Core Rings Southern Recirculation Gyre Northern Recirculation Gyre Deep Western Boundary Current Gangopadhyay et al., 3-part series in 1997: Journal of Atmospheric and Oceanic Tech. (14) 1314:1365 Maine Coastal Current NEC Inflow GSC Outflow Jordan Basin Gyre Wilkinson Basin Gyre Georges Basin Gyre Georges Bank Gyre Tidal Mixing Front Gangopadhyay et al. 2002 (Continental Shelf Res. In Press) Gangopadhyay and Robinson, 2002: DAO 36(2002) 201-232 Deep Sea region (GSMR) Coastal region (GOMGB)
 1314:1365 Maine Coastal Current NEC Inflow GSC Outflow Jordan Basin Gyre Wilkinson Basin Gyre Georges Basin Gyre Georges Bank Gyre Tidal Mixing Front Gangopadhyay et al (Continental Shelf Res. In Press) Gangopadhyay and Robinson, 2002: DAO 36(2002) Deep Sea region (GSMR) Coastal region (GOMGB).")
9
T(x,y,z)=T a (x,z)+ (x,z) (y) where, T a (x,z)={[T 0 (x)-T b (x)] (x,z) +T b } U(x,y,z)= (y){[U T (x)-U B (x)] (x,z) + U B (x)}
![T(x,y,z)=T a (x,z)+ (x,z) (y) where, T a (x,z)={[T 0 (x)-T b (x)] (x,z) +T b } U(x,y,z)= (y){[U T (x)-U B (x)] (x,z) + U B (x)}](http://images.slideplayer.com/16/4965209/slides/slide_9.jpg "T(x,y,z)=T a (x,z)+ (x,z) (y) where, T a (x,z)={[T 0 (x)-T b (x)] (x,z) +T b } U(x,y,z)= (y){[U T (x)-U B (x)] (x,z) + U B (x)}")
10
=tan Where, m is the melding function:

11
In general, a coastal current (CC), a front (SSF) and an eddy/gyre (E/G) are represented by: CC:T M (x, η, z) =T M a (x, z)+ α M (x, z) M (η) SSF:T ss (x, y, z) = T sh (x, z) + (T sl (x, z) – T sh (x, z)) ( , z) E/G:T(r, z) = T c (z) - [T c (z) - T k (z) ] {1-exp(-r/R)} where, T M a (x, z), T sh (x, z) and T c (z) are axis, shelf and core (η) = (0 W) ( , z) = ½ + ½ tanh[( - .Z)/ ]
![In general, a coastal current (CC), a front (SSF) and an eddy/gyre (E/G) are represented by: CC:T M (x, η, z) =T M a (x, z)+ α M (x, z) M (η) SSF:T ss (x, y, z) = T sh (x, z) + (T sl (x, z) – T sh (x, z)) ( , z) E/G:T(r, z) = T c (z) - [T c (z) - T k (z) ] {1-exp(-r/R)} where, T M a (x, z), T sh (x, z) and T c (z) are axis, shelf and core (η) = (0 W) ( , z) = ½ + ½ tanh[( - .Z)/ ]](http://images.slideplayer.com/16/4965209/slides/slide_11.jpg "In general, a coastal current (CC), a front (SSF) and an eddy/gyre (E/G) are represented by: CC:T M (x, η, z) =T M a (x, z)+ α M (x, z) M (η) SSF:T ss (x, y, z) = T sh (x, z) + (T sl (x, z) – T sh (x, z)) ( , z) E/G:T(r, z) = T c (z) - [T c (z) - T k (z) ] {1-exp(-r/R)} where, T M a (x, z), T sh (x, z) and T c (z) are axis, shelf and core (η) = (0 W) ( , z) = ½ + ½ tanh[( - .Z)/ ]")
12
Strategy for GOMGB MCC WBG JBG GBG GBAG TMF SSF Inflow/Outflow

13
FORMS Protocol Identify Circulation and Water mass features Regional Synthesis -- Processes from a modeling perspective Synoptic Data sets -- in-situ and satellite Regional Climatology (Background Circulation) OA (Climatology + Feature Models) Simulation -- Nowcasting/Forecasting
 OA (Climatology + Feature Models) Simulation -- Nowcasting/Forecasting")
14
FORMS Applications in Different Oceans Western north Atlantic – Operational modeling in GOMGB – AFMIS-RFAC Strait of Sicily – Dynamical analysis Monterey Bay real-time forecasting with ROMS – AOSN-II in summer 2003 -- Upwelling Brazil Current Meander-eddy-Upwelling System Persian Gulf, Arabian Sea – Rapid response Chilean Waters – Northern Humboldt Current – Biophysical modeling

16
Feature oriented methodology is applicable to ALL different Numerical Models MOM (Modular Ocean Model) POP (Parallel Ocean Program) ROMS (Regional Ocean Model System) POM (Princeton Ocean Model) MIT GCM HOPS (Harvard Ocean Prediction System) Finite Element / Finite Volume models It is an Initialization and Assimilation Methodology
 POP (Parallel Ocean Program) ROMS (Regional Ocean Model System) POM (Princeton Ocean Model) MIT GCM HOPS (Harvard Ocean Prediction System) Finite Element / Finite Volume models It is an Initialization and Assimilation Methodology")
19
Strait of Sicily Feature Oriented Regional Modeling Set Up

21
The Brazil Current System

22
Meander-eddy-Upwelling System

23
The Brazil Current Structure

24
The Hardest Work of All!! SEC IWBC

25
Dynamical Features in BCS Brazil Current (Surface (0-150m) – 2 branches Bifurcating SEC around the Abrolhos Bank and Vitoria ridge – Pycnocline (150-500m)) IWBC + NADW (DWBC) Cabo Sao Tome eddy Cabo Frio eddy Vitoria eddy Upwelling regions Instability-generated Vortex dipoles in Santos Bight Fresh water influx in the shelf between the coast and the Brazil Current
 – 2 branches Bifurcating SEC around the Abrolhos Bank and Vitoria ridge – Pycnocline ( m)) IWBC + NADW (DWBC) Cabo Sao Tome eddy Cabo Frio eddy Vitoria eddy Upwelling regions Instability-generated Vortex dipoles in Santos Bight Fresh water influx in the shelf between the coast and the Brazil Current")
26
Southern California Coastal region

27
The California Current System

28
The Pacific basin-scale ROMS configuration at 50-km spatial resolutions will provide the required boundary conditions for the regional ROMS off the U.S. West coast.

29
Sea surface temperature simulated by ROMS. The 3-level ROMS domains are displayed.

30
Snapshot of sea surface temperature (left) and surface current (right) simulated by the 1.5-km ROMS. Model 500m, 1000m, 1500m, and 2000m isobaths are displayed (left).
..")
31
Humboldt Current System

32
The Peru-Chile Current System

33
Shallow water feature models Use of ‘intelligent observations’ that are important to resolve the scales and represent the underlying dynamical processes Not only temperature-salinity structure, but include first-order dynamics Process-oriented feature models

34
Upwelling Wind speed and direction at highest available resolution from QuikScat Mixed-layer depth estimate from MODIS Infer the Ekman Current in the Upper Mixed layer Additional baroclinic currents may be added for coastally trapped waves or alongshore currents Monterey Bay in Summer 2003, Vietnamese shelf in summer 2003, Brazil Current - Cape Frio upwelling region in austral summer 2003.

35
Transient feature models Coastal filaments, jets, squirts and eddies Automated gradient-detection algorithm (Cayula and Cornillon, 1995) Small scales (1-100 km) and short-life (20-40 days) Spatial and temporal dependence of FM parameters Low vs. high chlorophyll regions (Chan, 1999)
.")
36
CONCLUSIONS Developing FORMS is a pre-requisite for Synoptic modeling system FORMS is unique for each region Shallow water FORMS are very important for accurate prediction of bio-physically active systems FORMS is independent of the numerical modeling system (POM, ROMS, MOM, POP, HOPS etc.)
")
37
OBJECTIVELY BASED FEATURE MODEL Wilkinson basin water masses Brooks June 1982 data Cluster model of water masses EOF vertical analysis Feature model of vertical temperature and salinity

38
Brooks 1982 June survey in Wilkinson Basin

39
T,S Diagram

40
CLUSTER MODEL Distance function where

41
Water mass Ellipsoids

42
Explained Percent Variance No. of Modes Included

43
The 1997 PRIMER IV Field experiment To-be- analyzed via Cluster-EOF analysis with NRL-Stennis team

44
Feature tracking in shallow coastal regions MODIS instrument on Terra and Aqua Resolution ~ 250 meters (1-km globally) Temperature precision – 0.3-0.5K Navigational accuracy – 50 meters per pixel Moving mesh algorithm (Rowley and Ginis, 1999) ; Wavelet approach (Liu et al., 2002) Monterey Bay application – PCCS?
 Temperature precision – K Navigational accuracy – 50 meters per pixel Moving mesh algorithm (Rowley and Ginis, 1999) ; Wavelet approach (Liu et al., 2002) Monterey Bay application – PCCS")
45
MODIS chlorophyll on July 23, 2002 for southern California from Terra (left) at 1815 GMT, and the same field from Aqua (right) at 2115 GMT. A feature-tracking algorithm that uses the chlorophyll field as tracer will deduce the surface currents, which can be assimilated in the Navy’s modeling system. [Courtesy:Ron Vogel, http://www.modis-ocean.gsfc.nasa.gov/whatsnew.html]http://www.modis-ocean.gsfc.nasa.gov/whatsnew.html

Similar presentations


, calculated from TOPEX/ Poseidon, ERS-1/-2 and Jason.>")

 – as a synthesis component of the Global and Coastal IOOS Avijit Gangopadhyay University of Massachusetts.>")

 Surface Global zonal mean.>")


