Download presentation
Presentation is loading. Please wait.

1
CNT – Characteristics and Applications

5
A. Thess et al. Science (1996) Y. Saito et al. Phys. Rev (1993)
 Y. Saito et al. Phys. Rev (1993)")
12
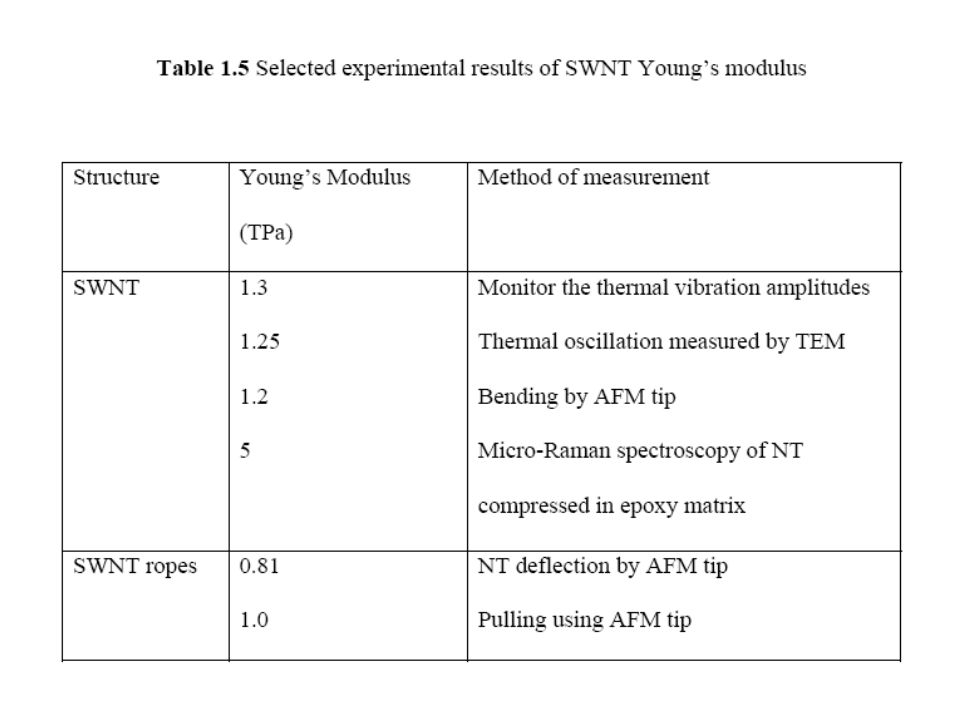
Young’s Modulus

15
Thermal Conductivity The combination of equilibrium and nonequilibrium molecular dynamics simulations with accurate carbon potential is used to predict the thermal conductivity of single wall carbon nanotubes as well as its dependence on the temperature.75 Based on this calculation, extremely high thermal conductivity (6600 W/m-K) of SWNT is obtained. This value is much higher than that of planar graphite and diamond. The high conductivity of SWNT is believed coming from the large phonon mean free path in 1-D structure of SWNT. The heat capacity and phonon mean free path govern the temperature dependence of SWNT’s thermal conductivity. At low temperatures, phonon mean free path is nearly constant, and the temperature dependence of thermal conductivity follows that of the specific heat. At high temperatures, where the specific heat is constant, conductivity decreases as the phonon mean free path becomes smaller due to umklapp processes. Therefore, the trend is such that the result appears to show that the thermal conductivity increases with the temperature at low temperatures, passes a peak, and then decreases with further increase in temperature.
 of SWNT is obtained. This value is much higher than that of planar graphite and diamond. The high conductivity of SWNT is believed coming from the large phonon mean free path in 1-D structure of SWNT. The heat capacity and phonon mean free path govern the temperature dependence of SWNT’s thermal conductivity. At low temperatures, phonon mean free path is nearly constant, and the temperature dependence of thermal conductivity follows that of the specific heat. At high temperatures, where the specific heat is constant, conductivity decreases as the phonon mean free path becomes smaller due to umklapp processes. Therefore, the trend is such that the result appears to show that the thermal conductivity increases with the temperature at low temperatures, passes a peak, and then decreases with further increase in temperature.")
16
At room temperature, the thermal conductivity of magnetically aligned SWNT bulk film is measured to be greater than 200 W/m k.78

17
and Nanocomposites. Field emission induced luminescence.
Luminescence due to bonding with certain polymer and with UV light irradiation. Bright Band Gap Photoluminescence from Unprocessed SWNTs.

19
sp Hybridization of Carbon
Each carbon atom has six electrons, which occupy 1s2, 2s2, and 2p2 atomic orbital. The core electrons take the 1s2 orbital and they are strongly bonded. The other four valence electrons are weakly bonded. These four valence electrons can readily mix with each other due to the small energy difference of upper 2p and lower 2s energy levels. This process is called hybridization. In carbon, three possible hybridizations are possible: sp, sp2 and sp3. The hybridization determines the chemical, physical, and configurationally properties of carbon materials. sp hybridization is observed in acetylene like materials, sp2 hybridization is observed in ethylene, while sp3 hybridization is seen in methane like structure. The hybridization and other physical parameters of carbon atom in different dimensional carbon materials are listed in Table 1.2.

25
(Linking Chiral Indices and Transport Properties of DWNTs)
")
30
Chirality and symmetry of Nanotube
By wrapping a hexagonal sheet with certain cut, geometry of nanotube can be reproduced. Several examples are as follows. (n, m) m ( (10,10) n
 m. ( (10,10) n.")
31
(10, 5) Hence, the geometry of nanotube (except for cap region on both ends) can be uniquely determined by the chiral vector of original hexagonal lattice.
 can be uniquely determined by the chiral vector of original hexagonal lattice.")
33
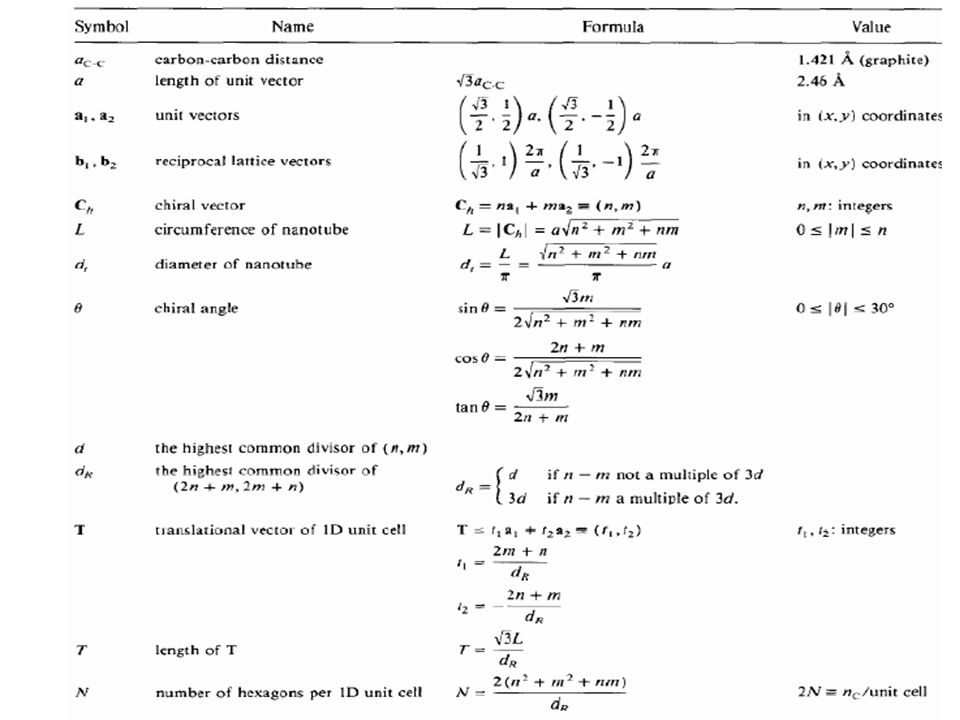
Definition of chiral vectors in the hexagonal lattice is
Chiral vector is defined as using the vectors a1 and a2 for the hexagonal lattice. Note that for the hexagonal lattice a unit cell is made of 2 atoms. Note also depending on textbook, a1 and a2 are defined as 2 vectors with 120 deg. openings.

34
Unit cell of Graphite

35
With this definition in the figure a1 and a2 can be expressed using the Cartesian coordinate (x, y).
Here, ac-c is the bond length of carbon atoms. For graphite ac-c = Å. This same value is often used for nanotubes. But, probably, ac-c = 1.44 Å is a better approximation for nanotubes. It should really depend on the curvature of the tube. A slightly larger value for more curvature is known. Since the length of a1, a2 are both , this a is the unit length. Hence,

36
Length of the Chiral vector Ch is the peripheral length of the nanotube: na1 + ma2
For Armchair nanotube (m = n): For examples, for (5,5): , for (10,10): For zigzag nanotubes (m = 0): Expls, (10,0): , (16,0): Hence, the diameter of nanotube dt is
: For examples, for (5,5): , for (10,10): For zigzag nanotubes (m = 0): Expls, (10,0): , (16,0): Hence, the diameter of nanotube dt is.")
37
For armchair (n=m): For zigzag (m = 0): Possible choice of n and m is explained in the following figure. From R. Saito, M. Fujita, G. Dresselhaus, and M. S. Dresselhaus, Electronic Structure of Chiral Graphene Tubules, Appl. Phys. Lett. 60 (18), 1992. Here, a red solid point represents metallic nanotube and a black open circle represents semiconductor nanotubes. The condition for the metallic nanotube is: 2n+m=3q (q: integer), or (n-m)/3 is integer.
, Here, a red solid point represents metallic nanotube and a black open circle represents semiconductor nanotubes. The condition for the metallic nanotube is: 2n+m=3q (q: integer), or (n-m)/3 is integer.")
40
and d is the highest common divisor of (n,m). For armchair (m=n):
The unit lattice vector (translational vector) T, perpendicular to the chiral vector is expressed as The length T is the unit lattice length along the tube axis direction. Here, and d is the highest common divisor of (n,m). For armchair (m=n): , Then, For zigzag (m=0): ,
 T, perpendicular to the chiral vector is expressed as. The length T is the unit lattice length along the tube axis direction. Here, and d is the highest common divisor of (n,m). For armchair (m=n): , Then, For zigzag (m=0): ,")
41
The Chiral angle (angle between the chiral vector and the zigzag direction) is defined as
Armchair m = n: Zigzag m = 0: For chiral tubes:

42
Number of hexagons in a unit cell N is
Armchair m = n: Zigzag m = 0:

44
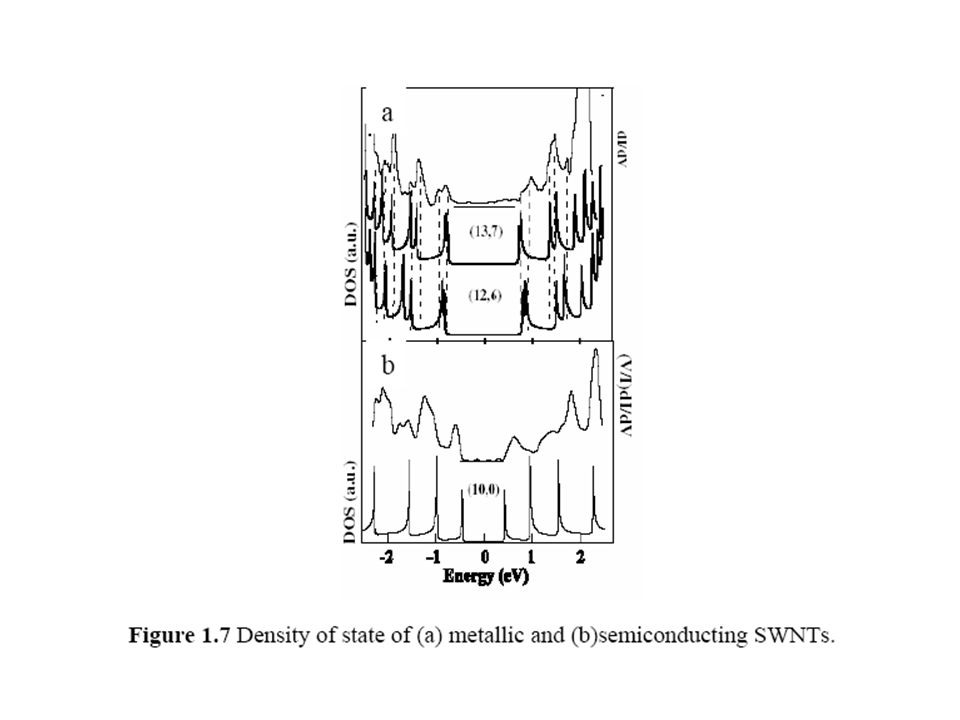
For One-dimensional DOS for each chiralities,
Sample (10,10)
")
49
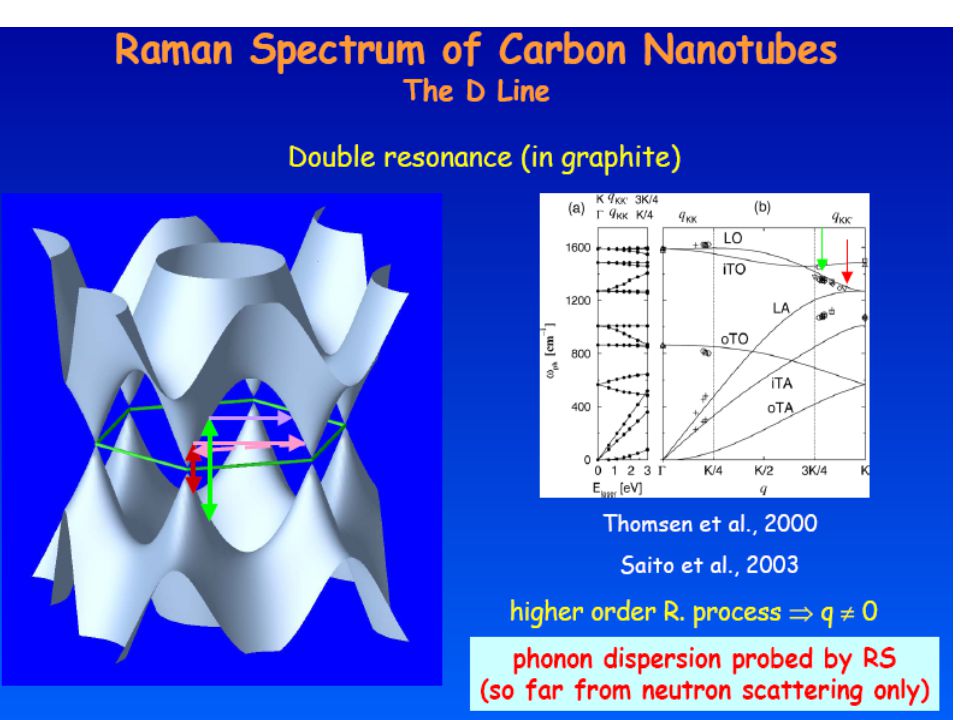
Raman Spectroscopy Raman spectroscopy is a powerful technique for characterizing SWNT. From Raman study, the diameter, diameter distribution, defects, load transfer state as well as the electronic state of SWNT can be evaluated. Raman scattering by SWNT has been experimentally shown to be a resonant process associated with allowed optical transitions (AOT) between spikes in the 1D electronic density of states (named van Hove singularities), which fall in the visible and near-infrared regions. The energies of the van Hove transitions are found to depend both on the diameter and metallic or semi-conducting character of the tubes.94, 95 When subjected to different lasers as the excitation source, tubes will respond differently.
 between spikes in the 1D electronic density of states (named van Hove singularities), which fall in the visible and near-infrared regions. The energies of the van Hove transitions are found to depend both on the. diameter and metallic or semi-conducting character of the tubes.94, 95 When subjected to different lasers as the excitation source, tubes will respond differently.")
50
Raman Spectroscopy

57
radial breathing mode (RBM), the disorder induced D-band, the tangential G-band (derived from the graphite like in-plane mode) and G* band (overtone of D band).
, the disorder induced D-band, the tangential G-band (derived from the graphite like in-plane mode) and G* band (overtone of D band).")
58
The spectrum in the range of 150 to 350 cm-1 is the RBM, and is influenced by the diameter of the nanotubes. Several calculations have related the diameter of the tube with radial breath frequency of Raman spectrum mathematically or However, most of the tubes self-assemble into bundles and radial modes are very sensitive to the nanotube packing. Calculating the RBM frequency considering the van der Waals interactions between the tubes, the following equation was given:97 By separating the contributions of different diameter tubes to the radial breathing intensity, the diameter distribution of the nanotube can be obtained.

59
The Raman spectrum in the range of 1250 to 1450 cm-1 is called D band, which is due to the defect on the nanotube. This band can be used to monitor the structure perfection of the nanotubes. Also it can be used to qualitatively characterize the chemical functionalization of the tube. Side wall functionalization damages the tube, increasing the D band intensity. The feature in the range of 2500 to 2900 cm-1 also originates from the defect. It is the second order overtone of D band. It is widely used to monitor the load transfer between SWNT and the matrix.

60
G-band The most important aspect of the G-band is the characteristic Raman lineshape, which differs in accordance with whether the nanotube is semi-conducting or metallic. This intrinsic property allows one to readily distinguish between metallic and semi-conducting nanotubes. In case of semi-conducting tube, two Lorentzian features dominate the lineshape but in case of metallic tube, one Lorentzian is replaced by Breit–Wigner–Fano line. Based on the sensitivity of the G-band to the electronic energy state, the position of G-band can be used to monitor the energy state change due to environment. For example, the thermal energy input to the SWNT can lead to the shift of the D-band; the pressure applied on the SWNT will lead the shift of D-band; most importantly, the chemical environment change, such as the doping effect, will also induce the D-band position change.

68
Incorporation of CNTs into Devices

Similar presentations


>")


 –8 C atoms.>")


 Sebastian Remi Journal Club 11/26/2006.>")


 are cylindrical macromolecules formed by periodic hexagonal structures of carbon atoms. The ends of NT are closed by.>")