Download presentation
Presentation is loading. Please wait.

1
Are Forest Fires HOT? Jean Carlson, UCSB

2
Background Much attention has been given to “complex adaptive systems” in the last decade. Popularization of information, entropy, phase transitions, criticality, fractals, self-similarity, power laws, chaos, emergence, self- organization, etc. Physicists emphasize emergent complexity via self-organization of a homogeneous substrate near a critical or bifurcation point (SOC/EOC)
.")
3
Forest Fires: An Example of Self-Organized Critical Behavior Bruce D. Malamud, Gleb Morein, Donald L. Turcotte 18 Sep 1998 4 data sets

4
Criticality and power laws Tuning 1-2 parameters critical point In certain model systems (percolation, Ising, …) power laws and universality iff at criticality. Physics: power laws are suggestive of criticality Engineers/mathematicians have opposite interpretation: –Power laws arise from tuning and optimization. –Criticality is a very rare and extreme special case. –What if many parameters are optimized? –Are evolution and engineering design different? How? Which perspective has greater explanatory power for power laws in natural and man-made systems?

5
Highly Optimized Tolerance (HOT) Complex systems in biology, ecology, technology, sociology, economics, … are driven by design or evolution to high- performance states which are also tolerant to uncertainty in the environment and components. This leads to specialized, modular, hierarchical structures, often with enormous “hidden” complexity, with new sensitivities to unknown or neglected perturbations and design flaws. “Robust, yet fragile!”

6
“Robust, yet fragile” Robust to uncertainties –that are common, –the system was designed for, or –has evolved to handle, …yet fragile otherwise This is the most important feature of complex systems (the essence of HOT).
.")
7
Robustness of HOT systems Robust Fragile Robust (to known and designed-for uncertainties) Fragile (to unknown or rare perturbations) Uncertainties
 Fragile (to unknown or rare perturbations) Uncertainties")
8
Complexity Robustness Aim: simplest possible story Interconnection

9
Square site percolation or simplified “forest fire” model. The simplest possible spatial model of HOT. Carlson and Doyle, PRE, Aug. 1999

10
empty square latticeoccupied sites

11
connected not connected clusters

12
A “spark” that hits an empty site does nothing. Assume one “spark” hits the lattice at a single site.

13
A “spark” that hits a cluster causes loss of that cluster.

14
Yield = the density after one spark yielddensityloss

15
00.20.40.60.81 0 0.1 0.2 0.3 0.4 0.5 0.6 0.7 0.8 0.9 1 Y = (avg.) yield = density “critical point” N=100 no sparks sparks
 yield = density critical point N=100 no sparks sparks")
16
00.20.40.60.81 0 0.1 0.2 0.3 0.4 0.5 0.6 0.7 0.8 0.9 1 limit N “critical point” Y = (avg.) yield = density c =.5927
 yield = density c =.5927")
17
Cold Fires don’t matter. Y

18
Y Burned Everything burns.

19
Critical point Y

20
critical phase transition This picture is very generic and “universal.” Y

21
Statistical physics: Phase transitions, criticality, and power laws

24
Power laws Criticality cluster size cumulative frequency

25
Average cumulative distributions clusters fires size

26
Power laws: only at the critical point low density high density cluster size cumulative frequency

27
Self-organized criticality (SOC) Create a dynamical system around the critical point yield density
 Create a dynamical system around the critical point yield density")
28
Self-organized criticality (SOC) Iterate on: 1.Pick n sites at random, and grow new trees on any which are empty. 2.Spark 1 site at random. If occupied, burn connected cluster.

29
lattice fire distribution density yield fires

30
-.15

31
Forest Fires: An Example of Self-Organized Critical Behavior Bruce D. Malamud, Gleb Morein, Donald L. Turcotte 18 Sep 1998 4 data sets

32
10 -2 10 10 0 1 2 3 4 0 1 2 SOC FF Exponents are way off -1/2

33
Edge-of-chaos, criticality, self-organized criticality (EOC/SOC) yield density Essential claims: Nature is adequately described by generic configurations (with generic sensitivity). Interesting phenomena is at criticality (or near a bifurcation).
..")
34
Qualitatively appealing. Power laws. Yield/density curve. “order for free” “self-organization” “emergence” Lack of alternatives? (Bak, Kauffman, SFI, …) But... This is a testable hypothesis (in biology and engineering). In fact, SOC/EOC is very rare.
 But... This is a testable hypothesis (in biology and engineering). In fact, SOC/EOC is very rare..")
35
Self-similarity?

36
What about high yield configurations? ? Forget random, generic configurations. Would you design a system this way?

37
Barriers What about high yield configurations?

38
00.20.40.60.81 0 0.1 0.2 0.3 0.4 0.5 0.6 0.7 0.8 0.9 1

39
Rare, nongeneric, measure zero. Structured, stylized configurations. Essentially ignored in stat. physics. Ubiquitous in engineering biology geophysical phenomena? What about high yield configurations?

40
critical Cold H ighly O ptimized T olerance (HOT) Burned
 Burned")
41
Why power laws? Almost any distribution of sparks Optimize Yield Power law distribution of events both analytic and numerical results.

42
Special cases Singleton (a priori known spark) Uniform spark Optimize Yield Uniform grid Optimize Yield No fires
 Uniform spark Optimize Yield Uniform grid Optimize Yield No fires")
43
Special cases No fires Uniform grid In both cases, yields 1 as N .

44
Generally…. 1.Gaussian 2.Exponential 3.Power law 4.…. Optimize Yield Power law distribution of events

45
51015202530 5 10 15 20 25 30 0.1902 2.9529e-016 2.8655e-0114.4486e-026 Probability distribution (tail of normal) High probability region
 High probability region")
46
Grid design: optimize the position of “cuts.” cuts = empty sites in an otherwise fully occupied lattice. Compute the global optimum for this constraint.

47
Optimized grid density = 0.8496 yield = 0.7752 Small events likely large events are unlikely

48
00.20.40.60.81 0 0.1 0.2 0.3 0.4 0.5 0.6 0.7 0.8 0.9 1 random grid High yields. Optimized grid density = 0.8496 yield = 0.7752

49
“grow” one site at a time to maximize incremental (local) yield Local incremental algorithm
 yield Local incremental algorithm")
50
density= 0.8 yield = 0.8 “grow” one site at a time to maximize incremental (local) yield
 yield")
51
density= 0.9 yield = 0.9 “grow” one site at a time to maximize incremental (local) yield
 yield")
52
Optimal density= 0.97 yield = 0.96 “grow” one site at a time to maximize incremental (local) yield
 yield")
53
00.20.40.60.81 0 0.1 0.2 0.3 0.4 0.5 0.6 0.7 0.8 0.9 1 random density Very sharp “phase transition.” optimized

54
10 0 1 2 3 -4 10 -3 10 -2 10 10 0 grid “grown” “critical” size Cum. Prob. All produce Power laws

55
HOT: many mechanisms gridgrown or evolvedDDOF All produce: High densities Modular structures reflecting external disturbance patterns Efficient barriers, limiting losses in cascading failure Power laws

56
Robust, yet fragile?

57
Extreme robustness and extreme hypersensitivity. Small flaws

58
00.20.40.60.81 0 0.1 0.2 0.3 0.4 0.5 0.6 0.7 0.8 0.9 1

59
00.20.40.60.81 0 0.1 0.2 0.3 0.4 0.5 0.6 0.7 0.8 0.9 1

60
If probability of sparks changes. disaster

61
Tradeoffs? Sensitivity to: sparks flaws assumed p(i,j)
")
62
Critical percolation and SOC forest fire models HOT forest fire models Optimized SOC & HOT have completely different characteristics. SOC vs HOT story is consistent across different models.

63
A HOT forest fire abstraction… Burnt regions are 2-d Fire suppression mechanisms must stop a 1-d front. Optimal strategies must tradeoff resources with risk.

64
Generalized “coding” problems Fires Web Data compression Optimizing d-1 dimensional cuts in d dimensional spaces.

65
-6-5-4-3-2012 0 1 2 3 4 5 6 Size of events Cumulative Frequency Decimated data Log (base 10) Forest fires 1000 km 2 (Malamud) WWW files Mbytes (Crovella) Data compression (Huffman) (codewords, files, fires) Los Alamos fire
 Forest fires 1000 km 2 (Malamud) WWW files Mbytes (Crovella) Data compression (Huffman) (codewords, files, fires) Los Alamos fire")
66
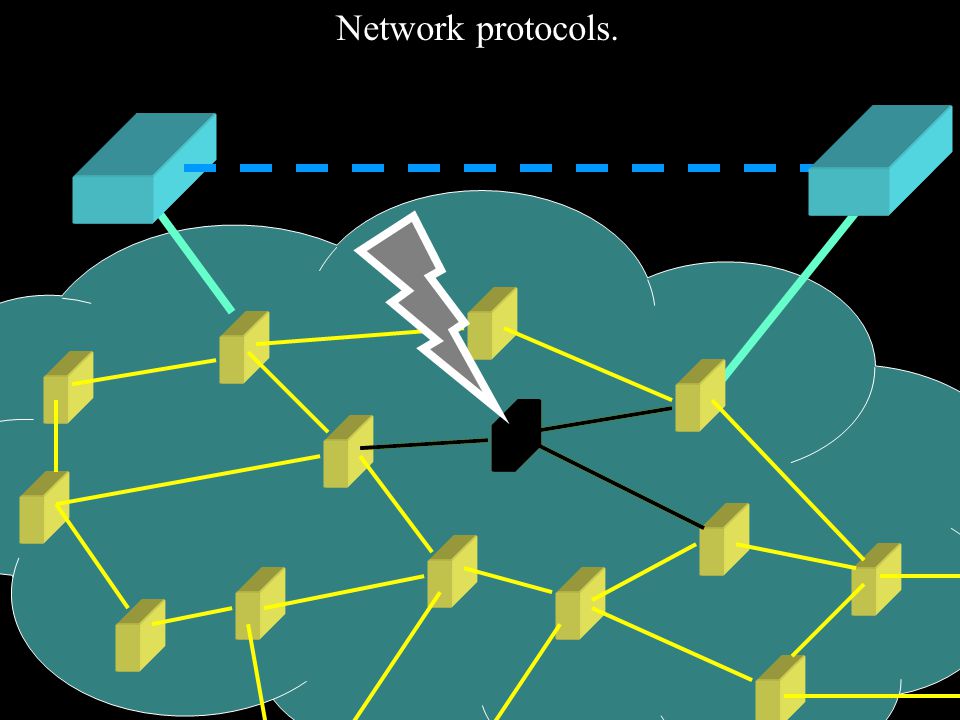
Network protocols. HTTP TCP IP Routers Files packets

67
Network protocols. Transparent to the user HTTP

68
Network protocols.

70
Transparent to the user Danger: It is easy to weave intriguing but impossible notions about how this works. It often requires great internal complexity to create a robust, simple interface.

71
Universal network behavior? demand throughput Congestion induced “phase transition.” Similar for: Power grid? Freeway traffic? Gene regulation? Ecosystems? Finance?

72
Web/Internet? demand throughput Congestion induced “phase transition.” Power laws log(file size) log(P>)
 log(P>).")
73
random networks log(thru-put) log(demand) Networks Making a “random network:” Remove protocols –No IP routing –No TCP congestion control Broadcast everything Many orders of magnitude slower Broadcast Network
 log(demand) Networks Making a random network: Remove protocols –No IP routing –No TCP congestion control Broadcast everything Many orders of magnitude slower Broadcast Network")
74
Networks random networks real networks HOT log(thru-put) log(demand) Broadcast Network
 log(demand) Broadcast Network")
75
Web servers web traffic Is streamed out on the net. Creating internet traffic Web client Web/internet traffic

76
Web servers web traffic Is streamed out on the net. Creating internet traffic Web client Let’s look at some web traffic

77
document split into N files to minimize download time A toy website model (= 1-d grid HOT design)
")
78
# links = # files Optimize 0-dimensional cuts in a 1-dimensional document

79
Probability of user access Navigate with feedback Limit # clicks= constrain depth Minimize average file size Heavy tail file transfer sizes File sizes even more heavy Robust to user access (power law, exponential, Gaussian)
")
80
Probability of user access Wasteful

81
Probability of user access Hard to navigate.

82
# links = # files Optimize 0-dimensional cuts in a 1-dimensional document

83
Source coding for data compression Based on frequencies of source word occurrences, Select code words. To minimize message length. (simplest optimal design theory in engineering)
.")
84
Generalized “coding” problems Fires Web Data compression Optimizing d-1 dimensional cuts in d dimensional spaces.

85
PLR optimization Minimize expected loss P: uncertain events with probabilities p i L: with loss l i R: limited resources r i PLR DCsourcecodewordsdecodability WWWuser accessfilesweb layout FFsparksfiresfirebreaks

86
p i = Probability of event l i = volume enclosed r i = barrier density d-dimensional Resource/loss relationship:

87
PLR optimization = 0data compression = 1web layout = 2forest fires = “dimension”

88
Minimize average cost using standard Lagrange multipliers With optimal cost Leads to optimal solutions for resource allocations and the relationship between the event probabilities and sizes.

89
To compare with data. Forward engineering Reverse engineering

90
Reverse engineering To compare with data.

91
Cumulative plot sizes from data compute using model α=1/β Power Laws

92
-6-5-4-3-2012 0 1 2 3 4 5 6 Size of events Frequency Decimated data Log (base 10) Forest fires 1000 km 2 (Malamud) WWW files Mbytes (Crovella) Data compression (Huffman) Los Alamos fire Cumulative
 Forest fires 1000 km 2 (Malamud) WWW files Mbytes (Crovella) Data compression (Huffman) Los Alamos fire Cumulative")
93
-6-5-4-3-2012 0 1 2 3 4 5 6 Size of events Frequency Fires Web files Codewords Cumulative Log (base 10) -1/2
 -1/2")
94
-6-5-4-3-2012 0 1 2 3 4 5 6 FF WWW DC Data + Model

95
-6-5-4-3-2012 0 1 2 3 4 5 6 FF WWW DC Data + Model

96
from data from model

97
What can we learn from this simple model? P: uncertain events with probabilities p i R: limited resources r i to minimize… L: loss l i due to event i Be cautious about simple theories that ignore design. Power laws arise easily in designed systems due to resource vs. loss tradeoffs. Exploiting assumptions, makes you sensitive to them. More robustness leads to sensitivities elsewhere. Robust, yet fragile.

98
HOT SOC d=1 dd dd HOT decreases with dimension. SOC increases with dimension. SOC and HOT have very different power laws.

99
HOT yields compact events of nontrivial size. SOC has infinitesimal, fractal events. HOT SOC size infinitesimal large

100
HOT SOC HOTData Max event sizeInfinitesimalLarge Large event shapeFractalCompact Slope SmallLarge Dimension d d-1 1/d SOC and HOT are extremely different.

101
SOC HOT & Data Max event sizeInfinitesimal Large Large event shapeFractal Compact Slope Small Large Dimension d d-1 1/d SOC and HOT are extremely different. HOT SOC

102
Summary Power laws are ubiquitous, but not surprising HOT may be a unifying perspective for many Criticality & SOC is an interesting and extreme special case… … but very rare in the lab, and even much rarer still outside it. Viewing a system as HOT is just the beginning.

103
The real work is… New Internet protocol design Forest fire suppression, ecosystem management Analysis of biological regulatory networks Convergent networking protocols etc

104
Forest fires dynamics Intensity Frequency Extent Weather Spark sources Flora and fauna Topography Soil type Climate/season

105
Forest Fires: An Example of Self-Organized Critical Behavior Bruce D. Malamud, Gleb Morein, Donald L. Turcotte 18 Sep 1998 4 data sets

106
10 -4 10 -3 10 -2 10 10 0 1 0 1 2 3 4 All four data sets are fit with the PLR model with α=1/2. Size (1000 km 2 ) Rank order
 Rank order.")
107
Los Padres National Forest Max Moritz

108
Yellow: lightning (at high altitudes in ponderosa pines) Red: human ignitions (near roads) Ignition and vegetation patterns in Los Padres National Forest Brown: chaperal Pink: Pinon Juniper
 Red: human ignitions (near roads) Ignition and vegetation patterns in Los Padres National Forest Brown: chaperal Pink: Pinon Juniper")
109
Santa Monica Mountains Max Moritz and Marco Morais

110
SAMO Fire History

111
Fires 1991-1995 Fires 1930-1990 Fires are compact regions of nontrivial area.

112
10 -4 10 -3 10 -2 10 10 0 1 0 1 2 3 4 4 Science data sets +LPNF + HFIREs (SA=2) PLR SM Rescaling data for frequency and large size cutoff gives excellent agreement, except for the SM data set Cumulative P(size) size
 PLR SM Rescaling data for frequency and large size cutoff gives excellent agreement, except for the SM data set Cumulative P(size) size")
113
We are developing a realistic fire spread model HFIREs: GIS data for Landscape images

114
Models for Fuel Succession Regrowth modeled by vegetation succession models

115
1996 Calabasas Fire Historical fire spread Simulated fire spread Suppression?

116
HFIREs Simulation Environment Topography and vegetation initialized with recent observations (100 m GIS resolution) for Santa Monica Mountains Weather based on historical data (SA rate treated as a separate parameter) Fire spread modeled using Rothermel equations Fuel regrowth based on succession models 8 ignitions per year Weather sampled stochastically from distribution (4 day SA at prescribed rate) Fire terminates in a cell when rate of spread (RoS) falls below a specified value Generate 600 year catalogs, omit data for first 100 years in our statistics
 for Santa Monica Mountains Weather based on historical data (SA rate treated as a separate parameter) Fire spread modeled using Rothermel equations Fuel regrowth based on succession models 8 ignitions per year Weather sampled stochastically from distribution (4 day SA at prescribed rate) Fire terminates in a cell when rate of spread (RoS) falls below a specified value Generate 600 year catalogs, omit data for first 100 years in our statistics")
117
Preliminary results from the HFIRES simulations (no extreme weather conditions included) (we have generated many 600 year catalogs varying both extreme weather and suppression)
 (we have generated many 600 year catalogs varying both extreme weather and suppression)")
118
Data: typical five year periodHFIREs simulations: typical five year period Fire scar shapes are compact

119
10 -4 10 -3 10 -2 10 10 0 1 0 1 2 3 4 LPNF PLR HFIRE SA=2, RoS=.033 m/s, FC=46 yr Excellent agreement between data, HFIREs and the PLR HOT model

120
10 -4 10 -3 10 -2 10 10 0 1 0 1 2 3 4 4 Science +LPNF + Hfire (SA=2) PLR SM small: incomplete large: short catalog, or aggressive human intervention (inhomogeneous) SM discrepancy?
 PLR SM small: incomplete large: short catalog, or aggressive human intervention (inhomogeneous) SM discrepancy")
121
10 0 1 2 3 4 5 0 1 2 3 Deviations from typical regional values for suppression (RoS) and the number of extreme weather events (SA), lead to deviations from the α=1/2 fit, and unrealistic values of the fire cycle (FC) SA=0, vary stopping rate SA= 1, 2, 4, 6
 and the number of extreme weather events (SA), lead to deviations from the α=1/2 fit, and unrealistic values of the fire cycle (FC) SA=0, vary stopping rate SA= 1, 2, 4, 6")
122
SA=2, =.5 SA=4, =.5 SA=6, =.3 SA=0, =.65 10 2 3 4 5 0 1 2 3 Increased rate of SA leads to flatter curves, shorter fire cycles Type conversion!

123
What is the optimization problem? Fire is a dominant disturbance which shapes terrestrial ecosystems Vegetation adapts to the local fire regime Natural and human suppression plays an important role Over time, ecosystems evolve resilience to common variations But may be vulnerable to rare events Regardless of whether the initial trigger for the event is large or small (we have not answered this question for fires today) We assume forests have evolved this resiliency (GIS topography and fuel models) For the disturbance patterns in California (ignitions, weather models) And study the more recent effect of human suppression Find consistency with HOT theory But it remains to be seen whether a model which is optimized or evolves on geological times scales will produce similar results Plausibility Argument: HFIREs Simulations:
 We assume forests have evolved this resiliency (GIS topography and fuel models) For the disturbance patterns in California (ignitions, weather models) And study the more recent effect of human suppression Find consistency with HOT theory But it remains to be seen whether a model which is optimized or evolves on geological times scales will produce similar results Plausibility Argument: HFIREs Simulations:.")
124
The shape of trees by Karl Niklas L: Light from the sun (no overlapping branches) R: Reproductive success (tall to spread seeds) M: Mechanical stability (few horizontal branches) L,R,M: All three look like real trees Simulations of selective pressure shaping early plants Our hypothesis is that robustness in an uncertain environment is the dominant force shaping complexity in most biological, ecological, and technological systems
 R: Reproductive success (tall to spread seeds) M: Mechanical stability (few horizontal branches) L,R,M: All three look like real trees Simulations of selective pressure shaping early plants Our hypothesis is that robustness in an uncertain environment is the dominant force shaping complexity in most biological, ecological, and technological systems")
Similar presentations


 power laws and universality iff at criticality.>")


. Réka Albert and AL Barabási,Statistical Mechanics.>")


 Vipin Kumar Army High Performance.>")