Download presentation
Presentation is loading. Please wait.

1
Design Degrees of Freedom and Mechanisms for Complexity David Reynolds J. M. Carlson

2
Question to Answer The relationship between design and complexity –Two extreme theoretical points Differentiated by their stance regarding the role of design. 1.Theory of Self-organized criticality (SOC), edge of chaos (EOC). Complexity “emerges” in systems that are otherwise internally homogeneous and simple. Large-scale structure arises naturally and at no apparent cost through collective fluctuations in systems with generic interactions between individual agents. Structure is associated with bifurcation points and critical phase transitions. 2. Highly optimized tolerance (HOT) Complexity is associated with intricately designed or highly evolved systems. Role of robustness to uncertainties in the environment as a driving force towards increasing complexity in biological evolution and engineering design. Robustness design is the primary mechanism for complexity. This paper is based on HOT
, edge of chaos (EOC). Complexity emerges in systems that are otherwise internally homogeneous and simple. Large-scale structure arises naturally and at no apparent cost through collective fluctuations in systems with generic interactions between individual agents. Structure is associated with bifurcation points and critical phase transitions. 2. Highly optimized tolerance (HOT) Complexity is associated with intricately designed or highly evolved systems. Role of robustness to uncertainties in the environment as a driving force towards increasing complexity in biological evolution and engineering design. Robustness design is the primary mechanism for complexity. This paper is based on HOT.")
3
Question to Answer To determine how the characteristics of designed systems change as the resolution of the design is varied A measure for design, design degrees of freedom, (DDOF) –Varying the number of DDOF’s to interpolate between systems with minimal design, and those that are highly designed Using the model, percolation forest fire model
 –Varying the number of DDOF’s to interpolate between systems with minimal design, and those that are highly designed Using the model, percolation forest fire model")
4
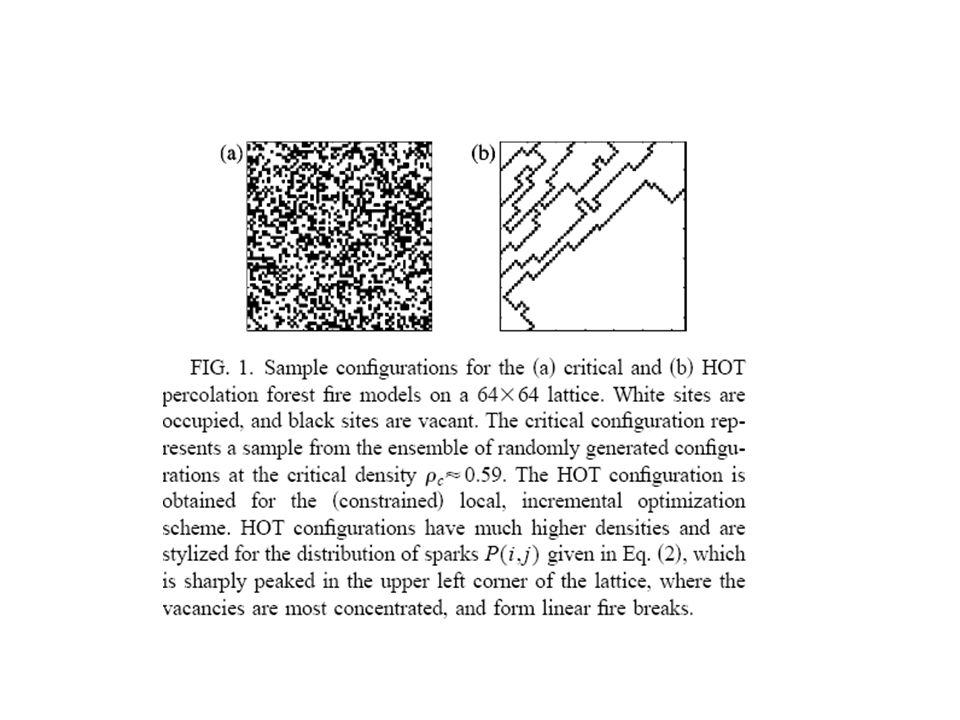
Percolation forest fire (PFF) model Two-dimensional N-by-N lattice Each site is either occupied by a tree or is vacant Each contiguous set of nearest neighbor occupied sites defines a connected cluster (forest) The forest is subject to external perturbations, represented by sparks A spark hits a vacant site on the lattice nothing happens; a spark hits an occupied site it burns all the trees in the connected cluster associated with the site. Distribution of the spark, P(i, j). With probability P(i,j), the spark hits the site (i,j). In random percolation, the state of the system is fully characterized by the density . –Individual sites are independently occupied with probability Properties of the system are determined by ensemble averages in which all configurations at density are taken to be equally likely
. With probability P(i,j), the spark hits the site (i,j). In random percolation, the state of the system is fully characterized by the density . –Individual sites are independently occupied with probability Properties of the system are determined by ensemble averages in which all configurations at density are taken to be equally likely.")
5
Percolation forest fire model Cont’d Yield Y to be the number of trees remaining after a single spark, – : the density before the spark – l : average loss due to the fire, computed over the distribution of sparks P(i, j) as well as the configurations in the ensemble Objective: optimize yield as a function of the tunable parameters, given a distribution of sparks P(i, j) DDOF’s in PFF (number of tunable design parameters) –1: random percolation; the density –N 2 : specifically choose whether each site individually is occupied or vacant. DDOF’s as N Intractable as 2^(N 2 ) candidate lattices
 candidate lattices.")
6
For finite DDOF’s, the authors adopt an local incremental algorithm for increasing the density. –local optimization in configuration space –Sites are occupied one at a time, always choosing the next site to occupy in order to maximize yield for the incremental change in density –Plot a yield curve, Y( ), which has a maximum at some = max. Beyond this value there is a sharp drop in yield. In the thermodynamic limit, max approaches unity
, which has a maximum at some = max. Beyond this value there is a sharp drop in yield. In the thermodynamic limit, max approaches unity.")
8
Between, 1 and N 2, we consider intermediate numbers of DDOF’s. –Interpolate between 1 and infinite DDOF’s The approach –subdividing the N-by-N lattice into equal square cells –M-by-M lattice, with each cell containing n 2 = (N/M) 2 sites –Individual cells are characterized by a density IJ where (I, J) defines the cell coordinate on the M-by-M design lattice.
 2 sites –Individual cells are characterized by a density IJ where (I, J) defines the cell coordinate on the M-by-M design lattice..")
9
NUMERICAL RESULTS M = 1: single DDOF, optimization of the yield leads to criticality c N finite, M small : as N gets large, the subregion densities converge to either unit density or a density that approaches the critical density c. c - N , M small. –brute force calculation of the globally optimal configuration –design lattice breaking up into compact domains of unit density, separated by uncrossable barriers of density, c - N , M large –cellular patterns similar to HOT patterns Spark distribution, exponential

10
Criticality- the optimal solution for a single DDOF M = 1. The state of the system is characterized by the density The choice of P(x,y) is is irrelevant for large N. The model exhibits a continuous phase transition at density – c 0.592 In the limit N , –for < c, no infinite cluster –for < c, an infinite cluster exists somewhere on the lattice with probability one –for = c, the probability of an infinite cluster lies between zero and unity and depends on the shape of the lattice. For a square-shaped, ½.
 is is irrelevant for large N. The model exhibits a continuous phase transition at density – c In the limit N , –for < c, no infinite cluster –for < c, an infinite cluster exists somewhere on the lattice with probability one –for = c, the probability of an infinite cluster lies between zero and unity and depends on the shape of the lattice. For a square-shaped, ½..")
11
Criticality Cont’d At low densities, lattice sparse, at low densities there is on average zero macroscopic loss associated with a fire ignited by a single spark. At densities greater than or equal to the critical density, there is an infinite cluster and the probability that any given site is on the infinite cluster defines the percolation probability P ( ), –At c, P ( ) = 0, the infinite cluster (if exists) is fractal
, –At c, P ( ) = 0, the infinite cluster (if exists) is fractal.")
12
Explicit optimization on finite lattices with few DDOF’s M > 1, but small. Determine the optimal yield configuration as a function of the M 2 cell densities Fix M and increase N. Something interesting: –each of the densities IJ either converges rapidly to unity or more gradually towards c M = 2, N = 64. –Yield Y( 11, 12, 21, 22 )
.")
13
11 depends on the system size.

14
Sample solutions for different distributions of sparks

15
Global optimization for an infinite underlying lattice and few DDOF’s N: infinite, M small Cells: density is either near critical or unit Calculate the yield.

16
Propagation –Cells at c - experience no macroscopic loss in density in a fire, and fires do not propagate macroscopic distances across the cell. –Fires do not propagate from left to right or from top to bottom across cells at density c - . The c - cells thus act effectively as fire breaks for vertical and horizontal propagation. –Fires will propagate between adjacent edges of cells with density c - This implies a corner connection between cells at unity density is effectively the same as a shared edge. –Cells at unit density experience total loss when a spark hits the cell cell, or when fires propagate into the cell from nearest (edge connected) or next nearest (corner connected) neighbor cells at unit density
 or next nearest (corner connected) neighbor cells at unit density.")
17
Local optimization for an infinite underlying lattice and many DDOF’s

18
Summary Degree of Design and Complexity? –Higher Degree of Design -> More complex system, specialized but fragile to rare events.

19
Mutation, specialization, and hypersensitivity in highly optimized tolerance Tong Zhou, J. M. Carlson, and John Doyle

20
Using the Percolation forest fire (PFF) model to argue with self- organizes to a critical point (SOC) and ‘‘edge of chaos’’ (EOC) A key signature of a HOT system is that it is simultaneously “robust, yet fragile” simultaneously
 model to argue with self- organizes to a critical point (SOC) and ‘‘edge of chaos’’ (EOC) A key signature of a HOT system is that it is simultaneously robust, yet fragile simultaneously")
21
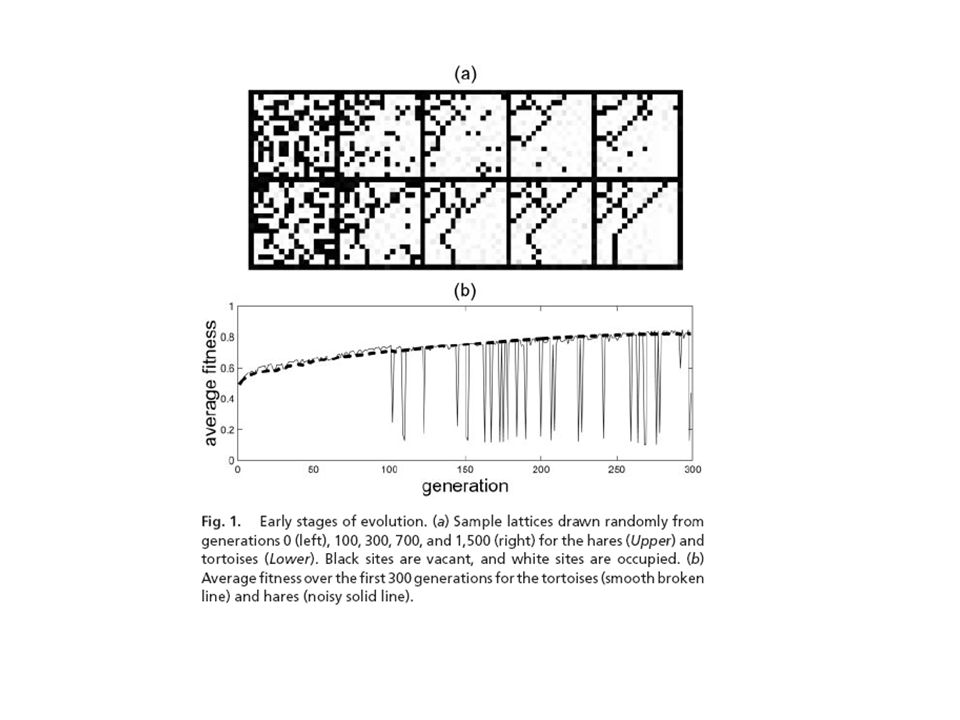
Distribution of Spark: exponential Genotype: layout of the lattice Phenotype: {f n, l n } –l n : event sizes –f n : the corresponding probabilities Two types to evolve. –Tortoises: Y = - l , l average loss –Hares: Y 1 = - l n l n : stochastic loss evolve rapidly, over-specialize for common disturbances, win in the short term, but are vulnerable to extinction in rare events

22
The experiment begin with 1,000 randomly generated lattices with N = 16 divided equally between the tortoise and hare types. Each subsequent generation consists of two offspring from each parent lattice, each with a finite probability of mutation. Each resulting generation of offspring is then subject to natural selection based on fitness Y. An upper bound of 1,000 on the total population S Competition based on fitness occurs among all of the lattices for this limited space in the community. Any lattice with Y < Yd is considered ‘‘dead’’ and automatically discarded, along with the lowest performers until the total size S of the community is S <=1,000.

24
Observations of experiment Even at the relatively early stages of evolution the tortoises and hares begin to develop barrier patterns that are characteristic of their respective types. The tortoises sacrifice density to retain a higher concentration of barriers in regions that have less frequent sparks. If the tortoises win this initial competition, they persist forever at the maximum population of 1,000. –They are optimized for “long-term” If the hares survive, evolve more rapidly and to higher densities –they do not sacrifice density to protect against rare events

25
The second experiment Including niches –the niches retain the top 50 of each type

26
Observations of the Second Experiment For long periods when no rare events happen, the hares have higher fitness and thus dominate. Nearly all of the available 1,000 spaces belong to the hares, while the tortoise population is sustained at the minimum of 50. -The hares dominate! Rare event occurs, –The hares quickly. Near extinction. Evolution cycle

27
Interpretations Microevolutionary Features –how intrinsic robust design tradeoffs interact with and constrain natural selection to generate highly ordered structure from randomness. –creating habitats with different spark distributions P(i, j) Lattices in a habitat with skewed distributions become ‘‘specialists’’ and evolve like the hares, Lattices in a habitat with a spatially uniform distribution of sparks become ‘‘generalists’’ by developing a roughly uniform grid of barriers, which is optimal in their habitat. –never extinction but suboptimal with skewed distributions –Even though different genotypes, different layouts but essentially same phyenotypes (the pattern of the barriers) Macroevolutionary Consequences –Initiation of large extinction events is typically associated with rare or anomalous external causes, such as meteoroid impacts and large-scale geological change, whereas more frequent, smaller events are typically associated with a mixture of competition between species, as well as more commonplace variability in the habitat and other environmental conditions
 Lattices in a habitat with skewed distributions become ‘‘specialists’’ and evolve like the hares, Lattices in a habitat with a spatially uniform distribution of sparks become ‘‘generalists’’ by developing a roughly uniform grid of barriers, which is optimal in their habitat. –never extinction but suboptimal with skewed distributions –Even though different genotypes, different layouts but essentially same phyenotypes (the pattern of the barriers) Macroevolutionary Consequences –Initiation of large extinction events is typically associated with rare or anomalous external causes, such as meteoroid impacts and large-scale geological change, whereas more frequent, smaller events are typically associated with a mixture of competition between species, as well as more commonplace variability in the habitat and other environmental conditions.")
Similar presentations


 Vipin Kumar Army High Performance.>")


