Download presentation
Presentation is loading. Please wait.

1
1 Removal, Recovery, and Disposal of Carbon Dioxide 朱 信 Hsin Chu Professor Dept. of Environmental Engineering National Cheng Kung University

2
2 1. Introduction Three potential control points 1)The atmosphere 2)The surface waters of the oceans 3)The stacks: high CO 2 conc. Next slide (Table 5.1) Next slide (Table 5.1) Practical energy required >> 10 × (the thermodynamic min.) Removal:non fossil fuel energy source – nuclear or solar The only current feasible method: grow biomass – plants or algae Disposal (storge) Reuse Disposal (storge) Reuse
The atmosphere 2)The surface waters of the oceans 3)The stacks: high CO 2 conc. Next slide (Table 5.1) Next slide (Table 5.1) Practical energy required >> 10 × (the thermodynamic min.) Removal:non fossil fuel energy source – nuclear or solar The only current feasible method: grow biomass – plants or algae Disposal (storge) Reuse Disposal (storge) Reuse.")
4
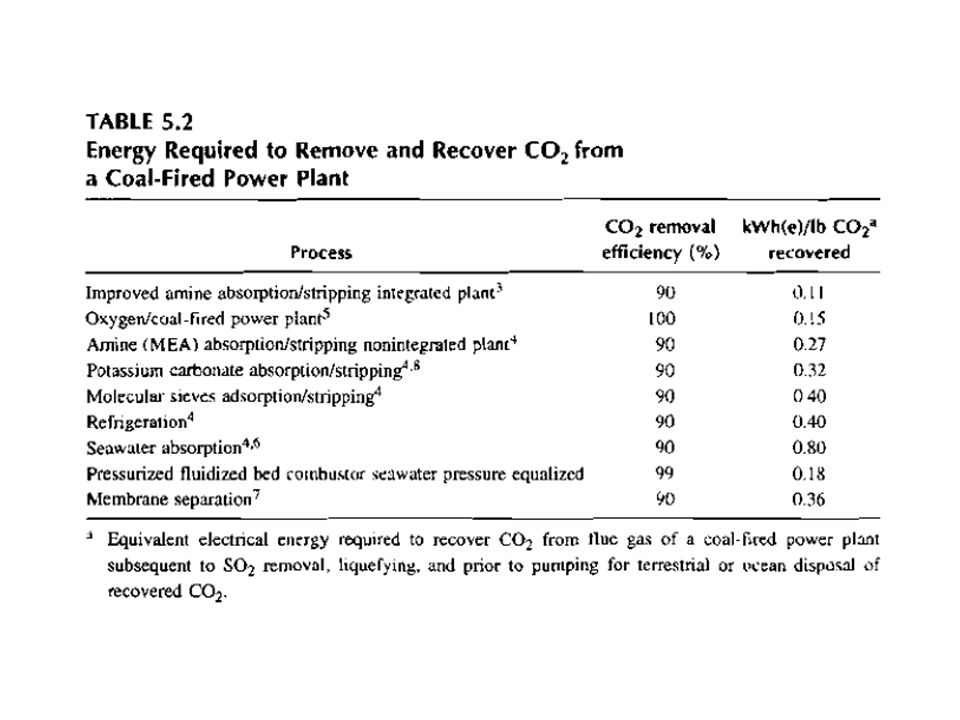
4 2. Removal and Recovery of CO 2 From Fossil-Fuel Combustion Sources: The electrical power generation sector: large and relatively easy to remove CO 2 The industrial and domestic thermal generation sector: small per unit The transportation power sector: tiny per unit Next slide (Table 5.2) Next slide (Table 5.2) methods for a coal-fired power plant
 Next slide (Table 5.2) methods for a coal-fired power plant.")
6
6 2.1 Absorption/Stripping Solvents (liquid) Alkanolamines (monoethanolamine (MEA)): the lowest energy required Alcohols (methanol) Glycols Absorption: lower temp Stripping: heated by steam 2.2 Adsorption/Stripping Sorbents (solid) charcoal Molecular sieves Adsorption: higher pressure Stripping: lower pressure
 Alkanolamines (monoethanolamine (MEA)): the lowest energy required Alcohols (methanol) Glycols Absorption: lower temp Stripping: heated by steam 2.2 Adsorption/Stripping Sorbents (solid) charcoal Molecular sieves Adsorption: higher pressure Stripping: lower pressure")
7
7 2.3 Refrigeration (Cryogenic) Gases are compressed → cooled down to a liquid or a solid 2.4 Membrane Separation Membrane (different pore sizes) Polymers Metals Rubber composites Gas absorption membrane composites Absorbing liquid on one side of a porous membrane: providing a large surface-contacting area
 Gases are compressed → cooled down to a liquid or a solid 2.4 Membrane Separation Membrane (different pore sizes) Polymers Metals Rubber composites Gas absorption membrane composites Absorbing liquid on one side of a porous membrane: providing a large surface-contacting area")
8
8 2.5 Seawater Absorption Does not work: solubility! Alternative: pumping flue gas deep into the ocean where the partial pressure of the dissolving CO 2 is equal to the pressure of the ocean at that depth. 2.6 Oxygen/Coal-Fired Power Plant Use pure O 2 for combustion Pure CO 2 in the flue gas → liquefying → sequestering or reusing Next slide (Fig. 5.1) Next slide (Fig. 5.1) Oxygen coal-fired plant flow chart
 Next slide (Fig. 5.1) Oxygen coal-fired plant flow chart.")
10
10 3. Disposal of CO 2 1)Ocean disposal 2)Depleted gas wells 3)Active oil wells (enhanced oil recovery) and depleted oil wells 4)Coal beds and mines 5)Salt domes 6)Aquifers 7)Natural minerals
Ocean disposal 2)Depleted gas wells 3)Active oil wells (enhanced oil recovery) and depleted oil wells 4)Coal beds and mines 5)Salt domes 6)Aquifers 7)Natural minerals.")
11
11 3.1 Ocean Disposal The upper layer of the ocean is in equilibrium with the atmosphere CO 2. Thermocline: about 1000ft below sea surface, at which point the ocean temperature abruptly decreases. Below the thermocline: the concentration of dissolved CO 2 is negligible. CO 2 can be pumped down and readily dissolved at the ocean depths. The capacity for dissolution of CO 2 in the ocean is adequate to absorb all the CO 2 from combustion of all the earth’s resources of fossil fuels. If liquid CO 2 is pumped deep enough within the ocean, the density of liquid CO 2 becomes greater than the density of seawater at that depth: liquid CO 2 can sink to the bottom floor of the ocean and form a lake of clathrates (solid compounds of a CO 2 molecule surrounded by about 5.75 molecules of water). liquid CO 2 is the most economical form to be disposed compared to gas or solid CO 2 (dry ice)
. liquid CO 2 is the most economical form to be disposed compared to gas or solid CO 2 (dry ice).")
12
12 3.2 Depleted Gas Wells Natural gas wells: high pressure without leakage Up to several thousand pounds per square inch Hundreds of depleted gas wells in the world: the capacity is limited Can only sequester the CO 2 from natural gas combustion (not enough for oil or coal): one volume of natural gas combustion produces one volume of CO 2 3.3 active oil wells Primary oil production only removes about a third of the oil from an active oil well. Various media, such as hot water, nitrogen, polymers, and CO 2 have been used for removal of the remaining two-thirds. CO 2 is preferred: in addition to displacement, CO 2 dissolves in the oil and reduces its viscosity, making it easier to pump out. Only a fraction of the oil combustion CO 2 can be sequestered in oil wells: gaseous CO 2 vol. >> liquid oil vol.

13
13 3.4 Coal Mines and Deep Beds Storage of CO 2 in mined-out and abandoned coal mine fields is not feasible: coal mines can’t be readily sealed to hold the pressure, gaseous CO 2 vol. >> solid coal vol. Deep coal deposits: CH 4 coexists with coal. Displacement of coal-bedded methane with CO 2 : production of CH 4, twice the volume of CO 2 can be absorbed on the surface of the coal than the natural gas originally present in the coal.

14
14 3.5 Salt Domes Pumping seawater from and to the ocean for solution mining salt: the salt domes have been used to store oil, storing the CO 2 is also possible. 3.6 Aquifers Shallow aquifers: water supply Deep aquifers: usually saline, a significant capacity for sequestering CO 2 Pressurized CO 2 could displace the water as well as dissolve in the water of deep aquifers

15
15 3.7 Natural Minerals Carbonate minerals: cannot be used Igneous rock: can react with CO 2 Magnesium oxide bound to silica: MgSiO 3 Alumina-forming aluminosilicates

16
16 4. Capacity for Sequestering CO 2 Next slide (Table 5.3) Next slide (Table 5.3) 300 years: equivalent to the recoverable coal reserves
 Next slide (Table 5.3) 300 years: equivalent to the recoverable coal reserves.")
18
18 5.System Study A pplication of the absorption/stripping system and disposal of the CO 2 Base year: 1980 5.1CO 2 Removal and Recovery System for Fossil-Fuel Power Plant Flue Gases 5.1.1CO 2 Emissions from Fossil Fuel Next slide (Table 5.4) Next slide (Table 5.4) CO 2 production by natural gas and fuel oil: 50% and 80% compared to coal
 Next slide (Table 5.4) CO 2 production by natural gas and fuel oil: 50% and 80% compared to coal")
20
20 5.1.2CO 2 Removal and Recovery Using Improved Solvent Process MEA absorption/stripping: conventional A newer alkanolamine-based solvent (DOW Gas/spec FS-1): more energy efficient Next slide (Table 5.5) Next slide (Table 5.5) Energy required: DOW FS-1 < MEA Following slide (Fig. 5.2) Following slide (Fig. 5.2) Flue gas > 250 ℉ Quenching → 120 ℉ before entering the absorber
 Following slide (Fig. 5.2) Flue gas > 250 ℉ Quenching → 120 ℉ before entering the absorber.")
23
23 DOW FS-1 Reaction (steam) CO 2 liquefying Compressed to 2000 psia in a four-stage compression system Passed through a cooler Liquefied in a condenser at about 80 ℉ Liquefying energy: 0.047 kwh(e)/lb of CO 2 recovered Nest slide (Table 5.6) Nest slide (Table 5.6) Energy required: mainly removal and liquefaction
 CO 2 liquefying Compressed to 2000 psia in a four-stage compression system Passed through a cooler Liquefied in a condenser at about 80 ℉ Liquefying energy: kwh(e)/lb of CO 2 recovered Nest slide (Table 5.6) Nest slide (Table 5.6) Energy required: mainly removal and liquefaction")
25
25 5.1.3 Integration of Power Plant and CO 2 Recovery System Next slide (Fig. 5.3) Next slide (Fig. 5.3) The extraction of latent heat from the low- pressure steam: otherwise would be lost in the condenser Following slide (Table 5.7) Following slide (Table 5.7) Integrated plant: efficiency drops a little
 Next slide (Fig. 5.3) The extraction of latent heat from the low- pressure steam: otherwise would be lost in the condenser Following slide (Table 5.7) Following slide (Table 5.7) Integrated plant: efficiency drops a little.")
28
28 5.1.4 CO 2 Recovery Plant Costs 100~1000 tons CO 2 /day ≒ 5.1 ~ 51 MWe power plant 15 US$/ton of CO 2 Next slide (Table 5.8) Next slide (Table 5.8) CO 2 recovery and disposal may double the electricity cost CO 2 recovery and disposal may double the electricity cost Total power consumption for CO 2 mitigation > 17% Plus conventional power plant in plant consumption < 8%
 Next slide (Table 5.8) CO 2 recovery and disposal may double the electricity cost CO 2 recovery and disposal may double the electricity cost Total power consumption for CO 2 mitigation > 17% Plus conventional power plant in plant consumption < 8%")
30
30 5.2 CO 2 Disposal Systems 6” pipeline from power plants to collection centers 36” pipeline from collection centers to the final sites 5.2.1 Ocean Disposal The density of liquid carbon dioxide < seawater but liquid CO 2 is much more compressible than seawater and has a much higher thermal coefficient of expansion. Therefore, the density of CO 2 > seawater of similar temp. (37 ℉ ) at about 3000 m depth Ocean depths of 3000 m: 4400 psia about 200 miles from the shoreline of most continents Alternative: 2000 psia liquid CO 2 pressure at a depth of 500 m already lower than thermocline About 100 miles from the shoreline of most continents Next slide (Fig. 5.4): 500 m depth disposal Next slide (Fig. 5.4)500 m depth disposal
 at about 3000 m depth Ocean depths of 3000 m: 4400 psia about 200 miles from the shoreline of most continents Alternative: 2000 psia liquid CO 2 pressure at a depth of 500 m already lower than thermocline About 100 miles from the shoreline of most continents Next slide (Fig. 5.4): 500 m depth disposal Next slide (Fig. 5.4)500 m depth disposal.")
32
32 An experiment is actually planned between the US nd Japan to inject CO 2 in the ocean off the coast of Hawaii and monitor the conc. of CO 2 at various ocean depth levels. Next slide (Fig. 5.4A) Next slide (Fig. 5.4A) Other injection methods (3, 4, 5)
 Next slide (Fig. 5.4A) Other injection methods (3, 4, 5).")
34
34 5.2.2 Oil and Gas Wells Disposal The US has 12,000 spent oil and gas wells Depleted wells: usually 100 ~ 500 psia An increase of about 10 ℉ for every 1000 ft of depth 10,000ft-depth well: 180 ℉ Recovered 80 ℉ 2,000 psia CO 2 → 180 ℉, 3,000 psia or more (10,000 psia) 5.2.3 Disposal in Salt Carverns Again, 3,000 psia or more
 Disposal in Salt Carverns Again, 3,000 psia or more")
35
35 6. Comparison of Capture and Disposal Costs Next slide (Table 5.16) Next slide (Table 5.16) Only for capture Disposal cost US $ 15~50/tonne CO 2 for 100 km distance
 Next slide (Table 5.16) Only for capture Disposal cost US $ 15~50/tonne CO 2 for 100 km distance.")
37
37 7. Problems Associated with Sequestering CO 2 in the Ocean Economic Capital and operating costs Engineering Deep CO 2 pipelines: a challenging problem Environmental effects The acidity of the ocean ↑ pH ↓ to < 8 Would kill marine organisms Rapid release of sequestered CO 2 Thermal plumes and volcanic action in the ocean could suddly release the sequestered CO 2

Similar presentations


 Power Plants and Geologic Carbon Sequestration Joe Chaisson.>")


. Contents The Need for CO 2 Capture and Storage 4 Reliance on Fossil Fuels 5 Largest CO 2 Emitters 7 Addressing the Challenge.>")


 Carbonate rocks (limestone and coral = CaCO 3 ) Deposits of Fossil fuels Carbon exists in the nonliving.>")


 with a small amount of other.>")


 with a small amount of other.>")
