Download presentation
Presentation is loading. Please wait.

1
Chapter 7: Atmospheric Disturbances Part II: T-storms, Tornadoes, Lightning & Forecasting

2
Nature of T-storms –Violent –Thunder & lightning –Hail –Strong updrafts & downdrafts T-storm formation stages –Cumulus stage –Mature stage –Dissipating stage Localized Severe Weather Figures 7-28 & 7-25

3
Localized Severe Weather Thunderstorms –Atmospheric conditions for t-storm formation High temperatures High humidity High instability Days with t-storms by latitude: Figure 7-26 Days per year with t-storms in U.S.: Figure 7-26

4
6-13-2004 Supercell

5
What it looked like under the supercell on 6-13-2004

6
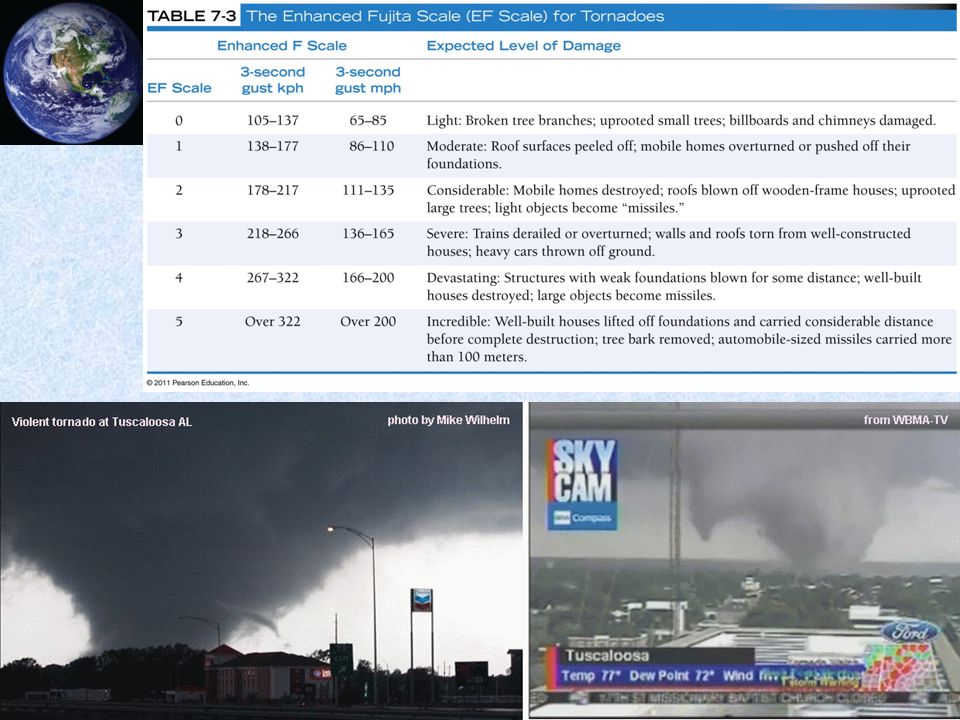
Localized Severe Weather Tornadoes –Deep low pressure vortex –Winds so violent, vacuum develops inside funnel May be in excess of 300 mph Most extreme pressure gradients known –Don’t know exact mechanism of formation Warm, moist, unstable air Spring & summer = most favorable Most occur in mid- afternoon –Time of max heating Figure 7-30

7
Localized Severe Weather Tornado formation –Vertical wind shear creates horizontal rotation –Horizontal rotation tilted vertical by updrafts –Mesocyclone & tornado development Figure 7-31

9
Localized Severe Weather Over 90% of reported tornadoes worldwide occur in the U.S. Figure 7-33Figure 7-32

11
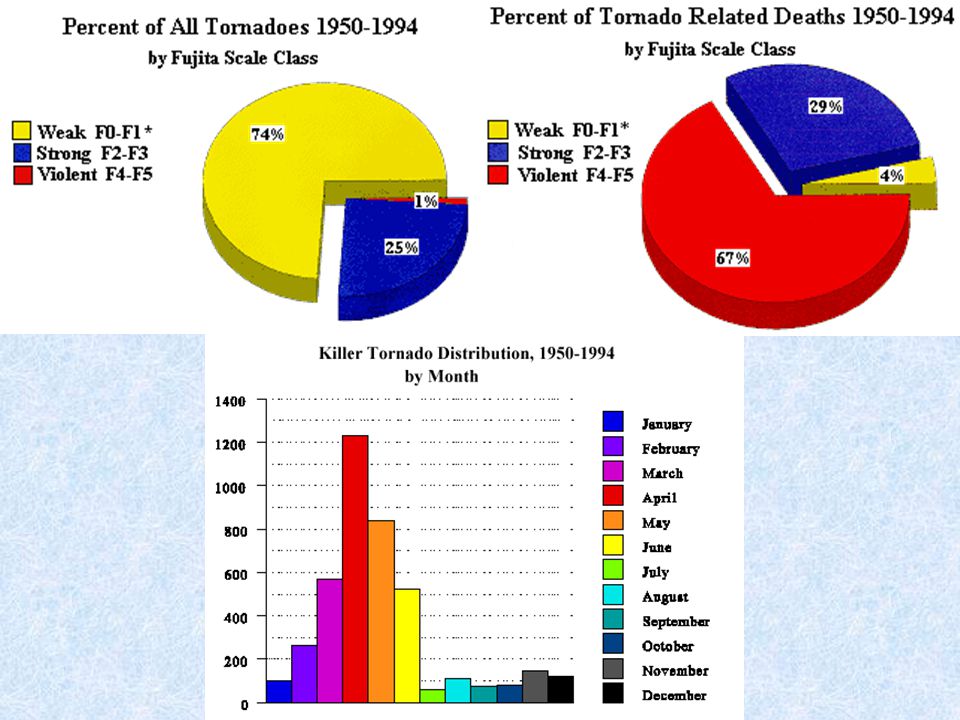
It’s all a matter of statistics: Who has the worst tornadoes?

12
8-28-1884 Howard, SD

13
Safest location in a building Opening windows to reduce damage Using highway overpasses as shelter Escaping a tornado in a vehicle Tornadoes “skip” houses Association of size with intensity Appearing to reach the ground Direction of travel Geographical scope Near various landscape features Attraction to mobile homes and/or trailer parks Downtown areas During winter Localized Severe Weather: Tornado Myths

14
April 2011 Tornado Outbreak

19
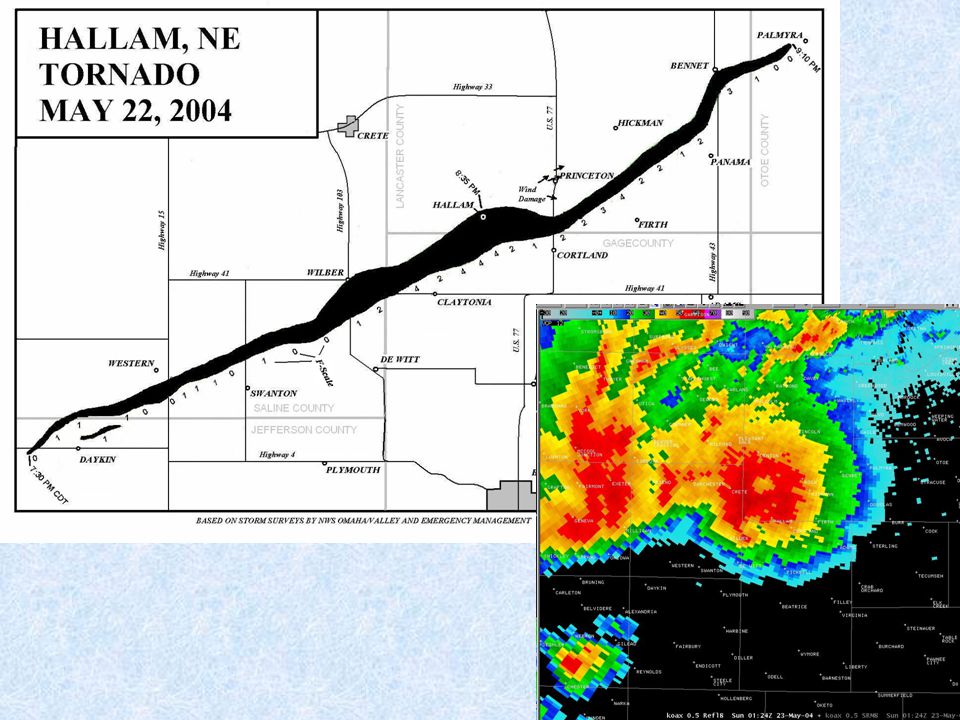
Hallam, NE (2004)
")
20
Omaha’s 1913 Easter Tornado

22
Localized Severe Weather Lightning –8.5 million bolts daily –Electric discharge in t-storms –Lightning types Cloud to ground Cloud to cloud Within cloud Thunder –Expansion of air from heat of lightning Time lightning distance –Speed of sound vs. speed of light Every 5 seconds equals about 1 mile Figure 7-29

24
Oklahoma – most tornadoes worldwide Vertical wind shear –Change in wind direction from storm’s bottom to top –Mesocyclones 50% develop into tornadoes NEXRAD –Doppler effect Vertical wind profiler –Dryline: boundary between mT & cT air OK Mesonetwork: –111 solar-powered weather stations Localized Severe Weather: Forecasting

25
Tornado warning issued Localized Severe Weather: Forecasting with NEXRAD Figure 7-E: Reflectivity = Storm intensity Figure 7-F: Motion detection = Funnel I.D.

Similar presentations