Download presentation
Presentation is loading. Please wait.

1
Office of Social and Economic Data Analysis March 11, 2011 Columbia, Missouri Bill Elder Missouri Rural Convening Missouri Rural Development Partners “The State of Rural Missouri”

2
Office of Social and Economic Data Analysis Overview Very Few Words about OSEDA Demographics of Rural Missouri –Changing meanings of “rural” –Diversity (demographics, economics, culture) –Aging –Connectedness Better “re-benchmarked” data coming http://www.ers.usda.gov/StateFacts/MO.htmhttp://www.ers.usda.gov/StateFacts/MO.htm
 –Aging –Connectedness Better re-benchmarked data coming")
3
Office of Social and Economic Data Analysis DataData InformationInformation KnowledgeKnowledge WisdomWisdom “The construction of knowledge involves more the orderly loss of information than it’s meaningless accumulation.” -- Kenneth Boulding Http://WWW.OSEDA.MISSOURI.EDU OSEDA… OSEDA collaborates with partners in the analysis of social and economic data in ways that contribute to improvements in the well-being of people, enterprises and communities.

4
Office of Social and Economic Data Analysis Aligning indicators to questions To know you have asked the “right” questions and produced “useful” answers….focus on decision makers and decision-making. Michael Quinn Patton Discussion … Collaboration

5
Office of Social and Economic Data Analysis Aligning indicators to questions To know you have asked the “right” questions and produced “useful” answers….focus on decision makers and decision-making. Michael Quinn Patton Discussion … Collaboration “New Media…” We are just beginning…

6
Office of Social and Economic Data Analysis Aligning indicators to questions To know you have asked the “right” questions and produced “useful” answers….focus on decision makers and decision-making. Michael Quinn Patton Discussion … Collaboration “New Media…” We are just beginning… “..No one of us is as good as all of us…” Dave Steckel

7
Office of Social and Economic Data Analysis New Census information … World: 6,892,893,953 U.S.: 311,874,651 (9.7%) Missouri: 5,988,927 (7.0%) 2010 Population Count & Percent Change from 2000 Check out new Census tools at census.gov and OSEDA and…. Elsewhere…

8
Office of Social and Economic Data Analysis New Census information … Complete Count Data American Community Survey (ACS) “Period Estimates by Size” Just Google “Census” or “OSEDA” for More information
 Period Estimates by Size Just Google Census or OSEDA for More information")
9
Office of Social and Economic Data Analysis About to Lose the Missouri Ninth…

10
Office of Social and Economic Data Analysis Rapid growth and large states Five states account for 17% of U.S. Growth Six states account for 54% of U.S. Growth not just fast but.. Big 37 M 25 M 18.8 M

11
Office of Social and Economic Data Analysis Diverse Trends: Regions within Regions More Regions of growth near regions of decline

12
Office of Social and Economic Data Analysis

14
“Urban” and “Rural” Connections

15
Office of Social and Economic Data Analysis Dots make patterns more apparent

16
Office of Social and Economic Data Analysis

18
Missouri Core Based Statistical Areas

19
Office of Social and Economic Data Analysis 2000 - 2010 AREACounties2010 CountPct StateChange Pct Change Metro34 4,375,51073.1% 305,5487.5% Non-Metro81 1,613,41726.9% 88,1685.8% Micro24 803,42713.4% 64,7018.8% Non-Mirco57 809,99013.5% 23,4673.0% Missouri115 5,988,927100.0% 393,7167.0% 2010 Missouri “Metro” and “non-Metro” Source: U.S. Census, 2010 Census “Public Law 94 File”

20
Office of Social and Economic Data Analysis 2000 - 2010 AREACounties2010 CountPct StateChange Pct Change Over 100 K10 3,450,27557.6% 190,5655.8% 20 to 100 K45 1,858,93831.0% 194,06711.7% Under 20 K60 679,71411.3% 9,0841.4% 115 5,988,927100.0% 393,7167.0% 2010 Missouri Population by County Size Source: U.S. Census, 2010 Census “Public Law 94 File”

21
Office of Social and Economic Data Analysis

26
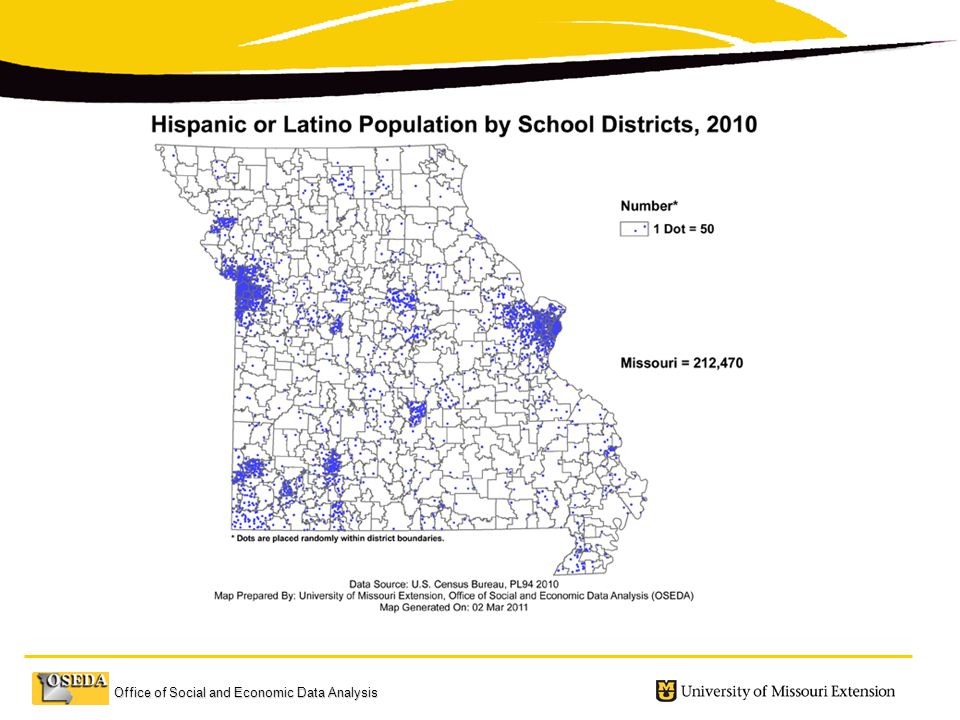
Speaking English Less than “Very Well” In 2009, the ACS estimated that over 24.5 million persons in the U.S. speak English less than “very well” -- 8.6% of U.S. population over 5 years old. The corresponding number in Missouri was 118,793 or 2.1%. The Missouri five year ACS period estimates reflect a distribution of this population among service centers and certain agricultural industries.

27
Office of Social and Economic Data Analysis Male Female Male Female Population Pyramids of Missouri Percent of Total Population 20002020 New Pyramids in March

28
Office of Social and Economic Data Analysis

29
Quality of Life

30
Office of Social and Economic Data Analysis Percent Population Over 65

31
Office of Social and Economic Data Analysis Aging in Place in the North Percent 85+

32
Office of Social and Economic Data Analysis

33
Quality of Life --- Children

34
Office of Social and Economic Data Analysis Married-Couple Families In 2009, married-couple families comprised less than 50% of Missouri households. (Missouri, US Census, 2009 American Community Survey) County Estimates from 5-Year ACS Data.
 County Estimates from 5-Year ACS Data..")
35
Office of Social and Economic Data Analysis Married Couple Families with Children Missouri married couple families with children declined to 19.4% of households in 2009 -- nearly 29,000 fewer than in 2006 (ACS, 2009) County Estimates from 5-Year ACS Data.
 County Estimates from 5-Year ACS Data.")
36
Office of Social and Economic Data Analysis Commuting…. Percent of Working Outside County of Residence, 2005-2009 ACS County Estimates from 5-Year ACS Data.

37
Office of Social and Economic Data Analysis Household Income Missouri median household income increase by 5.3% between 2006 and 2009 from $42,841 to $45,229. Meanwhile, U.S. Median household income rose 3.5% from $48,451 to $50,221. Not surprisingly, the five year ACS period estimates show higher incomes associated with urban areas and major transportation routes.

38
Office of Social and Economic Data Analysis Challenging Times….

39
Office of Social and Economic Data Analysis Challenging Times... Regional Differences

40
Office of Social and Economic Data Analysis High School Completers The 2009 ACS reported that 1.3 million Missourians 25 and older had a high school education (32.0%). The corresponding U.S. number is 57.6 million (28.5%). The ACS five year estimates show relatively lower rates of high school completion in south central Missouri and the “Bootheel.” Regions also associated lower income levels and higher poverty rates.
. The ACS five year estimates show relatively lower rates of high school completion in south central Missouri and the Bootheel. Regions also associated lower income levels and higher poverty rates..")
41
Office of Social and Economic Data Analysis Bachelor’s Degrees The 2009 ACS reported that nearly a million Missourians 25 and older had completed a bachelor’s degree (25.2%). That is up from 17.8% in 1990 and 21.6% in 2000. The corresponding U.S. number of persons with a bachelor’s degree in 2009 was 53.3 million (27.9%). Five-Year period ACS Estimates Shows Missourians with higher education are centered in regional trade and service centers
. Five-Year period ACS Estimates Shows Missourians with higher education are centered in regional trade and service centers.")
42
Office of Social and Economic Data Analysis From the “Employer” Report: Returns to Associate Degrees

43
Office of Social and Economic Data Analysis From the “Employer” Report: Returns to Bachelor Degrees

44
Office of Social and Economic Data Analysis March 11, 2011 Columbia, Missouri Bill Elder Missouri Rural Convening Missouri Rural Development Partners “The State of Rural Missouri”

Similar presentations


 Demographic Highlights TEXAS is: big. The population.>")


 June 2009.>")


 University of Missouri.>")


