Download presentation
Presentation is loading. Please wait.

1
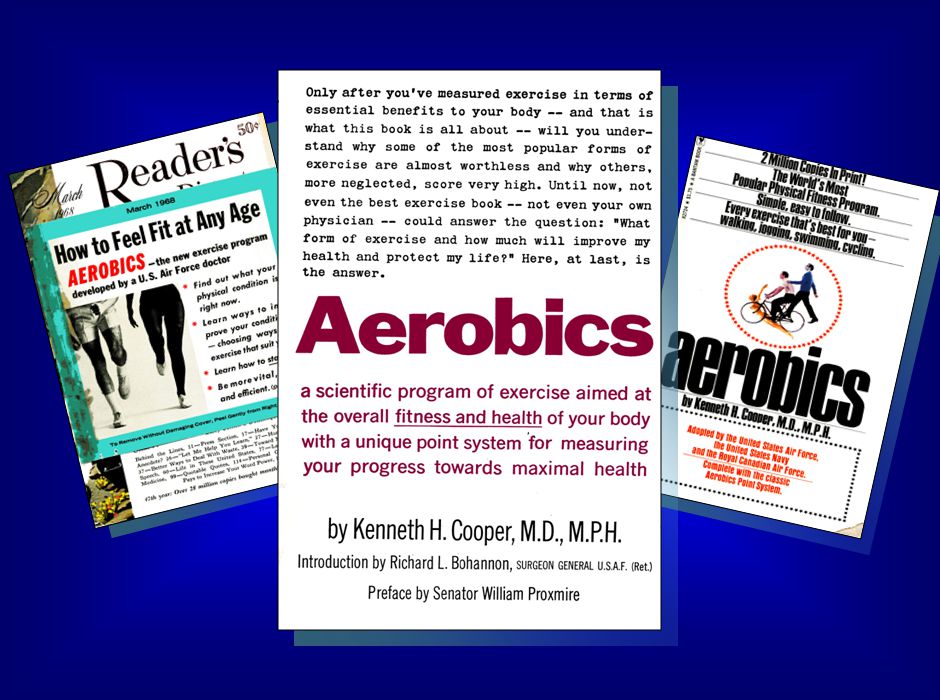
Kenneth H. Cooper, M.D., M.P.H. Founder & Chairman The Cooper Aerobics Center 12200 Preston Road Dallas, Texas Aerobics: Past. Present. Future.

3
American Adult Exercise Habits 1968-2008 ExercisingExercising 1968 < 24 % 1984 59 % 1990 40 % JoggingJogging < 100,000 34 million 30 million 48 % CVD Russia: 31 % Poland: 36 % Hungary: 40 % Romania: 60 %

4
American Adult Exercise Habits 1968-1990 1968 - 1990 Medical Treatment 33 % Lifestyle Change 67 % Cigarette Smoking Blood Pressure Control Cholesterol Reduction Stress Management Increased Activity CV Deaths 48 %

7
Annual Deaths Related to Tobacco Usage United Nations Agency (Feb 2010) 5 MillionCardiovascular Disease CancerDiabetes Other Chronic Diseases 600,000Secondhand Smoke 5 MillionCardiovascular Disease CancerDiabetes Other Chronic Diseases 600,000Secondhand Smoke
 5 MillionCardiovascular Disease CancerDiabetes Other Chronic Diseases 600,000Secondhand Smoke 5 MillionCardiovascular Disease CancerDiabetes Other Chronic Diseases 600,000Secondhand Smoke")
8
Smoking Frequency (WHO Feb 2010) China31.4% (Men 57.4%) India33.9% (Men 57.0%) United States19.8%* China31.4% (Men 57.4%) India33.9% (Men 57.0%) United States19.8%* *Cost: $196 million/yr in medical costs and productivity
 China31.4% (Men 57.4%) India33.9% (Men 57.0%) United States19.8%* China31.4% (Men 57.4%) India33.9% (Men 57.0%) United States19.8%* *Cost: $196 million/yr in medical costs and productivity")
9
American Adult Exercise Habits 1968-1990 1968 - 1990 Medical Treatment 33 % Lifestyle Change 67 % Cigarette Smoking Blood Pressure Control Cholesterol Reduction Stress Management Increased Activity CV Deaths 48 %

10
Source: JAMA, Mar 10, 2004, Vol. 291, No. 10. Actual Causes of Death 1990 Tobacco 400 Diet/Exercise 300 Alcohol 100 Infection 90 Guns Sex M. Veh.* Drugs 20 0 50 100 150 200 250 300 350 400 450 Deaths (1000's) Drugs Diet/Exercise Alcohol Infection Tobacco Sex Related Motor Vehicles Guns 35 30 47 435 365 75 29 20 43 85 17 *Alcohol-related deaths: 1990 – 22,084 2000 – 16,653 /2000
 Drugs Diet/Exercise Alcohol Infection Tobacco Sex Related Motor Vehicles Guns *Alcohol-related deaths: 1990 – 22, – 16,653 /2000.")
11
Body Mass Index 130 65 ÷ 65 x 703 = 21.7 BMI 165 65 ÷ 65 x 703 = 27.5 BMI Examples Range BMI 30Obese (34 %) 30Obese (34 %) BMI = (Weight in kilograms ) (Height in meters squared)
 30Obese (34 %) BMI = (Weight in kilograms ) (Height in meters squared)")
12
Obesity Trends* Among U.S. Adults BRFSS, 1990 (*BMI ≥30, or ~ 30 lbs overweight for 5’ 4” woman) No Data <10% 10%–14%
 No Data <10% 10%–14%.")
14
Diabetes Trends* Among Adults in the U.S., (Includes Gestational Diabetes) 2007 Source: CDC’s Division of Diabetes Translation. National Diabetes Surveillance System available at http://www.cdc.gov/diabetes/statistics No Data 9.0%

15
Source: “Mending Broken Hearts,” National Geographic, Feb. 2007

16
Price-Adjusted Per-Capita Medicare Spending

17
Percentages of Overweight or Obese Youth Aged 10-17 Years in 2007 Source: Source: Child and Adolescent Health Measurement Initiative: 2007 National Survey of Children's Health

18
Worldwide Obesity 2010 Highest CountryWomenMen United States 36%32% Mexico35%24% Chile32%19% Lowest CountryWomenMen Japan3%3% Korea4%4% Switzerland8%9% Source: Organization for Economic Cooperation and Development data on OBCD member countries

19
Source: George Washington University, 2010 The Annual Cost of Excess Body Weight (Sick Days, Productivity, Fuel) Obese (> 30 BMI) Women$4,879 Men$2,646 Overweight (25-30 BMI) Women$524 Men$432
 Obese (> 30 BMI) Women$4,879 Men$2,646 Overweight (25-30 BMI) Women$524 Men$432")
20
Proportion of Overweight Children in the United States Source: Centers for Disease Control and Prevention, 2003. 18.8%

21
1 out of 3 children will develop diabetes (higher in Hispanics and African-Americans) 1 out of 3 children will develop diabetes (higher in Hispanics and African-Americans) There is an epidemic of adult-onset diabetes being seen in children. It is estimated that among children born after the year 2000: If they develop adult-onset diabetes before 14 years of age, it is estimated that that will shorten their lifespan by 17 to 27 years. As a result, this may be the first generation in which parents live longer than their children.

22
The Cooper Institute Cooper Clinic Dallas & Craig Ranch Cooper Fitness Center & Spa Dallas & Craig Ranch The Guest Lodge Cooper Wellness Program Cooper Ventures Cooper Concepts Cooper Benefits CooperLife Cooper Weight Loss

24
0 2 4 6 8 10 12 14 16 18 20 22 24 26 2 6 10 14 18 22 BALKEPROTOCOL At 25:00 min speed Increases 0.2 mph/per min Calculated 3.3 mph Speed Minutes Grade (%)
")
25
Definitions Of Fitness Categories For Males

26
Definitions Of Fitness Categories For Females

29
Age-Adjusted All-Cause Mortality by Fitness Groups, Men Age-Adjusted All-Cause Mortality/10,000 PY Fitness Groups

30
Fitness and All-Cause Mortality, Men Age-Adjusted All-Cause Mortality/ 10,000 PY Very Poor Poor Fair Good Excellent/Superior Unfit Fit Health & Longevity Fitness Aerobic Fitness

31
Exercising and Aging Telomeres are protective tips on bundles of genes inside cells Every time a cell divides, telomeres get shorter Aging occurs as cells reach the end of the telomere and die ─ muscle weakens, skin wrinkles, and thinking clouds Telomeres are protective tips on bundles of genes inside cells Every time a cell divides, telomeres get shorter Aging occurs as cells reach the end of the telomere and die ─ muscle weakens, skin wrinkles, and thinking clouds Arch of Int Med, Jan 28, 2008

32
Exercise and Aging 2,401 British Twins 2,401 British Twins Long-term study, length of telomeres measured 2,401 British Twins 2,401 British Twins Long-term study, length of telomeres measured Arch of Int Med, Jan 28, 2008 Exercise (min/wk) Reduction in Age (years) 16:00Baseline 100:00 5.0 - 6.0 180:009.0
 Reduction in Age (years) 16:00Baseline 100: :009.0")
33
Aerobic Fitness 35 Aerobic points/week Run 2.0 miles < 20:00 minutes 4x/week Walk 3.0 miles < 45:00 minutes 5x/week Aerobic dance 45:00 minutes 4x/week 35 Aerobic points/week Run 2.0 miles < 20:00 minutes 4x/week Walk 3.0 miles < 45:00 minutes 5x/week Aerobic dance 45:00 minutes 4x/week

34
Health and Longevity Fitness 15 aerobic points /week Walk 2.0 miles < 30:00 minutes 3x/week Walk 2.0 miles < 35:00 minutes 4x/week Walk 2.0 miles < 40:00 minutes 5x/week Walk 3.0 miles < 45:00 minutes 2x/week Aerobic dance 45:00 minutes 2x/week 15 aerobic points /week Walk 2.0 miles < 30:00 minutes 3x/week Walk 2.0 miles < 35:00 minutes 4x/week Walk 2.0 miles < 40:00 minutes 5x/week Walk 3.0 miles < 45:00 minutes 2x/week Aerobic dance 45:00 minutes 2x/week

Similar presentations


 and understand its scope and effects Share who some of the.>")


 of 30 or higher. Obesity: Body Mass Index (BMI) of 30 or higher.>")


 624-5006 NEARLY HALF OF ALL MASSACHUSETTS RESIDENTS OVERWEIGHT.>")
